MACD, short for Moving Average Convergence Divergence, is a technical indicator that describes the relationship between two moving averages. Spread bettors use it to assess trend conditions, monitor changes in momentum and define possible entry or exit signals. Its three familiar components are the MACD line, the signal line and the histogram. Together, they organise information already contained in price history; they do not reveal where the next price move must go. A useful MACD spread betting method therefore connects the indicator with price structure, an executable dealing quote, a position size and a plan for closing the trade when the original reasoning no longer applies.
This guide explains the calculation, common interpretations, suitable trading approaches and practical consequences of using MACD with financial spread betting. All worked examples use hypothetical prices, indicator values and costs. They demonstrate mechanics rather than provide evidence of a profitable strategy. The Financial Conduct Authority includes spread bets within its coverage of contracts for difference, which it describes as high-risk products unsuitable for some retail consumers. A technical indicator does not reduce the financial effect of a leveraged position moving against its holder. Learning to recognise a crossover is only one small part of learning whether, when and at what stake to place a trade.
What does MACD measure?
MACD measures the difference between a faster moving average and a slower moving average of the same price series. When the faster average is above the slower one, the MACD line is positive. When it is below, the line is negative. Changes in that difference help describe whether the averages are moving further apart or closer together. Traders use this as a view of trend and momentum, but it is a mathematical transformation of past prices rather than a separate observation of demand. MACD does not measure trading volume, company earnings, market valuation or the probability that a particular spread bet will finish in profit.
The indicator is also unbounded: it does not have a fixed zero-to-100 scale or universal overbought and oversold thresholds. Its values are expressed in the units of the price series used to calculate it. An index MACD reading of 20 cannot be compared directly with a currency MACD reading of 0.0020 to decide which opportunity is stronger. Even comparisons within one market can be affected by changes in the price level and volatility. This separates MACD from RSI, which uses a bounded scale. It also explains why selecting trades simply because the MACD line looks unusually high or low on an automatically rescaled chart is an incomplete method.
How MACD is calculated
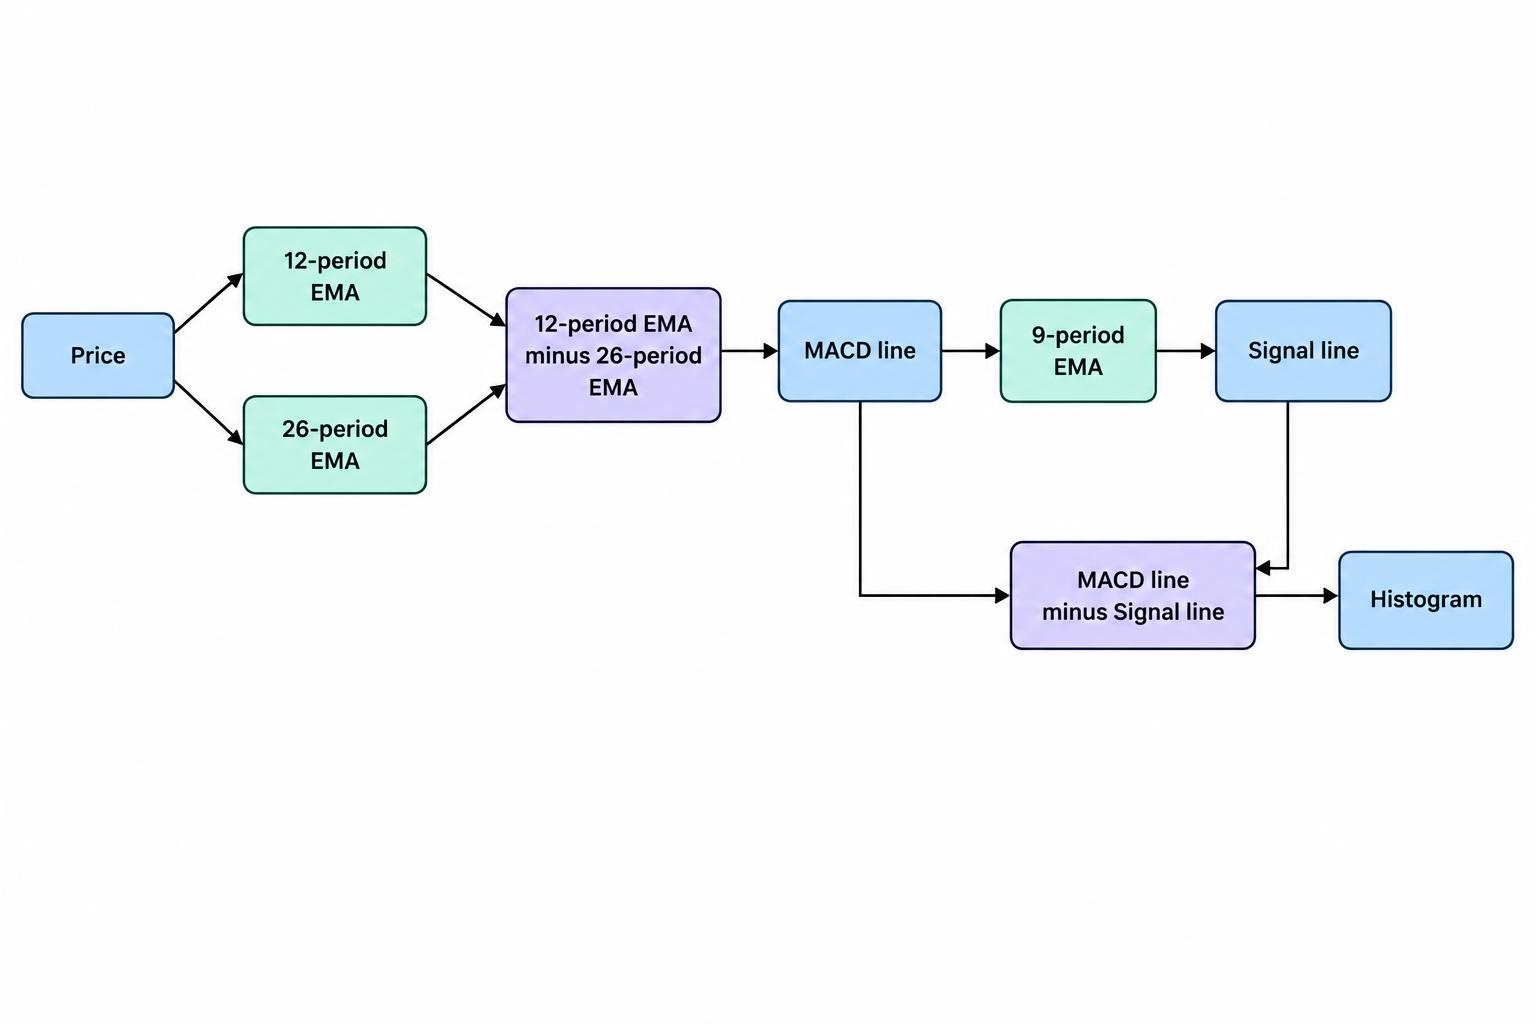
The conventional settings are 12, 26 and 9. The MACD line is the 12-period exponential moving average of price minus the 26-period exponential moving average. The signal line is a nine-period exponential moving average of the MACD line itself. The histogram is the MACD line minus the signal line. The StockCharts MACD documentation sets out these standard settings and formulas. The nine-period signal is therefore not a nine-period average of the market price. Confusing those two inputs produces a different calculation. Charting software normally performs the arithmetic, but knowing what each component represents helps prevent mistakes when interpreting crossovers and configuring alerts.
An exponential moving average gives greater weight to recent observations while retaining a declining influence from older ones. Its usual update is the previous EMA plus a smoothing factor multiplied by the difference between the latest observation and the previous EMA. The factor is 2 divided by the period length plus one. That gives approximately 0.1538 for a 12-period EMA, 0.0741 for a 26-period EMA and 0.2 for a nine-period EMA. In the signal-line calculation, the new observation is the MACD value, not the closing price. Initialisation choices and the amount of earlier data available can affect the first displayed values, so a calculation should have enough preceding history before its signals are assessed.
| Component | Conventional calculation | What it describes |
|---|---|---|
| MACD line | 12-period price EMA minus 26-period price EMA | The difference between the faster and slower averages |
| Signal line | Nine-period EMA of the MACD line | A smoothed reference for the MACD line |
| Histogram | MACD line minus signal line | The distance between those two lines |
| Zero line | Fixed reference at zero | Equality of the price EMAs for MACD, or equality of MACD and signal for the histogram |
A simple numerical example
Suppose the fast price EMA is 101 and the slow price EMA is 99. The MACD line is therefore 2. If the signal line is 1.5, the histogram is 0.5. Now suppose the next completed bar produces a MACD value of 1.8. Applying the nine-period EMA update gives a new signal value of 1.5 + 0.2 × (1.8 − 1.5), or 1.56. The new histogram is 1.8 − 1.56, or 0.24. The MACD line remains positive and remains above its signal, but the histogram has contracted. This is a change in the relationship between the averages, not proof that the underlying price has begun a sustained decline.
Signal-line crossovers and zero-line crossovers
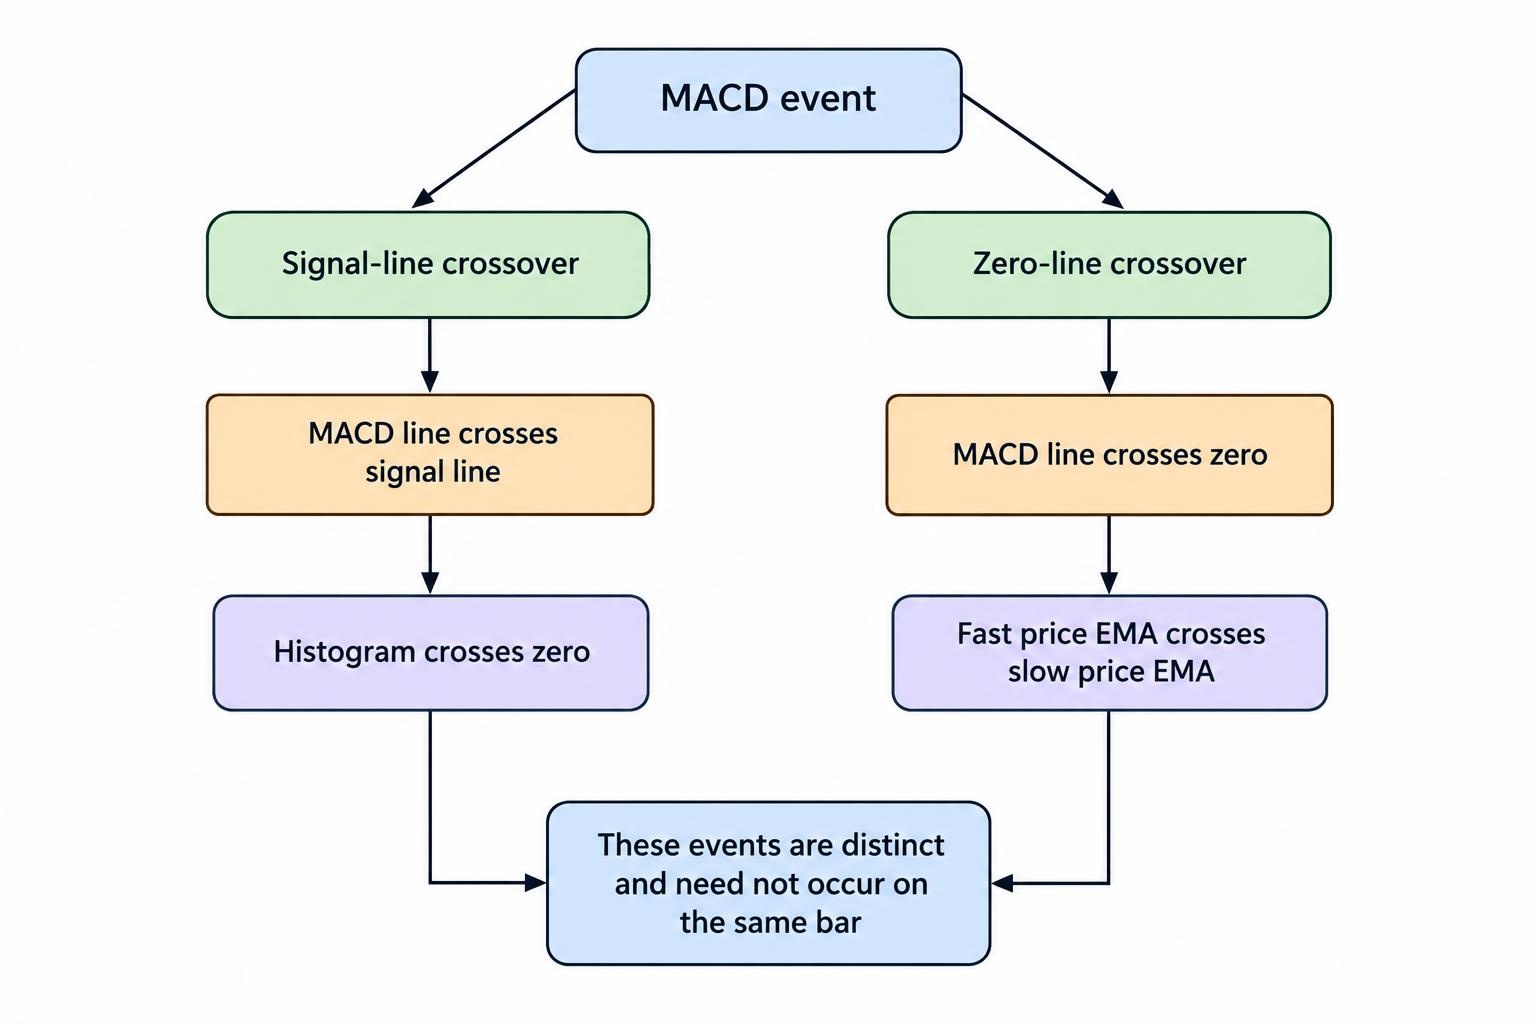
A bullish signal-line crossover occurs when MACD moves from at or below its signal line to above it. A bearish crossover is the reverse. A zero-line crossover refers to the MACD line moving through zero, which happens when the fast price EMA crosses the slow price EMA. These are different events and need not happen on the same bar. The TradingView MACD documentation describes the components and their relationships. For a written trading rule, distinguish a crossing event from an existing condition: “MACD crossed above the signal on this completed bar” is different from “MACD has remained above the signal for the last six bars.”
A bullish signal-line crossover can happen while both lines remain below zero. For example, MACD at −8 is above a signal line at −10, even though the faster price average is still below the slower one. That may be used to investigate improving momentum within a decline, but it is not equivalent to a confirmed upward price trend. A bearish signal crossover can likewise occur above zero during a pause in an advancing market. Requiring an additional zero-line condition changes the strategy rather than making the original signal automatically correct. It may remove some trades, delay others and alter the entry price enough to change the potential reward relative to risk.
Reading the MACD histogram correctly
The histogram shows the distance between MACD and its signal line. Positive bars mean MACD is above the signal; negative bars mean it is below. A histogram crossing zero therefore represents the same mathematical event as a signal-line crossover. Counting both as separate confirmations gives the appearance of extra evidence without adding information. Histogram bars can also be positive but shrinking, or negative but becoming less negative. Those states describe a changing distance between the lines. They do not directly specify the next candle’s direction, the speed of the next price move or the probability of a reversal. Colours vary between platforms, so read the values and display settings rather than relying on green and red alone.
Consider negative histogram values progressing from −6 to −4 to −2. A trader may describe that as weakening downside momentum, but the MACD line is still below its signal throughout the sequence. It has not yet crossed above it. Entering on the first shrinking negative bar is therefore a different rule from waiting for a zero crossing. Earlier entry can improve the price if the reversal continues, but it can also anticipate a crossover that never arrives. A fair comparison must include both possibilities. Record exactly which bar qualifies, whether the candle must close and whether the same entry remains valid if the available quote moves substantially before the order can be placed.
MACD settings, timeframes and platform differences
The numbers 12, 26 and 9 refer to bars on the selected timeframe, not automatically to days. On an hourly chart, MACD uses hourly observations; on a daily chart, it uses daily observations. Shorter periods usually respond more quickly to recent changes, while longer periods generally smooth them more heavily. Neither choice establishes a trading advantage. A faster setting may produce an earlier signal but also more frequent reversals, increasing turnover and costs. Before changing the settings, state what problem the change is intended to solve. Test the resulting complete method rather than selecting whichever line arrangement looks most convincing on a few successful historical trades.
Check the calculation settings as well as the period lengths. Some platforms allow simple moving averages in place of exponential averages, including for the signal line, so matching the three numbers alone does not guarantee matching signals. The chart’s input price, trading session and underlying instrument also matter. A cash index, its futures contract and a spread betting quote can produce different candles. For strategies using more than one timeframe, an unfinished daily MACD value can change while the hourly chart is trading. If the rule requires confirmed daily information, use the most recently completed daily bar rather than treating the current partial value as though it were already final.
MACD spread betting strategies
Trend following with a momentum trigger
A trend-following approach can use price structure to define direction and MACD to define a trigger within that direction. An illustrative long rule might require higher swing highs and higher swing lows, followed by a bullish MACD signal crossover after a pullback. The corresponding short rule would look for lower highs and lower lows, then a bearish crossover following a rally. These conditions describe a testable hypothesis, not a validated strategy. The trend trading guide covers the wider process. The crucial practical question is whether the available entry, stop and likely holding period still make sense when the crossover appears, rather than whether the chart contains a recognisable signal somewhere in its history.
Breakout and momentum trading
For a breakout method, a trader might require price to finish beyond a previously defined resistance level while MACD is positive and above its signal. The MACD conditions then act as a filter, while the price break provides the entry event. However, both observations are derived from the same price movement, so their agreement should not be presented as independent proof. Waiting for the filter may also mean buying after a large rise, leaving little room before the next resistance area. Compare the filtered method with the same price breakout without the filter. Our guides to breakout trading and momentum trading explain the associated problems of failed breaks, late entries and changing volatility.
Range conditions and repeated false signals
When price moves back and forth within a narrow range, the fast and slow averages can repeatedly converge and cross without a sustained move following. This creates whipsaw: an entry is followed by a reversal, then another entry in the opposite direction. Small individual losses and dealing costs can accumulate quickly. A trader might exclude tightly ranging conditions, require a price break or investigate a separate range trading approach. Each choice changes the rules and must be assessed on its own results. Avoid deciding that the market was “too sideways” only after a losing trade. The exclusion needs an observable definition that was available before entry, otherwise it cannot be applied consistently or tested fairly.
| Use of MACD | Illustrative condition | Role in the method | Main weakness |
|---|---|---|---|
| Trend pullback entry | Signal crossover in the direction of a price trend | Timing condition | The pullback may become a reversal |
| Breakout filter | MACD above zero and signal during an upward price break | Restricts eligible entries | Can delay entry or repeat information already in price |
| Reversal investigation | Price and MACD form diverging swings | Flags a possible change | Offers uncertain timing and no guaranteed reversal |
| Exit condition | Opposing crossover on a completed bar | Defines a planned exit event | Does not cap the financial loss |
MACD divergence: a warning to investigate, not a forecast
Regular bullish divergence occurs when price forms a lower low while the MACD line forms a higher low. Regular bearish divergence occurs when price forms a higher high while MACD forms a lower high. Traders interpret these patterns as a possible weakening of the previous movement, but weaker momentum can coexist with a continuing trend. A market can rise more slowly and still punish a short position entered too early. State whether the analysis uses the MACD line or the histogram, because those are different series and can produce different patterns. A method described only as “trade MACD divergence” leaves too much undefined to assess its results or reproduce its decisions.
Choose corresponding price and indicator swings using a stated rule. If a swing low requires two later candles to confirm it, the pattern was not available at the lowest candle itself. Entering there in a backtest using later confirmation introduces information that a trader did not yet have. This issue also affects automatic divergence labels that appear retrospectively beside historical turning points. Hidden divergence, which traders sometimes use as a continuation hypothesis, requires the same discipline: higher price lows with lower indicator lows for a bullish pattern, and lower price highs with higher indicator highs for a bearish pattern. Neither version provides an entry price, a maximum loss or a reason to disregard contradictory price behaviour.
Practical example: buying an index after a bullish MACD crossover
Assume a hypothetical index has an established upward price trend and has pulled back towards a previously identified support area. A completed hourly candle produces a bullish MACD signal crossover while the price holds that area. The available quote is 10,400 to sell and 10,402 to buy. A trader buys at 10,402 for £0.50 per point, places an ordinary stop at 10,352 and plans to close at an executable sell price of 10,502. The 50-point entry-to-stop distance gives £25 of planned price risk. The target is 100 points above entry, giving £50 of potential price profit. These are planned distances, not guaranteed realised results or evidence that the setup has a positive expected return.
Because the calculation uses the actual buy entry and executable sell exits, the dealing spread is already included in the price result. Immediately selling at the unchanged quote of 10,400 would lose £1. Assume the eventual holding period incurs £3 in funding and no other separate charges. A target exit at 10,502 produces £47 net profit. A smaller exit at 10,412 produces £2 after funding, while an exit at the original entry price loses £3. The sell price needed for cash break-even is 10,408. The same illustrative funding charge is used across the outcomes below to isolate the effect of exit price; real charges depend on the actual product and holding period.
| Outcome | Executable sell exit | Price profit or loss | Assumed funding | Net result |
|---|---|---|---|---|
| Target reached | 10,502 | £50 | £3 | £47 |
| Early exit with a small gain | 10,412 | £5 | £3 | £2 |
| Exit at the entry price | 10,402 | £0 | £3 | −£3 |
| Ordinary stop fills as planned | 10,352 | −£25 | £3 | −£28 |
| Gap through the stop | 10,302 | −£50 | £3 | −£53 |
The gap outcome shows why the MACD signal cannot determine the maximum loss. If the market moves through an ordinary stop before an execution is available, the closing price can be worse than the requested level. Waiting for a bearish MACD crossover instead would not solve that problem and could leave the position open for longer. A guaranteed stop, where offered and subject to its terms, can protect the specified stop price, but any charge and restrictions must be included in the plan. The guides to stop losses, guaranteed stops and gap risk explain the distinction between a planned exit instruction and protection against execution beyond that price.
Practical example: selling a forex rally with MACD
Suppose GBP/USD has been making lower price highs and lower lows. A rally stalls below resistance, and MACD crosses below its signal on a completed hourly bar while remaining below zero. A hypothetical entry rule also requires price to break the rally’s latest minor support. The quote is then 1.2700 to sell and 1.2702 to buy. The trader sells at 1.2700 for £0.50 per pip, with one pip defined here as 0.0001. A buy-side stop at 1.2760 is 60 pips away, giving £30 of planned price risk. A target buy price of 1.2580 would produce a 120-pip gain, worth £60 before separate charges.
With £4 in assumed funding, reaching the target produces a £56 net profit. Closing instead at a buy price of 1.2690 gives a ten-pip gain worth £5, leaving only £1 after funding. A stop execution at 1.2760 loses £34 including that charge; a gap to an executable buy price of 1.2800 loses £54. A short position does not automatically receive a funding credit. Confirm the actual financing terms and whether the provider defines its quoted point as a pip or a smaller increment. Using a stake against the wrong unit can change exposure sharply. None of those contract details can be inferred from the MACD settings or the shape of its histogram.
Position sizing and choosing a price stop
MACD values are not a substitute for an executable price stop. Even though the indicator uses price units, a two-point change in MACD does not translate into a fixed two-point change in the market. In the index example, a £25 price-risk budget divided by a 50-point stop distance gives a stake of £0.50 per point. If the budget must include the assumed £3 funding charge, £22 remains for the planned price loss, giving £0.44 per point before allowing for other costs or slippage. A minimum permitted stake might make that trade impractical. Position size should follow the acceptable financial exposure, rather than being chosen because the signal appears unusually convincing.
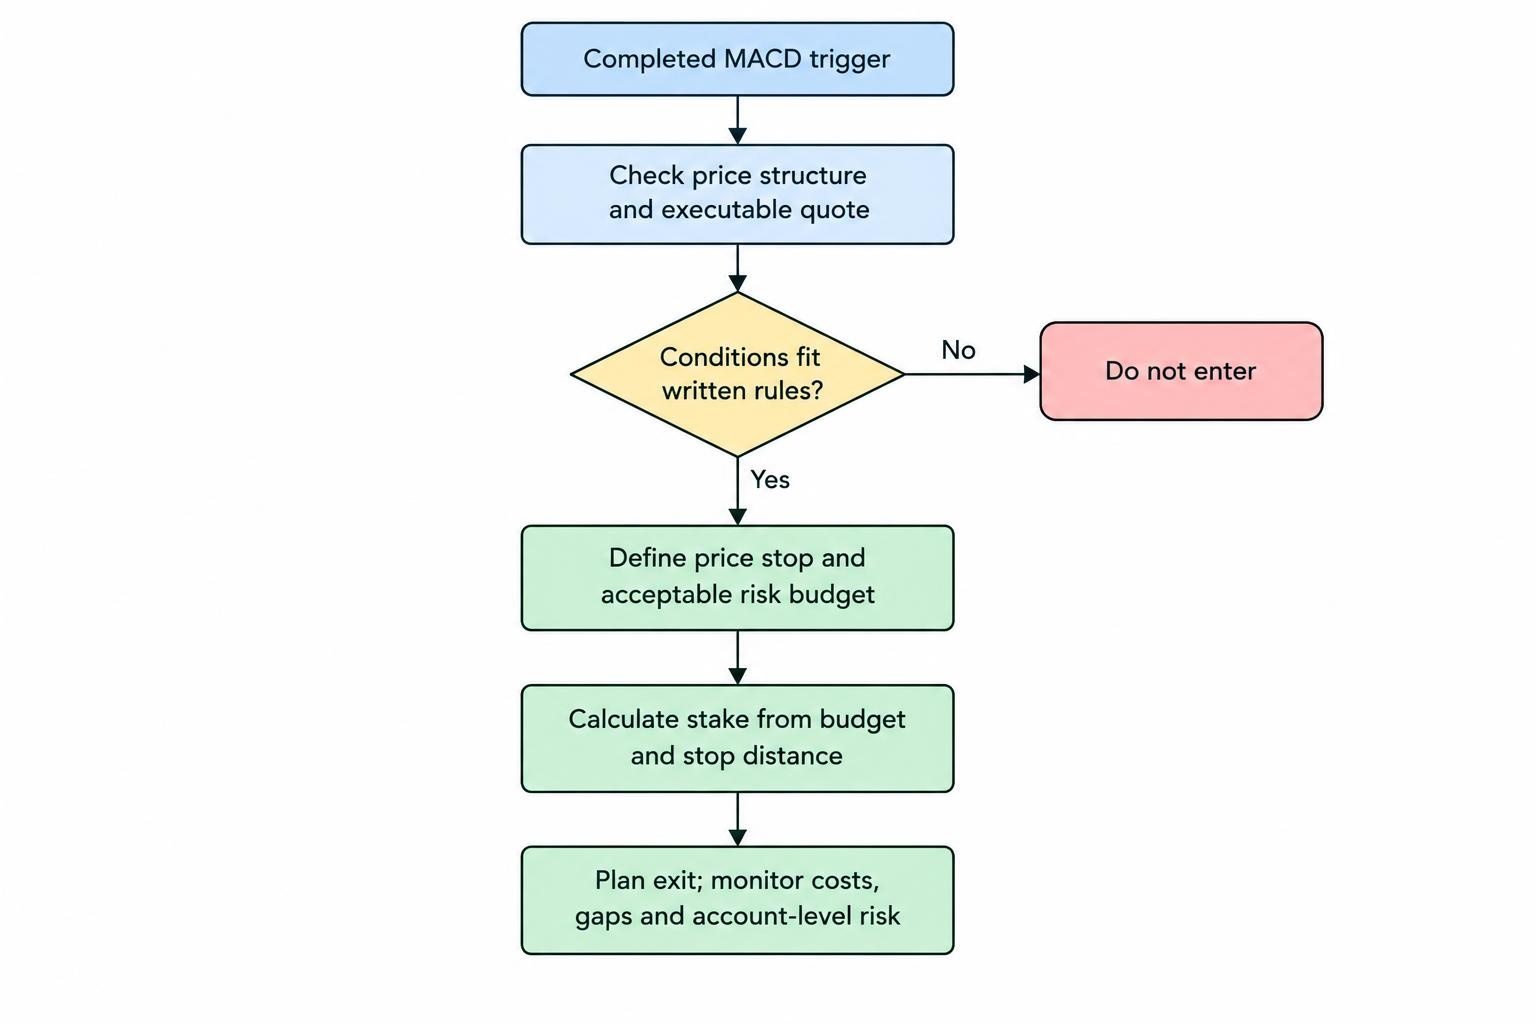
The price stop should relate to the reason for entering, such as the failure of the support area used in the long example. Moving it closer solely to increase the stake can place it inside ordinary price fluctuations; moving it further away after entry increases the potential loss unless exposure is reduced. Position sizing connects these decisions with the trading budget, while ATR can help describe recent price movement when assessing stop distances. Also consider positions together. Several MACD signals in related equity indices or currency pairs can expose the account to the same underlying event. Separate tickets do not necessarily represent separate sources of risk or independent trading opportunities.
Margin, leverage and account-level risk
The index position represents approximately £5,201 of exposure: 10,402 multiplied by £0.50 per point. At an assumed 5% margin requirement, its opening margin is £260.05. That deposit differs from both the planned £25 price loss and the total exposure. The FCA’s retail CFD rules set a 5% minimum initial margin for major stock indices; other categories have different requirements, and providers can require more. Use the actual contract terms when calculating the funds needed. Having enough money to meet opening margin does not establish that the stop distance is affordable or that the account can tolerate several related positions moving against it at once.
The same FCA rules require account-level closeout when net equity falls below 50% of required margin, as soon as market conditions allow, and provide negative balance protection for covered retail accounts. The latter limits liability to funds in the relevant account; it does not guarantee an individual stop price or prevent deposited funds being lost. Account closeout can occur before the planned MACD exit. A trader who watches only the chart can therefore miss the condition that forces a position to close. Assess available funds, unrealised losses and total margin usage alongside the individual setup, especially when positions remain open through announcements or outside the underlying market’s main session.
Trading costs and the effect of delayed signals
MACD uses smoothed historical prices, so a signal normally appears after some price movement has already occurred. That delay is part of its construction, but it can reduce the remaining potential reward when entry follows a large move. Dealing spreads, slippage and funding then reduce the result further. The FCA’s review of CFD providers’ price and value examines costs including overnight funding and their relationship to underlying exposure. Compare the costs of the actual product over the expected holding period. A small opening spread may not compensate for expensive financing over a longer trade, while repeated short-lived crossovers can make transaction costs dominate a strategy with a modest average price gain.
Consider hypothetical results with a 40% win rate, an average £60 price profit on winners and an average £25 price loss on losers. Before separate costs, the average result is 0.40 × £60 minus 0.60 × £25, or £9 per trade. Average additional costs of £3 reduce that to £6. If delayed entries or early exits reduce the average winner to £40 while losses remain unchanged, the result becomes £16 minus £15 minus £3, or a £2 average loss. The frequency of apparently correct MACD signals is therefore insufficient. Evaluate the actual size of gains and losses, all relevant costs and the drawdowns required to achieve the average result.
Who does MACD trading suit?
MACD may suit traders who want a measurable trend or momentum condition within a written process and are prepared to evaluate that condition critically. It can support intraday or multi-day methods, but the timeframe must fit the trader’s availability. An hourly method that requires action at each candle close cannot be followed reliably by someone who checks prices only occasionally. A daily method reduces the number of scheduled decisions but can involve longer exposure to financing and gaps. The distinction between day trading and swing trading therefore concerns more than changing a chart interval. Each approach needs its own assumptions about monitoring, order handling, holding periods and the events that can invalidate a setup.
The formula can be applied to indices, shares, forex and commodities, but each market has different price drivers and trading conditions. Company announcements can abruptly change a share’s price, monetary policy can move currencies and supply developments can move commodities. MACD describes the price response after it enters the data; it does not forecast the announcement itself. Traders using it should therefore maintain an event calendar and understand the underlying contract. It is less suitable as a standalone tool for people seeking precise tops and bottoms, guaranteed entry timing or a substitute for risk planning. Someone unable to tolerate losing deposited trading funds should not assume that choosing slower settings makes financial spread betting appropriate.
Advantages and disadvantages of MACD
MACD’s practical strength is that it converts the relationship between moving averages into clearly defined conditions. Crossovers and line positions can be recorded, checked and applied consistently, reducing dependence on an impression that a chart “looks strong.” The histogram makes changes in the line relationship easier to inspect, and the indicator can serve as an entry filter or exit condition within a wider plan. Its limitations are equally relevant: smoothing creates delay, ranging markets can produce repeated false starts, and divergence can persist without a reversal. More complicated combinations of settings do not remove these problems. The indicator’s value depends on whether its chosen role improves the complete strategy after realistic costs and losses.
| Advantage | Limitation to assess |
|---|---|
| Clear mathematical rules | An objective rule can still produce consistently poor trades |
| Useful view of moving-average relationships | Describes past prices rather than future events |
| Can support trend and momentum methods | Repeated crossovers can occur in ranges |
| Histogram makes line separation visible | Histogram zero crossings duplicate signal-line crossovers |
| Can be tested across settings and markets | Excessive parameter selection can overfit historical data |
Combining MACD with other analysis
Give each additional tool a separate purpose. Support and resistance can define the area where a trade becomes interesting or invalid, while fundamental analysis can identify the events and economic assumptions affecting the market. Moving averages may help describe the price trend, but remember that MACD already uses them. Requiring a 12-period EMA to cross above a 26-period EMA and MACD to cross above zero duplicates the same condition when the source and settings match. Adding RSI introduces a different calculation, but it still uses price data. Agreement between several price indicators should not be treated as several independent proofs that a trade is likely to succeed.
How to get started with a MACD spread betting method
Start with one market, one timeframe and one defined role for MACD. An educational exercise might examine bullish signal crossovers following pullbacks within an independently specified upward price trend. Write down the price condition, the completed-bar trigger, the maximum acceptable entry price, the stop, the exit rule and the stake calculation before reviewing outcomes. Include the events that make a trade ineligible, such as a scheduled announcement or a spread above a stated threshold. Before funding any live account, follow the FCA’s guidance on checking authorisation and relevant permissions. Provider checks address whom you are dealing with; they do not validate the method or protect a position from market losses.
Review historical signals in sequence, including losses and periods when no qualifying opportunity appeared. Then practise the same rules in a demonstration account, recording the quote available after each signal rather than assuming entry at the candle’s closing price. Demo trading can help with order entry and consistency, but it cannot fully reproduce live execution or the pressure of losing money. Keep a journal containing the signal time, completed indicator values, price context, stake, entry, exit, charges and any departure from the rules. This record should reveal whether a loss came from the method, execution assumptions or a decision to override the plan. Screenshots of successful crossovers alone cannot answer those questions.
Backtesting MACD without relying on hindsight
Trying many combinations of periods, thresholds, filters and exits creates more opportunities to find an impressive historical result by chance. The research paper The Probability of Backtest Overfitting examines this problem in investment strategy selection. Keep a record of variations tested, evaluate the method on data not used to select its rules and check how it behaves under different market conditions. Repeatedly consulting the evaluation period while adjusting the strategy weakens that separation. A method whose results depend on one exact setting deserves closer scrutiny than one behaving reasonably across nearby settings. Even a careful historical test cannot establish that future price behaviour, financing costs or execution conditions will remain favourable.
Backtests must also respect when information and dealing prices became available. A completed-bar crossover cannot justify an earlier entry within that same bar. If a candle touches both the stop and target, its high and low alone may not reveal which came first; use appropriate intrabar data or a stated conservative assumption. Include bid–ask differences, funding, slippage, session restrictions and any delay in confirming swing points. Check average net results alongside losing sequences, maximum drawdown and exposure to correlated trades. The purpose is to assess whether the method remains plausible under realistic conditions, not to reproduce the most attractive line on a historical equity curve. Forward practice can then test whether the written process is actually followed.
Frequently asked questions about MACD spread betting
Is a bullish MACD crossover a buy signal?
It can be a buy condition within a defined strategy, but it is not a complete trading decision. A crossover below zero during a falling market has a different context from a crossover following a pullback within an established upward price trend. The same signal can also appear too close to resistance or after a move that leaves an unattractive stop distance. Specify which circumstances qualify, which executable quote permits entry and how the trade will be closed if it fails. Without those details, describing a crossover as a buy signal leaves the position size, potential loss and exit timing unresolved. The indicator does not supply those decisions on the trader’s behalf.
What are the best MACD settings for spread betting?
There are no universally best MACD settings for financial spread betting. The conventional 12, 26 and 9 combination provides a familiar starting point, but its usefulness depends on the market, chart timeframe, price conditions, entry and exit rules, and costs. Faster settings may react earlier while creating more changes of direction; slower settings may reduce some fluctuations while delaying action. Assess complete trading rules under consistent assumptions rather than choosing whichever indicator curve appears smoothest. If an adjustment only improves a small selected historical sample, there is little basis for expecting the improvement to persist. Record the moving-average types and source data as well as the three numbers before comparing results.
Can MACD be the only exit rule?
A MACD condition can define a planned exit, but it cannot define a maximum financial loss on its own. An opposing crossover might arrive after a small adverse move in one trade and a much larger move in another. A rule based on completed candles may also leave the position open while losses grow during the current candle. Use a separate position and account risk plan, including how ordinary stops, possible gaps and margin closeout affect the trade. When comparing MACD exits with targets, price-based exits or time limits, measure the actual executable results after costs. The useful choice is the rule that fits a tested method and an acceptable risk budget, not the one that most neatly explains past turning points.