Fundamental analysis for financial spread betting examines the economic, financial and business conditions that can influence a market’s price. For currencies, that might mean comparing inflation and interest-rate expectations across two economies. For shares, it can involve company earnings, cash generation and valuation. For commodities, supply, demand and inventories often matter. The aim is to develop a reasoned view about what may change and how the market could respond. However, a sound economic observation is not automatically a profitable spread bet. The current price, market expectations, entry timing, holding costs and risk of being wrong all affect whether the analysis can support a practical trading decision.
This guide explains how to use fundamental analysis across financial spread betting markets, who the approach may suit, and how to turn research into a defined trading plan. It also includes hypothetical long and short examples with realistic dealing-price calculations. The Financial Conduct Authority includes spread betting within its CFD product supervision and describes these leveraged products as high risk and unsuitable for some retail consumers. Research does not remove that risk or guarantee a price response. All prices, forecasts, rates and charges used below are educational assumptions rather than current market data or recommendations. Actual contract terms and personal circumstances must be considered before any real position is opened.
What Is Fundamental Analysis?
Fundamental analysis studies the factors that may explain an asset’s value, its expected returns or the balance between buyers and sellers. In company analysis, those factors include sales, profit margins, cash flow, debt and competitive position. In macroeconomic analysis, they include growth, inflation, employment, monetary policy and financial conditions. Different markets respond to different combinations of information, so there is no universal list of indicators that produces a reliable buy or sell signal. The task is to identify the few drivers most relevant to the chosen instrument, assess what is already reflected in its price, and explain what new development could cause that price to change.
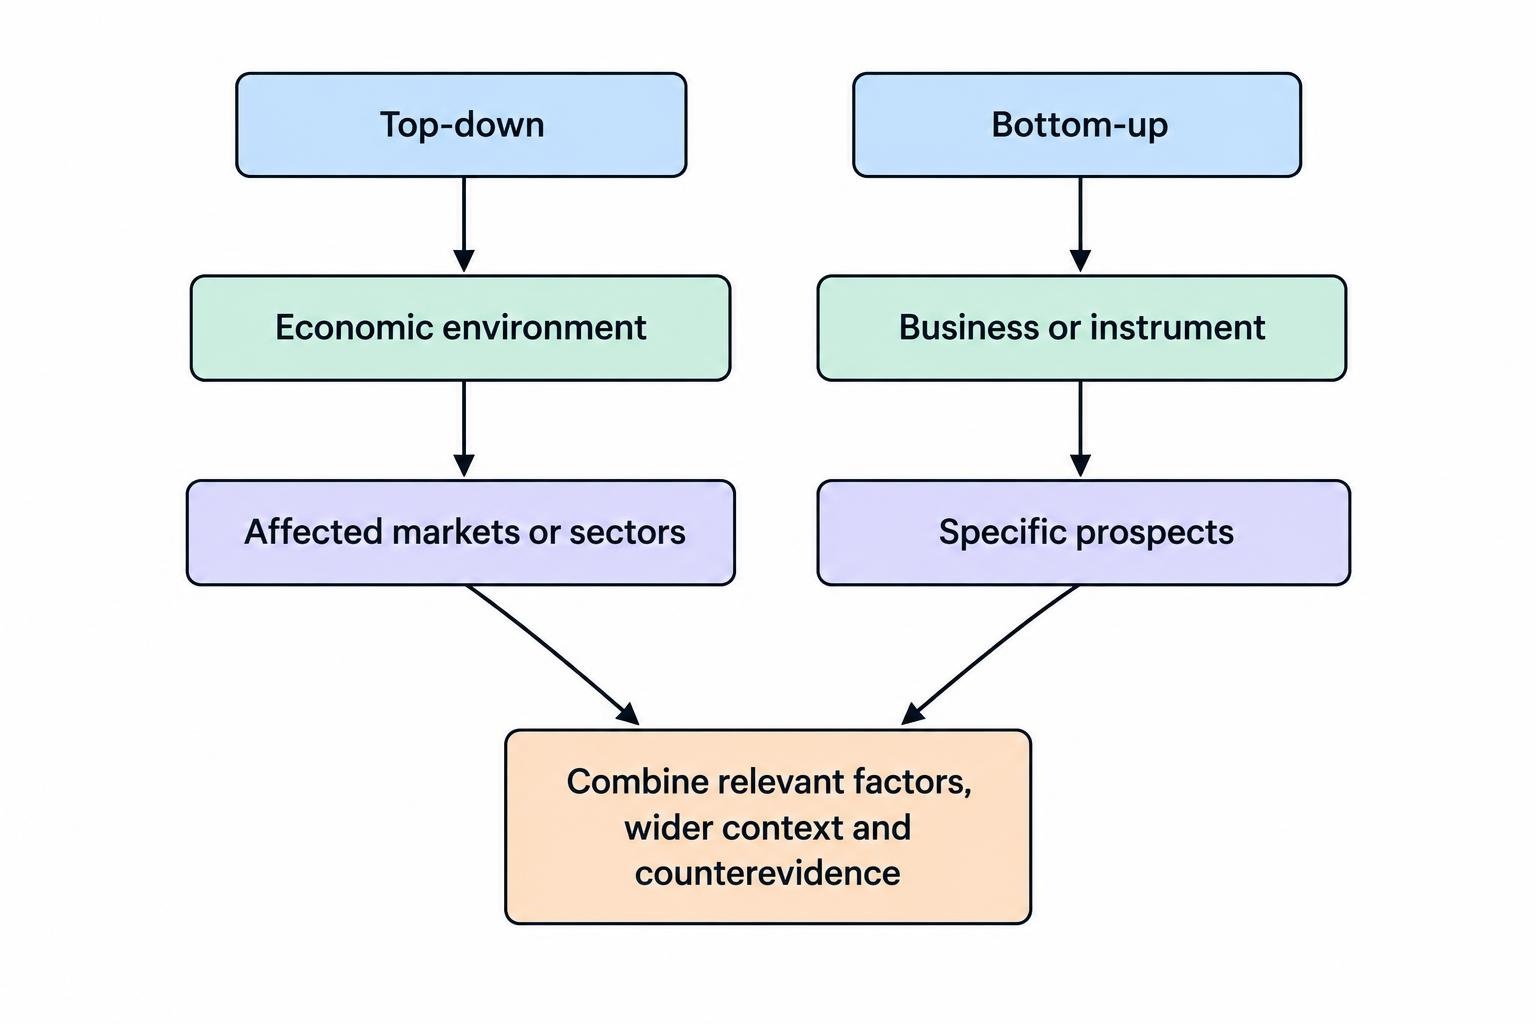
Two common starting points are top-down and bottom-up analysis. A top-down approach begins with the economic environment, then considers which markets or sectors may be affected. A bottom-up approach begins with a particular business or instrument and assesses its specific prospects before placing them in a wider context. Both can contribute to the same decision. For example, improving company margins may support a positive share view, while tighter financing conditions may limit the valuation investors are willing to pay. The useful outcome is not a collection of favourable facts. It is a coherent explanation of how the important factors interact, including the evidence that could contradict the proposed trade.
Fundamental Analysis Is a Method, Not a Complete Strategy
Fundamental analysis can help answer why a market might move, but it does not by itself specify where to enter, what stake to use or when to leave. A complete spread betting strategy needs those decisions as well as an analytical view. Someone might believe a company is undervalued over three years, yet find that a leveraged position held for that period is unsuitable because of financing costs and interim losses. Another trader may focus on how the next results announcement could change earnings expectations over several weeks. The underlying research can be similar, but the trading horizon and product economics are different. Match the analysis to an executable plan rather than assume that a persuasive investment thesis settles every trading question.
Fundamental Analysis Compared With Technical Analysis
Technical analysis studies market behaviour through prices, trends and related measures, while fundamental analysis examines the conditions that may drive that behaviour. The approaches can complement each other. A trader might use company research to identify a potential opportunity and a price-based rule to define entry or invalidation. However, a chart pattern does not prove that an earnings forecast is correct, and a favourable economic forecast does not make every entry price attractive. Decide which method supplies the reason for the trade and which supplies its execution rules. Combining several indicators with a large amount of research does not necessarily improve a decision if their roles remain unclear or contradictory.
| Question | Fundamental analysis contribution | Technical analysis contribution |
|---|---|---|
| Why might the market move? | Economic drivers, earnings, valuation or supply changes | Observed trends and patterns in market behaviour |
| What may change expectations? | Data releases, company updates and policy decisions | Breaks, reversals or changes in momentum |
| Where might a trade be entered? | A price offering a favourable scenario comparison | A predefined price or chart condition |
| What could invalidate the trade? | Evidence contradicting the thesis | A predefined adverse price development |
| How much should be risked? | Informs the scenarios being considered | Can inform stop placement; neither method replaces position sizing |
Who Might Fundamental Analysis Suit?
Fundamental analysis may suit a trader who enjoys understanding businesses or economies, comparing evidence and working with scenarios rather than relying only on short-term price patterns. It can fit swing trading or position trading when the expected development needs time to unfold, although it can also inform shorter event-driven trades. The person needs patience to read original material and discipline to separate observations from assumptions. A company report may contain a verified revenue figure, a management forecast and an analyst interpretation, each with a different level of certainty. Treating all three as established facts makes the resulting trade less reliable, even when the overall story appears convincing.
The approach is less suitable when the trader wants simple instructions from each headline or lacks time to follow developments affecting an open position. It can also encourage excessive confidence: detailed research may make a view feel more certain than the evidence justifies. Someone who cannot accept a price-based loss because they remain convinced about long-term value can turn analysis into a reason to hold an unaffordable position. Beginners can start with a narrow market and a few identifiable drivers, but they should learn spread betting mechanics separately. Understanding inflation or a company’s earnings does not automatically provide an understanding of margin, stop execution, financing or the practical consequences of holding a leveraged contract overnight.
Advantages and Limitations of Fundamental Analysis
The main advantage is that the trading idea has an explicit economic explanation. This can help the trader identify relevant events, distinguish meaningful developments from noise and recognise when the original thesis no longer applies. It also provides a framework for comparing scenarios rather than relying on one expected outcome. For example, a share may offer limited upside if earnings improve only slightly, but substantial downside if refinancing becomes difficult. That comparison can justify rejecting a trade even where the company looks attractive at first glance. Fundamental analysis is useful when it improves the quality of the decision, including the decision to remain out of the market, rather than simply adding reasons to support an existing preference.
| Potential advantage | Important limitation |
|---|---|
| Explains the economic reason for a view | Correct reasoning can still produce poor timing |
| Identifies events that could change expectations | Information may already be reflected in the price |
| Supports valuation and scenario comparisons | Forecasts and valuation assumptions can be wrong |
| Helps assess company or market-specific risks | Unexpected events can overwhelm the original analysis |
| Can support trades lasting beyond one session | Funding and adverse moves can make waiting expensive |
| Provides clear evidence to monitor | Traders may selectively interpret evidence to defend a position |
The limitations arise partly because markets look forward. A company can report rising profits and still disappoint if investors expected more. An economy can weaken while its currency rises if the other economy in the pair weakens faster or policy expectations change in its favour. Prices also reflect positioning, liquidity and uncertainty, which are difficult to infer precisely from published data. Fundamental analysis therefore produces conditional judgments rather than mechanical predictions. Its value improves when those conditions are stated explicitly: what must happen, how the market might interpret it, what evidence would undermine the view and how long the trader is prepared to wait. Without those limits, almost any price movement can be explained after the event.
Expectations Matter More Than Whether News Looks Good or Bad
A useful distinction is between a number improving and a number exceeding expectations. Suppose annual inflation falls from 3.6% to 3.2%, while a pre-release forecast expected 3.0%. Inflation has declined, but the result is 0.2 percentage points above that forecast. If it changes expectations about future monetary policy, the market response could differ from the simple conclusion that lower inflation should have one predictable effect. The forecast itself also needs a source and timestamp. A published economist survey is not a complete measure of everything investors anticipate, and different surveys may disagree. Treat the comparison as one piece of evidence, rather than assume that one consensus figure fully describes what was already priced in.
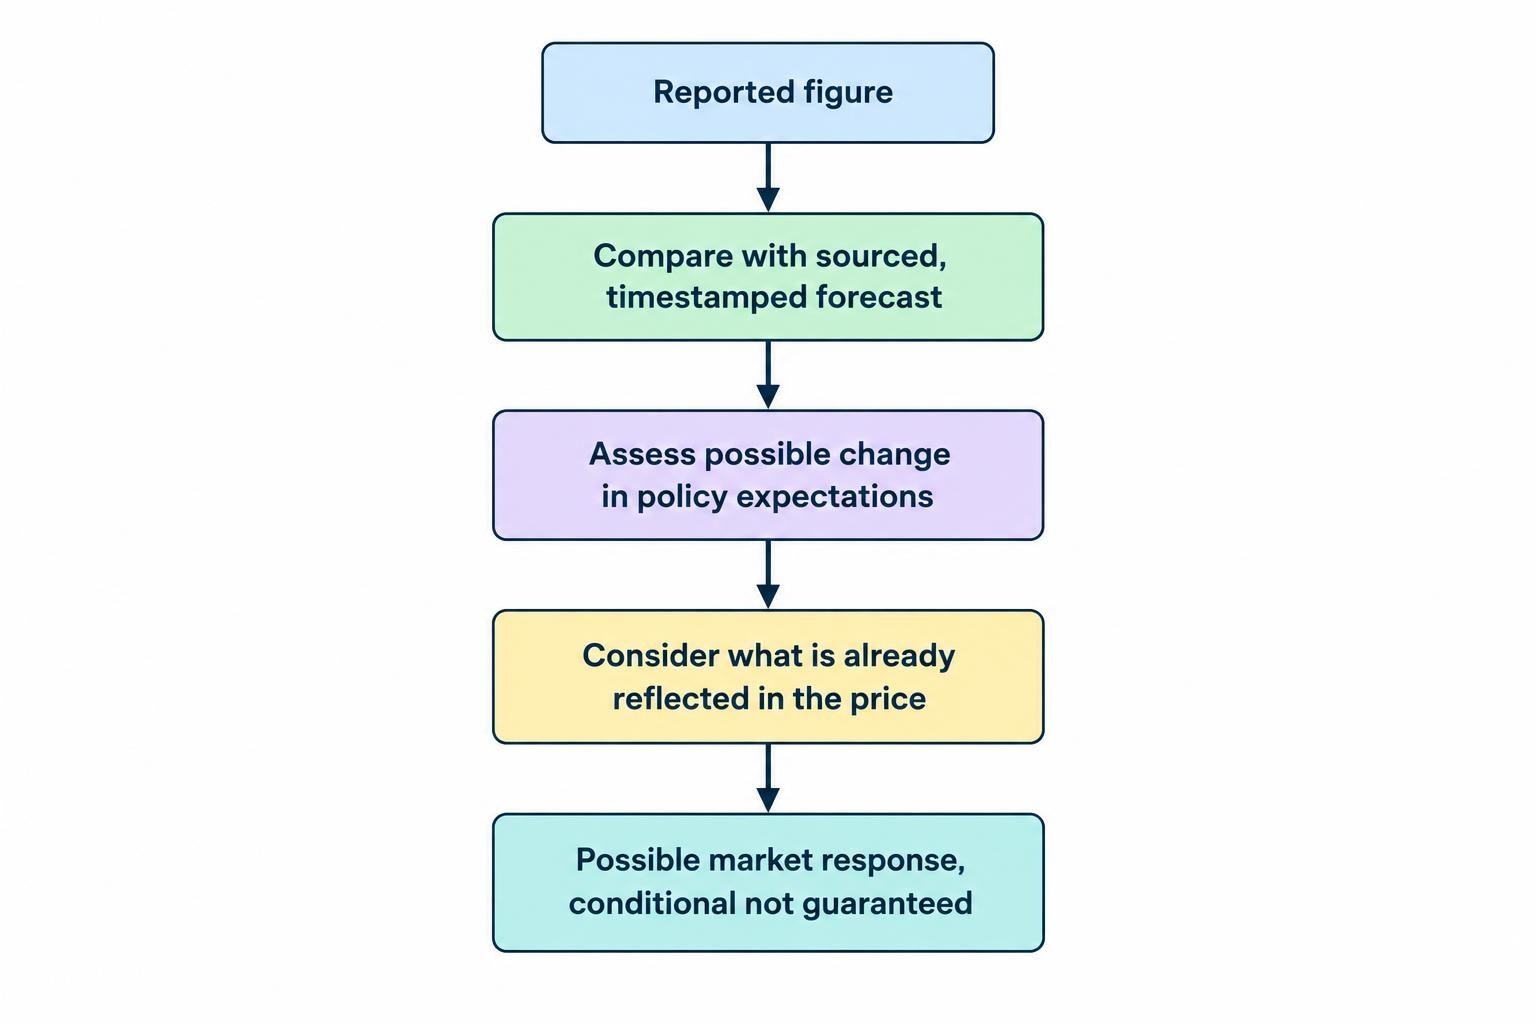
The details of a release can matter more than its headline. Employment growth might exceed expectations while earlier months are revised down. Company earnings might beat a forecast because of a one-off item while guidance for the next period deteriorates. Falling annual inflation can partly reflect the comparison with unusually high prices a year earlier, even if recent monthly pressures remain firm. Read the components, revisions and definitions before drawing a conclusion. Distinguish nominal growth from growth adjusted for inflation, and annual rates from monthly changes. These distinctions are particularly important when a trade depends on a small surprise. A quick headline interpretation can be directionally plausible while missing the information that actually changes market expectations.
Fundamental Analysis Across Spread Betting Markets
The relevant research depends on the instrument being traded. A currency pair is a relative price between two monetary systems; an equity index represents a particular basket of businesses; and a commodity contract can be sensitive to conditions in a specific delivery period. A bond-price contract behaves differently from a quoted interest rate. Begin by understanding what the spread bet references before selecting indicators. Otherwise, a trader can build a reasonable view about the wrong exposure. A positive outlook for a domestic economy, for example, does not necessarily imply a matching response from an index whose largest companies earn substantial revenue overseas or whose sector weights differ from the economy as a whole.
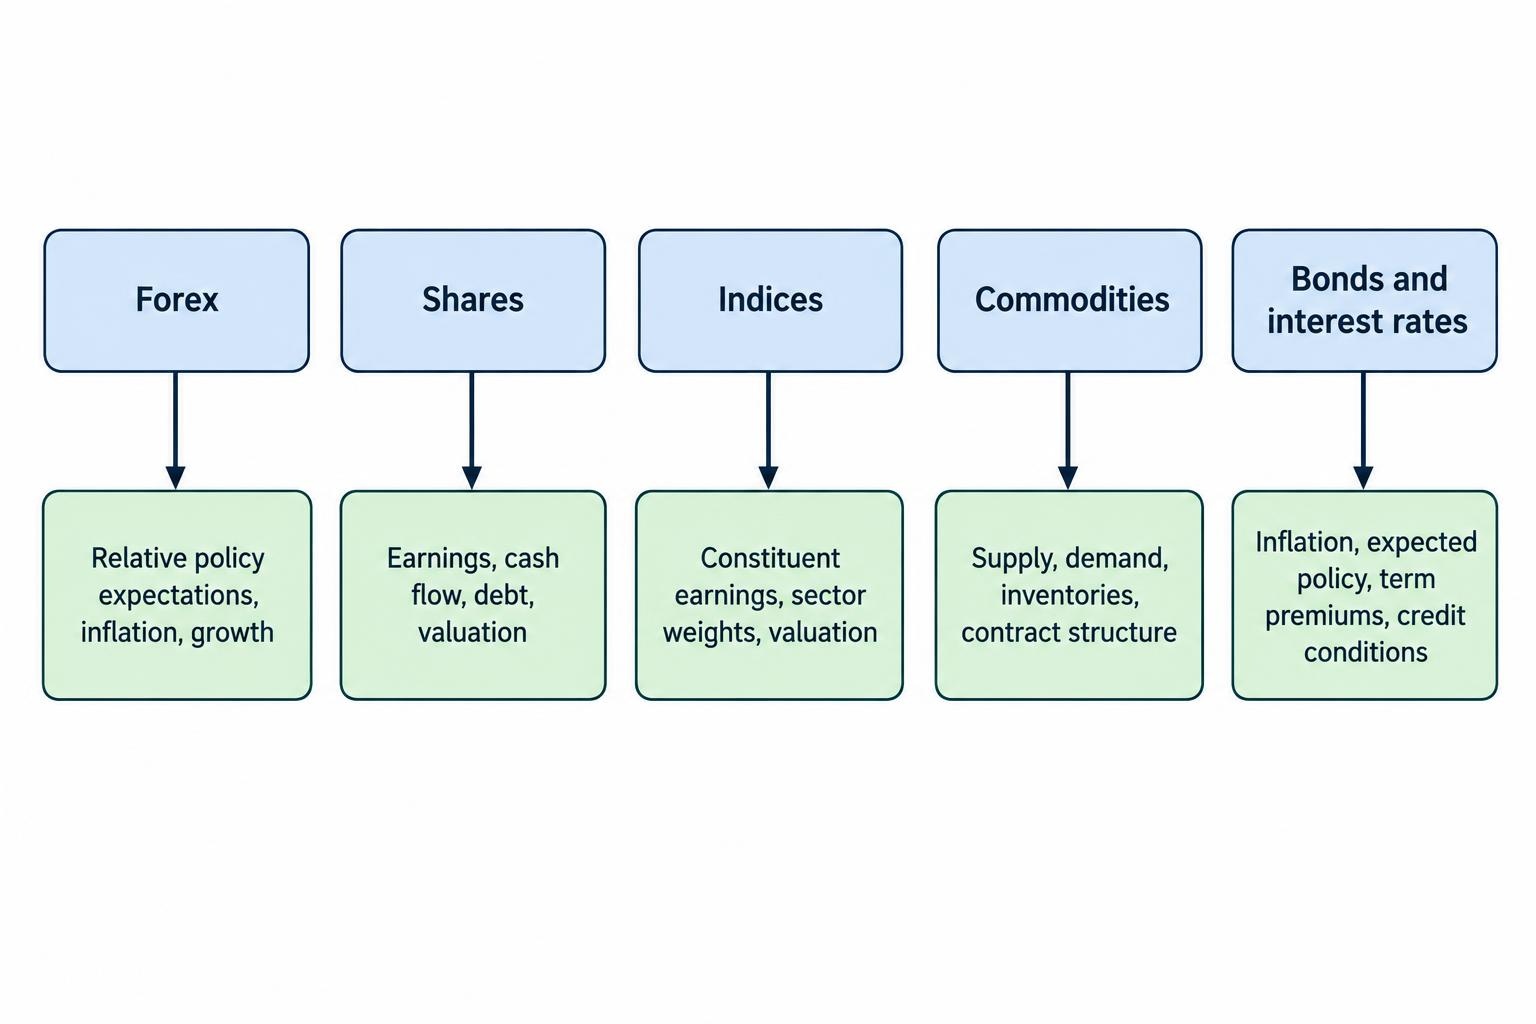
| Market | Fundamental factors to investigate | Common analytical mistake |
|---|---|---|
| Forex | Relative policy expectations, inflation, growth and external financing | Analysing only one currency or treating high rates as automatically positive |
| Shares | Earnings, cash flow, debt, competition and valuation | Confusing a good business with an attractive entry price |
| Indices | Constituent earnings, sector weights, financing conditions and valuation | Treating an index as a direct measure of its domestic economy |
| Oil and gas | Supply, demand, inventories, weather and contract structure | Reading one inventory figure without its context |
| Gold | Real yields, currency conditions, demand and risk appetite | Assuming inflation always produces an immediate gold rally |
| Bonds and interest rates | Inflation, expected policy, term premiums and credit conditions | Confusing a rise in yields with a rise in bond prices |
Forex: Compare Both Sides of the Currency Pair
Forex fundamental analysis is inherently relative. A positive view on sterling is incomplete without considering the currency against which it is traded. For GBP/USD, compare how UK and US conditions may change the expected paths of their respective interest rates, growth and inflation. A higher current interest rate does not guarantee appreciation: it may already be expected, reflect elevated risk or be followed by anticipated cuts. The Bank of England’s monetary policy publications and the Federal Reserve’s FOMC calendar and policy documents provide primary material for examining decisions and their explanations. Read the reasoning and outlook alongside the rate announcement rather than treating the latest decision as a standalone trading signal.
Currency moves can also reflect risk appetite, capital flows and confidence in a country’s external financing. A change in inflation may matter through monetary policy expectations, while a fiscal announcement may affect perceptions of borrowing needs or credibility. These channels can reinforce or offset each other. Write the transmission mechanism explicitly: for instance, a particular development might cause investors to expect a smaller policy-rate gap between two economies, which could alter demand for their currencies. That remains a hypothesis requiring validation. A sterling-denominated stake makes the bet’s profit and loss convenient to calculate in pounds, but it does not remove the economic exposure to the currency pair being traded or guarantee that the expected channel dominates.
Shares: Earnings Quality, Cash Flow and Valuation
Company analysis starts with understanding how the business earns money and what could change its future cash generation. Review revenue growth, operating margins, recurring versus exceptional earnings, debt and upcoming financing needs. The SEC’s guide to financial statements explains the roles of the balance sheet, income statement and cash flow statement, and why their accompanying notes matter. For US filings, the SEC’s EDGAR database provides an official source. Company investor relations pages supply reports and announcements for the relevant issuer. A management presentation is useful for understanding management’s argument, but the financial statements and their qualifications should be examined before accepting that argument as the trading thesis.
Profit growth and cash generation can diverge. Revenue booked before customers pay can improve reported earnings while leaving cash tied up in receivables, and investment spending can absorb operating cash. Borrowing costs, debt maturities and dilution can also change what remains for shareholders. A low price-to-earnings ratio is therefore not sufficient evidence that a share is undervalued. Earnings may be temporarily high, declining or defined using adjustments that deserve scrutiny. Conversely, a strong business can be a poor trade if its price already assumes exceptional performance. The aim is to compare plausible future outcomes with the valuation being paid, while identifying the development that could cause investors to revise their assessment within the intended holding period.
Valuation Is a Range, Not a Guaranteed Target
Suppose a hypothetical share trades at 500p and earns 40p per share annually, giving a price-to-earnings ratio of 12.5. An optimistic scenario might assume earnings rise to 45p and the market assigns a multiple of 14, implying 630p. A pessimistic scenario might use 35p of earnings and a multiple of 11, implying 385p. These calculations illustrate how much a valuation depends on its assumptions; they are not probabilities or price promises. Discounted cash flow models have similar sensitivity to cash forecasts, discount rates and longer-term assumptions. Use a range to identify what the current price appears to require, then assess whether the evidence supports a materially different outcome rather than presenting one modelled value as certain.
Indices: Analyse the Basket Behind the Headline
An index’s fundamentals reflect its constituents and weighting method. A few large businesses or a concentrated sector exposure can exert a substantial influence, so broad economic growth is only part of the analysis. Examine where the underlying companies earn revenue, which currencies affect their results, and how changes in financing conditions may influence their valuations. Rising interest rates may support some financial businesses while increasing pressure on highly indebted companies or reducing the present value of distant expected profits. These effects do not have to cancel. A trader should also distinguish a cash index from the particular spread betting contract used to express the view, including its pricing basis, dealing hours and dividend adjustments.
Commodities: Supply, Demand and the Contract Being Traded
Commodity analysis begins with physical supply and demand, but the relevant details vary considerably. Oil may respond to production, refinery activity, transport disruptions and inventory changes. Natural gas can be particularly sensitive to regional infrastructure, storage and weather, while industrial metals depend partly on manufacturing and construction demand. The US Energy Information Administration’s Weekly Petroleum Status Report is a primary source for US petroleum data. An inventory decline should be interpreted alongside imports, exports, refinery use and the wider seasonal context. It does not automatically prove that final demand is accelerating. The market may also have anticipated the decline or consider another development more important than the latest reported change.
The contract’s delivery period and pricing structure can matter as much as the broad commodity outlook. A shortage affecting near-term supply may move nearby futures differently from later contracts, while storage and financing conditions can affect the relationship between expiries. A spread bet referencing one part of that market may therefore respond differently from a headline spot price. Gold requires a different framework again: interest rates adjusted for expected inflation, currency conditions and demand for financial protection can matter alongside physical demand. Avoid universal rules such as “inflation means buy gold” or “economic growth means buy oil”. Identify the specific mechanism, the horizon over which it may operate and the contract through which the exposure is being taken.
Bonds and Interest Rates: Check the Direction Carefully
Bond analysis examines expected inflation, future policy rates, credit conditions and the compensation investors demand for holding longer maturities. For a conventional fixed-rate bond, price and yield move in opposite directions, a relationship explained in the SEC’s Investor.gov bond guidance. A view that yields will rise therefore does not translate into buying a bond-price contract. Some interest-rate contracts use other quotation conventions, making their specifications essential. Duration also affects how sensitive a bond is to a yield change, so two maturities need not move by the same amount. The macroeconomic view must be translated into the correct contract direction and point scale before any risk calculation is meaningful.
Using Reliable Sources and an Economic Calendar
Use original releases to establish what was reported and when. The Office for National Statistics release calendar identifies scheduled UK publications, while the US Bureau of Labor Statistics CPI schedule provides dates for US consumer-price releases. Central bank publications and company announcements complete the relevant calendar for many strategies. Record the release time in the correct time zone and check for changes around holidays or daylight saving. A third-party calendar can help organise information, but its forecast, previous reading and revised reading should not be confused with one another. Where a decision depends on the data, verify the original release and its definitions rather than relying entirely on an abbreviated headline.
Source quality does not make interpretation automatic. Official statistics can be revised, management forecasts can prove wrong, and a credible analyst can disagree with another using different assumptions. Keep a short research record that distinguishes observed facts, external forecasts and your own conclusions. Include publication dates so an older estimate is not mistaken for a current one. When using search tools or automated summaries, follow important figures back to their source and check units and periods. A quarterly revenue number, an annualised growth rate and a year-on-year percentage change describe different things. Errors at that stage can make a sophisticated-looking trading thesis rest on a comparison that was never valid.
Turning Fundamental Research Into a Trading Plan
A practical thesis should identify the driver, the expectation it may change, the possible catalyst and the time available for that change to matter. For a share, the driver might be improving cash generation; the expectation might be that recent margin pressure will persist; and the catalyst might be the next trading update. The thesis should also name the evidence that would weaken it, such as deteriorating orders or a need for additional capital. Avoid vague statements such as “this company should recover”. A more useful plan explains what recovery means, why the current price may understate it and what would cause the trader to stop waiting for that outcome.
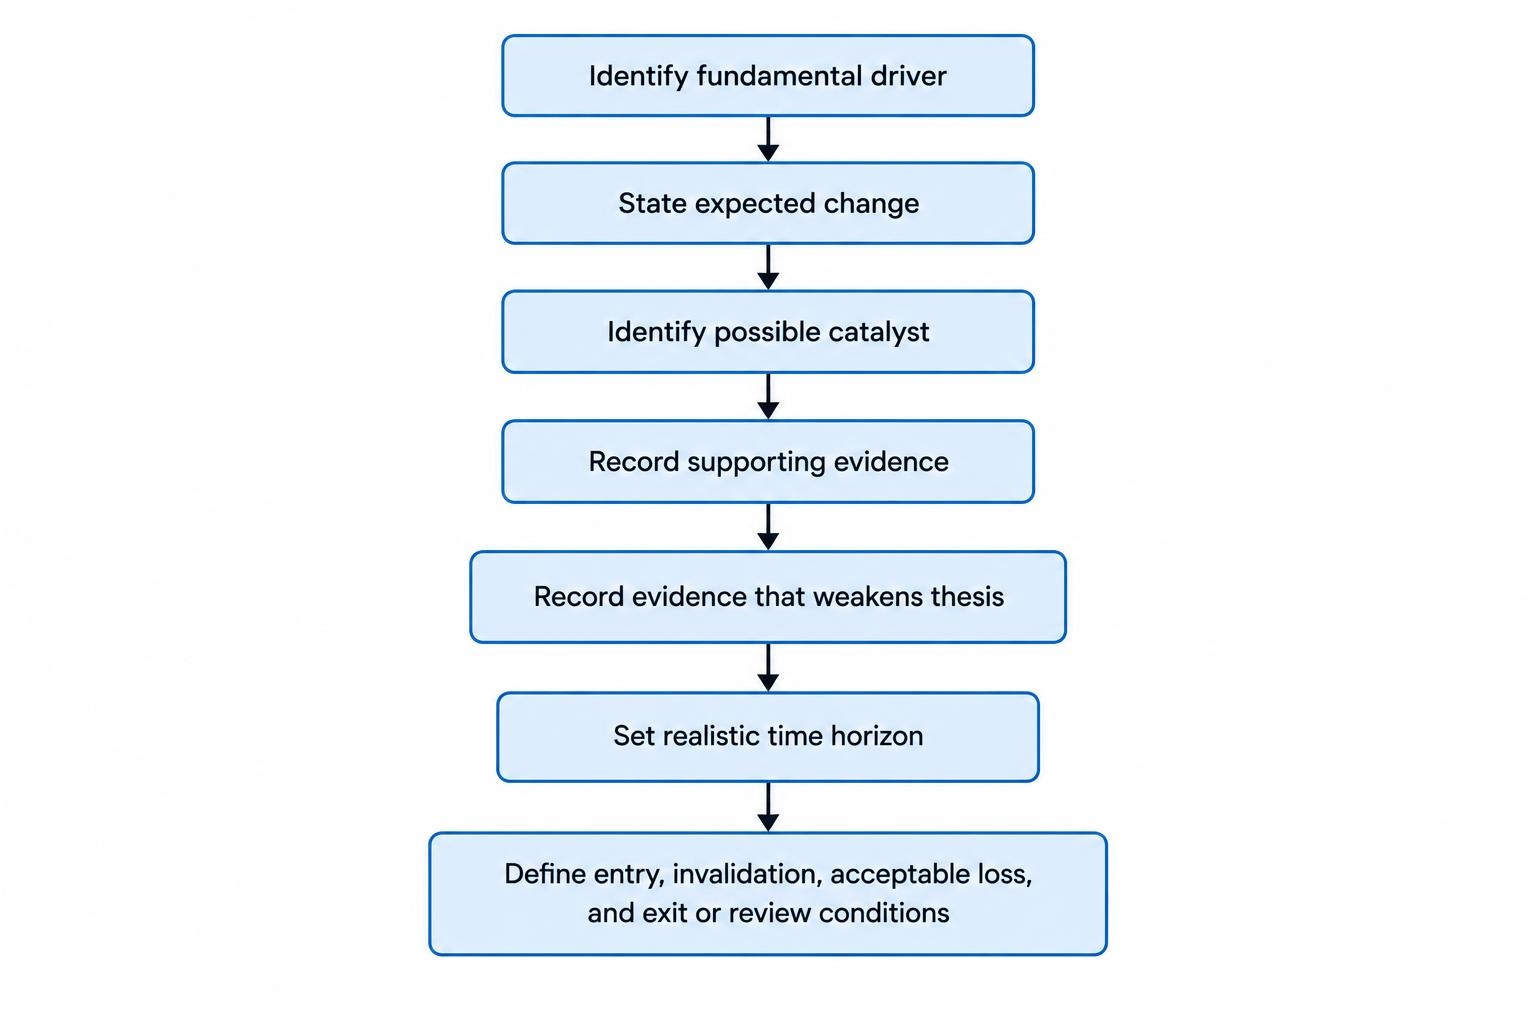
Separate fundamental invalidation from the maximum financial loss acceptable on the trade. A business thesis might remain plausible even after a substantial price decline, but a leveraged account may be unable or unwilling to absorb that decline. A price-based stop can therefore end the position before the broader research view is disproved. That is a risk decision rather than a contradiction. Specify both limits before entry, together with a time-based review or exit. If the catalyst passes without the expected response, assess whether the trade still offers a reasonable opportunity after costs. Extending the holding period repeatedly should require fresh evidence and a new risk assessment, rather than a desire to avoid admitting that the original timing was wrong.
Practical Example: A Long Share Spread Bet Based on Improving Fundamentals
Assume a trader has reviewed a hypothetical company’s results and believes improving cash generation and margins are not fully reflected in its share price. The planned catalyst is an update over the next two weeks. The spread bet is quoted at 500p/502p, and the trader buys at 502p for £0.50 per penny. An ordinary stop is set at a sell price of 462p, giving £20 of intended price risk. The planned exit target is a sell price of 602p, offering £50 of price profit. Assume £4 of total funding over the illustrated holding period, no dividend adjustment and no guaranteed-stop premium. The table shows alternative outcomes under those assumptions.
| Alternative outcome | Closing sell price | Price profit or loss | Funding cost | Net result |
|---|---|---|---|---|
| Expected repricing reaches the target | 602p | +£50 | £4 | +£46 |
| Fundamentals improve but the price response is small | 512p | +£5 | £4 | +£1 |
| Trade closes at the original opening buy price | 502p | £0 | £4 | −£4 |
| Ordinary stop fills at its requested level | 462p | −£20 | £4 | −£24 |
| Adverse news causes a gap; stop fills at 432p | 432p | −£35 | £4 | −£39 |
The target is a planned exit, not a guaranteed fair value. A company can deliver better results without the share reaching that level, and the second row shows how a correct general view can produce only a small net gain. The gap scenario demonstrates that an ordinary stop does not guarantee the planned £20 price loss. Spreads are already reflected in the opening buy and closing sell prices, so they should not be deducted again. With the assumed £4 funding charge, the closing sell price needed for overall break-even is 510p. Earlier or later exits would normally change the funding amount; equal costs here isolate the effect of different closing prices.
Practical Example: A Short Forex Trade Based on Relative Policy Expectations
Suppose a trader expects incoming information to support a firmer US policy outlook relative to the euro area, creating a reason for EUR/USD to weaken. This is a hypothetical relative-policy thesis, not a claim that one particular rate decision guarantees a currency move. After checking the event calendar and current spread, the trader sells EUR/USD at 1.1000 from a quote of 1.1000/1.1002 for £0.50 per 0.0001 pip. An ordinary stop at a buy price of 1.1060 gives 60 pips, or £30, of intended price risk. If the trader later buys back at 1.0880, the 120-pip favourable move produces £60 before an assumed £3 net funding debit, leaving £57.
The alternative scenarios matter just as much. If the expected policy difference narrows instead and the trader exits early at a buy price of 1.1020, the price loss is £10; with an assumed £1 funding charge for that shorter holding period, the net loss is £11. If unexpected news instead causes a gap and the ordinary stop executes at 1.1100, the price loss is £50, or £53 after the assumed £3 funding charge. These outcomes show why conviction about the economic argument cannot replace a loss plan. The trade depends on how expectations change relative to the entry price, and the available exit can be worse than the level selected in advance.
Position Sizing and Margin for Fundamental Trades
The depth of the research should not determine how much leverage is used. Position sizing should begin with an acceptable risk budget, the intended exit distance and adverse scenarios beyond that distance. In the share example, a 40-point stop distance and a £20 price-risk budget imply a £0.50-per-point stake. Margin is a separate calculation: 502 multiplied by £0.50 gives £251 of exposure, and an assumed 20% opening margin is £50.20. The FCA’s retail rules specify a minimum 20% opening margin for individual shares, while firms can require more. Neither the opening margin nor the stop-based estimate is a complete maximum-loss calculation, particularly where gaps and charges are possible.
Account protection should also be understood separately from the research thesis. Under the FCA’s retail margin closeout and negative balance protection rules, positions must be closed as soon as market conditions allow when account net equity falls below 50% of required margin, and liability for covered investments is limited to funds in the relevant account. These protections do not guarantee a particular exit price or preserve the money deposited. Several positions based on the same economic view can lose together, reducing available equity quickly. A long equity index, a growth-sensitive currency position and a commodity trade may contain overlapping exposure even though they appear to express three different research ideas.
Holding Costs and the Cost of Being Early
A fundamental view can take longer to influence prices than expected. For a daily funded contract, that waiting period can materially change the trade’s economics. The FCA’s review of CFD pricing and value highlights funding costs applied to full underlying exposure and differences between providers’ charges. For a simplified illustration, £10,000 of unchanged exposure charged at an assumed annual rate of 8% on a 365-day basis costs approximately £65.75 over 30 funding days. That is an arithmetic example, not a universal formula or current quote. Estimate costs for both the intended holding period and a delayed outcome, including borrowing charges or dividend adjustments where relevant to the chosen contract.
Longer-horizon research also raises a product-selection question. A dated contract may incorporate financing and other factors into its quoted price, while a daily funded contract may show separate adjustments. The absence of a nightly debit does not establish that the dated alternative is cheaper, and expiry or rollover can introduce further decisions. If the thesis depends on a business developing over several years, a leveraged spread bet may be a poor way to express it even if the research itself is reasonable. Compare the required holding period with financing, volatility and available capital. Being eventually correct offers little practical benefit if the account cannot sustain the path or the costs consume the expected price gain.
Trading Around Announcements
Fundamental analysis does not require opening a position immediately before a major release. A trader can wait for the information, assess whether it changes the thesis and then evaluate the price that is actually available. Holding through an announcement introduces gap and execution risks that should be planned explicitly. The first reaction may also change when investors read the details, hear management commentary or assess a later press conference. A buy or sell order placed in advance can fill at an unattractive level if conditions change sharply. The news trading guide examines these execution issues in more detail. Choose whether to trade before, after or outside the event window as part of the strategy rather than by habit.
How to Get Started With Fundamental Analysis
Begin with one market and a small number of drivers that can be followed consistently. For a currency pair, that could mean the two central banks, inflation and employment conditions. For a share, it could mean revenue, margins, cash generation and debt. Build a calendar, collect the relevant primary sources and write a short thesis before looking for a trade. Then define entry, invalidation, holding period and costs in a demonstration account. Before opening a real account, follow the FCA’s guidance on checking a firm’s authorisation, including permissions and contact details. Authorisation does not establish that the analysis is correct or that a particular contract is suitable for the intended horizon.
Keep a journal that records what was known before entry, what was expected to change and how the actual outcome differed. Separate research quality from execution quality: a reasonable thesis can lose because of an excessive entry price, while a weak thesis can occasionally profit by chance. Review whether the forecast was directionally correct, whether its timing was useful and whether the net result justified the risk taken. Include decisions not to trade, especially where the catalyst had already moved the price or costs made the opportunity unattractive. This produces a more informative learning record than collecting favourable charts after successful trades and treating every loss as an unforeseeable event.
Testing Fundamental Ideas Without Hindsight
Historical testing of fundamental strategies requires information as it was available at the time. Economic databases may display revised figures, while company estimates and consensus forecasts can change before or after an announcement. Using the final revised number to simulate a decision made on the first release introduces information the trader did not have. A signal based on a published report must also use an entry price available after publication, not an earlier closing price. Include realistic spreads, financing, delays and failed scenarios, then assess later observations without repeatedly rewriting the rules. Where historical forecasts or original data releases are unavailable, acknowledge that limitation rather than presenting an approximate reconstruction as a precise record of achievable performance.
Common Mistakes to Avoid
Common errors include buying because a company is good without considering its price, selling because a headline is negative without comparing expectations, and treating one economic indicator as a complete forecast. Another is increasing a position whenever the market moves against the thesis, without asking whether the evidence or available capital has changed. Long research documents can also hide a simple lack of timing or a missing catalyst. Keep the strongest counterargument visible and review it when new information arrives. The aim is not to defend a prediction at any cost. It is to make decisions whose assumptions, potential gains, losses and time limits remain clear enough to evaluate while the trade is still open.
UK Tax Treatment of Fundamentally Driven Spread Bets
Using fundamental analysis does not by itself determine a spread bet’s tax treatment. HMRC’s general guidance on betting and gambling explains that betting profits are not normally taxable and losses are not normally relieved. Its specific spread betting guidance says that the terms and economic substance matter, including whether the activity arises from carrying on a trade. Personal circumstances, residence and the nature of the activity can therefore be relevant, with separate considerations for companies. Do not treat a researched trading method or an expected tax advantage as proof of profitability. Obtain advice on the actual circumstances where tax treatment is uncertain or important to the decision.
What Makes a Fundamental Trading Plan Useful?
A useful plan explains what may change, why that change is not already fully reflected in the price and how it could matter within a realistic holding period. It then connects that view to a specific contract, an acceptable entry, a manageable stake and clear exit conditions. The strongest analysis remains open to contradictory evidence and allows for outcomes beyond its central forecast. Within a wider spread betting strategy, fundamental analysis provides a structured way to develop and monitor a view. Its practical value depends on whether the resulting trade still makes sense after financing, uncertain execution, adverse price movements and the possibility that the market interprets the same information differently.