Spread bettors lose money when trading losses and costs exceed their gains. That sounds obvious, but it shifts attention away from finding the next winning trade and onto what determines an account’s survival: position size, average losses, dealing costs and whether the strategy has any advantage after those costs.
A correct market forecast can still produce a losing bet. The position may be too large to survive an adverse move, the stop may sit inside normal price fluctuations, or financing may consume the eventual profit. Being right about direction is only part of the job.
The practical question is which part of the trading process is losing money. The broader spread betting risk management guide covers the controls; this article examines the failures those controls are meant to prevent.
What loss rates do, and do not, tell you
On 6 December 2016, the FCA reported that 82% of clients in a representative sample lost money on CFD products, a category that included spread bets and rolling spot foreign exchange. That was historical evidence from a broader product group, not a current percentage for spread betting alone. The distinction matters when interpreting the FCA’s 2016 findings on retail client losses.
The FCA’s retail CFD and spread betting rules require provider loss percentages to be recalculated every three months using the preceding 12 months. The calculation includes realised and unrealised results and all charges, but excludes deposits and withdrawals. It measures losing accounts, not the percentage of individual bets that lose.
Those rules also require positions to be closed as soon as market conditions allow when account equity falls below 50% of the required margin. Negative balance protection caps a retail client’s liability for the covered products at the funds in that account. Neither protection prevents the loss of that trading money.
A provider’s disclosed percentage is therefore a warning about customer outcomes, not your personal probability of success. Nor does a lower percentage prove better execution or cheaper trading. Different customers, markets and trading patterns can produce different results.
The useful response is to examine the mechanics behind losses rather than hunt for a reassuring percentage.
Trading without an advantage after costs
A trading advantage, often called an edge, means a repeatable approach has positive expected results after costs. A convincing explanation for why a market should rise is not enough. The entry price, exit rules, losing trades and charges must all work together.
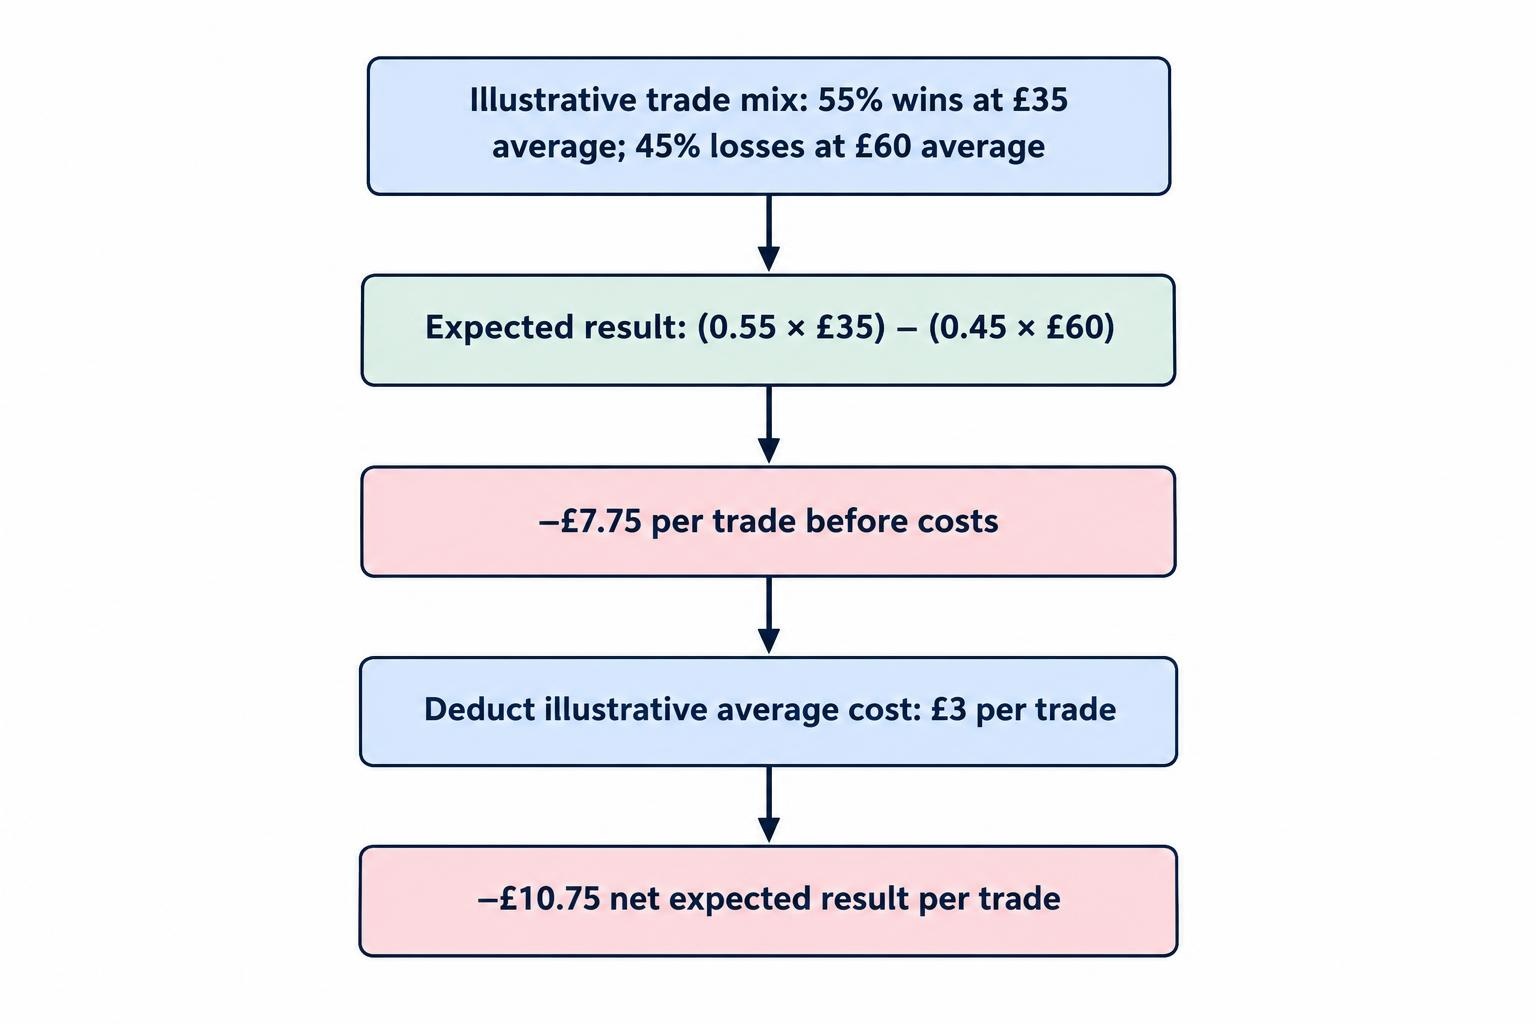
Consider a hypothetical strategy that wins 55% of its trades. Its average winner earns £35 and its average loser costs £60, before dealing costs. Its expected result per trade is:
(0.55 × £35) − (0.45 × £60) = −£7.75 before costs.
If the average trading cost is another £3, the expected result becomes a £10.75 loss per trade. Winning more often than losing does not rescue the arithmetic. All figures in these examples are illustrative, not quoted trading terms.
The reverse is also possible: a strategy can lose on more trades than it wins and still make money if its winners are sufficiently large. This is why the relationship between risk and reward matters more than win rate alone.
Setting a profit target twice as far away as a stop does not establish an advantage, either. The target must be reached often enough, and the actual exits must resemble the plan. A theoretical £200 target contributes nothing if you repeatedly close the trade for £30.
Without evidence of an advantage, better discipline may only make an unprofitable strategy more consistent. Before blaming emotions, check whether the method makes sense after realistic costs and whether the results come from enough trades to be informative.
Taking positions that are too large for the account
Stake per point can make exposure look deceptively modest. A £5 stake sounds small until the market moves 100 points and the account loses £500.
Suppose an index is priced at 8,000 and a trader opens a £5 per point position. The notional exposure is £40,000. A 100 point adverse move represents 1.25% of the index level, but the £500 loss represents 10% of a £5,000 trading account, before other costs.
The market move and the account damage are different percentages. Confusing them is an expensive mistake.
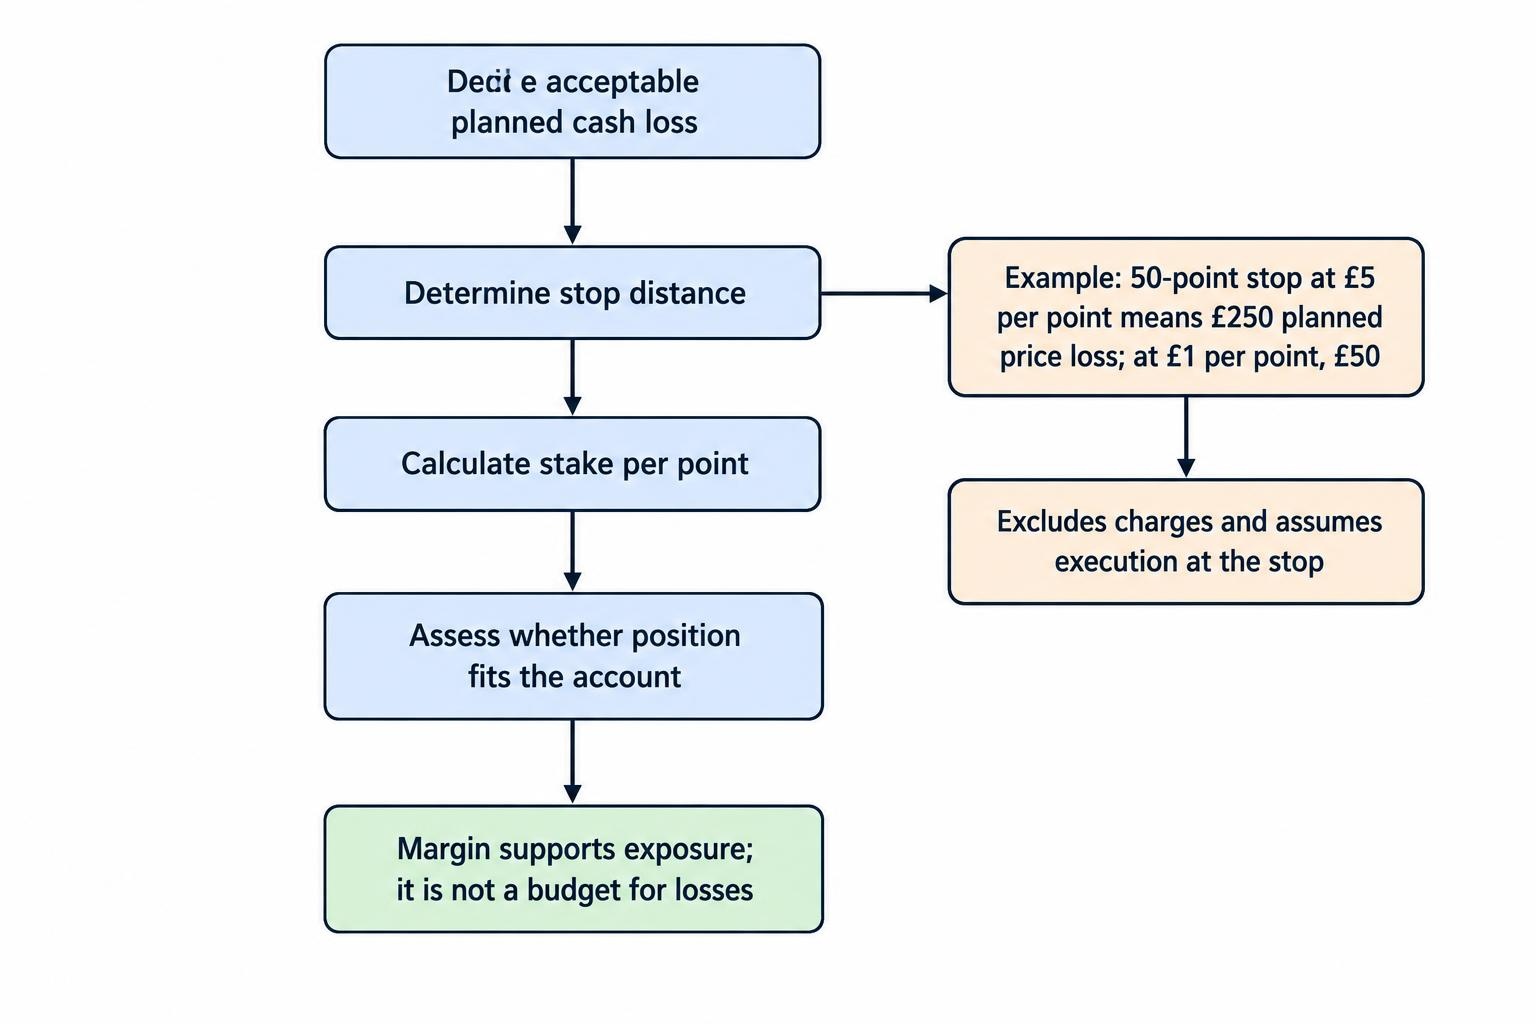
A sound position sizing process starts with the planned cash loss and the distance to the exit, then calculates the stake. Starting with the largest stake the platform permits reverses that process.
For example, a 50 point stop at £5 per point creates a planned price loss of £250. At £1 per point, the same distance creates a £50 planned price loss. These figures exclude charges and assume execution at the stop level; an ordinary stop does not guarantee that outcome.
There is no stake or percentage that makes trading safe. A smaller position can reduce damage, but it cannot turn a poor strategy into a profitable one.
Margin creates another trap. It is the money required to support exposure, not a budget for the trade’s loss. The fact that an account can open a position says little about whether it should. Margin risk becomes more pressing when several positions consume the same pool of account equity.
Ignoring the cost of getting in, getting out and waiting
Spread betting costs do not need to look large to overwhelm a small trading advantage. Their effect depends on the stake, trading frequency, target distance and holding period.
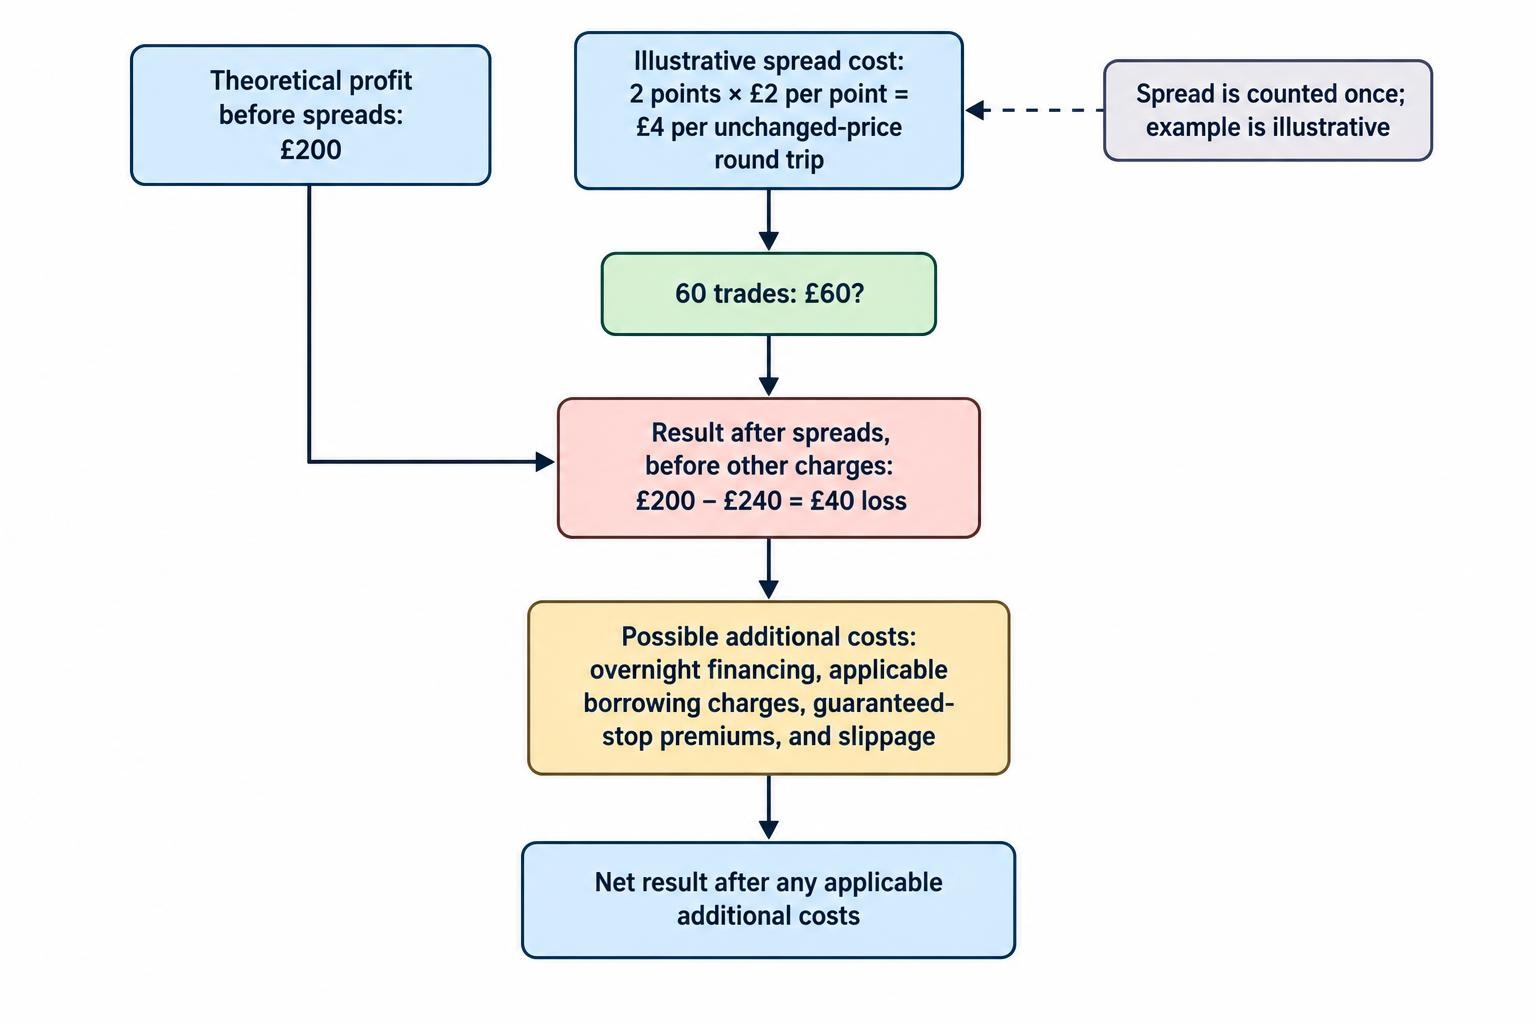
Assume a market has an unchanged two point bid-ask spread and the stake is £2 per point. If its underlying price does not move between entry and exit, the round trip loses £4 through the spread. That is one full spread across the round trip, not a separate full spread charged twice.
Repeat that transaction 60 times and the spread cost totals £240. A strategy producing £200 of theoretical profit before spreads would lose £40 after them, before any other charges.
The total cost of spread betting can also include overnight financing, borrowing charges on some short positions, and premiums for guaranteed stops. The relevant charges depend on the product and provider’s terms.
Daily funded positions held for weeks need a different cost assessment from positions opened and closed within a session. Slippage adds another difference between a chart-based result and the result obtained in an account.
Short targets leave less room for these expenses. A two point spread consumes a much larger share of a five point target than a 100 point target. That does not automatically make longer holding periods better; they introduce other costs and risks. It means costs must suit the method, rather than be treated as an afterthought.
Using stops that do not match the trade
A stop should express where the trade’s reasoning fails, while keeping the resulting cash loss within the trading plan. Placing it wherever the remaining account balance allows is not the same thing.
A trader may want a £10 per point position but accept only a £50 planned loss. That permits a five point stop before costs. If ordinary price movement regularly covers more than that distance, the desired stake and the trade do not fit together. The answer may be a smaller position or no trade, not a more optimistic forecast.
The practical task in managing risk with stop losses is to connect the exit level, stake and acceptable cash loss before entry.
Widening the stop after entry changes the bargain. A trade accepted with a £100 planned loss can become a £250 risk without any improvement in the original reasoning. The trader has not removed the problem, they have bought it more room.
Execution also matters. An ordinary stop can fill beyond its trigger price when prices move quickly or gap. A planned £100 loss is therefore not an unconditional maximum.
Where market gap risk is relevant, examine the event calendar, trading hours and available order protections before holding the position. If the possible loss is unacceptable without an exact exit, reconsider the exposure rather than assume the stop will solve everything.
Taking small profits while allowing large losses
A profitable position presents a tempting choice: close it now and bank a visible gain. A losing position presents a less pleasant one: close it and accept that the money has gone. Treating those choices differently can distort an otherwise reasonable strategy.
Eight £20 winners produce £160. Two £100 losers remove £200. The account has won on eight out of ten trades and still lost £40 before costs. A high win rate can hide a poor payoff pattern.
This does not mean every winner should run indefinitely or every losing position should close immediately. The issue is whether exits follow a consistent method or change whenever the profit and loss display becomes uncomfortable.
The same problem appears when a trader adds to a loser solely to improve the average entry. Suppose a £1 per point long position opens at 8,000. Another £1 per point is added at 7,900. At 7,800, the combined price loss is £300: £200 on the first entry and £100 on the second, before charges. Without the addition, the loss would have been £200.
The average entry improved. The cash loss became larger.
A planned scale-in approach is different only if its total exposure, exit conditions and cash risk were budgeted beforehand. Adding because a loss feels intolerable is not a substitute.
These decisions sit at the centre of spread betting psychology: the task is not to eliminate discomfort, but to stop discomfort rewriting the trading rules.
Overtrading and trying to win losses back
Overtrading means taking more trades than the strategy justifies. It can involve repeated entries after a stop, switching markets to find action, or accepting weaker setups because nothing better is happening.
Historical research provides relevant evidence, although it should not be mistaken for a spread betting study. Barber and Odean examined 66,465 US stock-investing households during 1991–1996. The most frequent trading group earned lower net returns than the least frequent group, while their gross performance differed far less. Their paper, Trading Is Hazardous to Your Wealth, shows how transaction costs can separate trading activity from trading success.
For spread betting, the arithmetic is straightforward: every extra trade must justify its costs and exposure. More opportunities to click do not create more opportunities with an advantage.
Loss recovery makes the problem worse. After losing £150, a trader may increase the next stake to recover that amount quickly. The new trade is now sized around yesterday’s result rather than its own risk.
A stronger setup could justify a different position only within a pre-existing method. “I need to get back to even” says nothing about the next trade’s prospects.
Practical controls for avoiding overtrading include defined trading sessions, entry requirements and a pause after rule breaches. A daily loss threshold can act as a circuit breaker, but it should not become an amount that must be used up.
Mistaking several positions for diversification
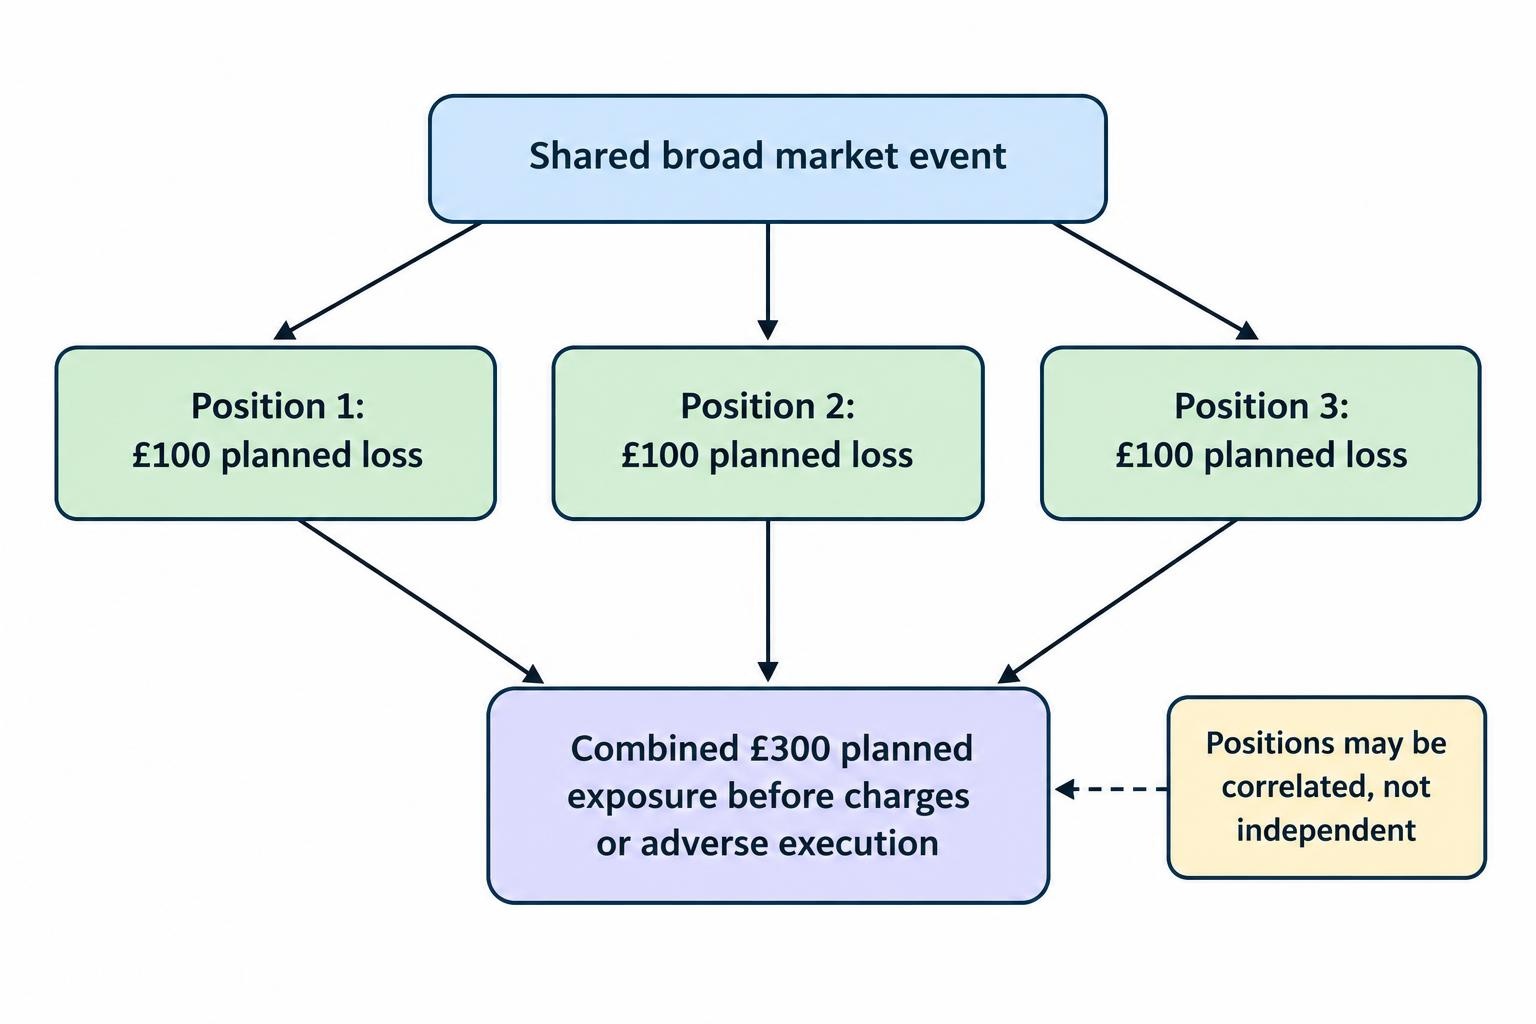
Five open positions do not necessarily represent five independent risks. Long bets on several equity indices can all be exposed to the same broad fall in share prices.
Suppose three positions each have a planned £100 loss. Viewed separately, each may look manageable. Viewed together, they expose the account to £300 of planned losses before charges or adverse execution. If the positions respond to the same news, they may reach their exits together.
The same question applies across asset classes: what event could hurt several positions at once? Different market names are not proof of different economic exposure.
Portfolio correlation concerns the relationship between positions, not just the number of tickets open. Relationships can change, so a past offset should not be treated as a guaranteed hedge.
Assess both individual trade risk and the combined account risk. Adding another trade to an already concentrated account may increase exposure without adding much variety.
Trusting backtests, demo profits or screenshots too quickly
A backtest can help assess a method, but it can also reward hindsight. If a trader repeatedly adjusts settings until one historical period looks profitable, the result may describe those past prices rather than a repeatable advantage.
A useful test needs rules that could have been followed at the time. It should include realistic spreads and charges, avoid using future information, and distinguish the data used to develop the rules from the data used to assess them.
Testing many variations and reporting only the best result hides the unsuccessful attempts. That matters even when nobody intends to mislead: the attractive result can emerge from the search process itself.
Spread betting demo accounts are useful for learning platform mechanics and practising a written process. They do not establish that live execution, costs or decisions under financial pressure will match the simulation.
A profit screenshot is weaker evidence still. It may omit open losses, earlier deposits, previous losing accounts or the exposure required to earn the displayed amount.
Judge a strategy through a complete record rather than its best moments. The record should show net results, drawdown, position sizes, rule changes and whether the approach still worked outside the period used to develop it. A smooth chart without that context leaves too many questions unanswered.
Responding badly to normal losing streaks
A losing streak does not automatically prove a strategy has stopped working. Equally, calling every loss “normal variance” can become an excuse to ignore deterioration.
The distinction requires evidence about the strategy and whether its rules were followed. Ten trades taken under changing rules are not a clean test of one method.
Stake escalation during a drawdown makes recovery harder because losses reduce the capital available to earn it back. The arithmetic is uneven:
| Loss from starting capital | Gain needed on remaining capital |
|---|---|
| 10% | 11.1% |
| 25% | 33.3% |
| 50% | 100% |
| 75% | 300% |
These are mathematical recovery requirements, not return forecasts. A 50% loss leaves half the original capital, which must then double to restore the starting amount.
A process for managing trading drawdown should define when to reduce exposure, review the method or pause. Increasing stakes simply because the recovery percentage looks uncomfortable compounds the original problem.
Expecting a small account to provide a salary
Income targets can create trading pressure that has nothing to do with market conditions. A £500 monthly withdrawal from a £5,000 account requires a 10% monthly gain just to maintain that balance, before considering any losing months.
The calculation does not make the target achievable. It reveals the burden being placed on the account.
If the required income is fixed but opportunities are uncertain, the temptation is to trade more often, use larger stakes or refuse losses. The account becomes responsible for paying bills on a timetable the market has not agreed to.
Money needed for rent, debt repayments or near-term spending should not depend on speculative trading results. Borrowing to fund the account adds a repayment obligation even if the trading capital disappears.
Performance targets are better used to evaluate a process than to demand a daily payout. No trade is sometimes the correct decision. A quiet session with no qualifying setup is not a business emergency.
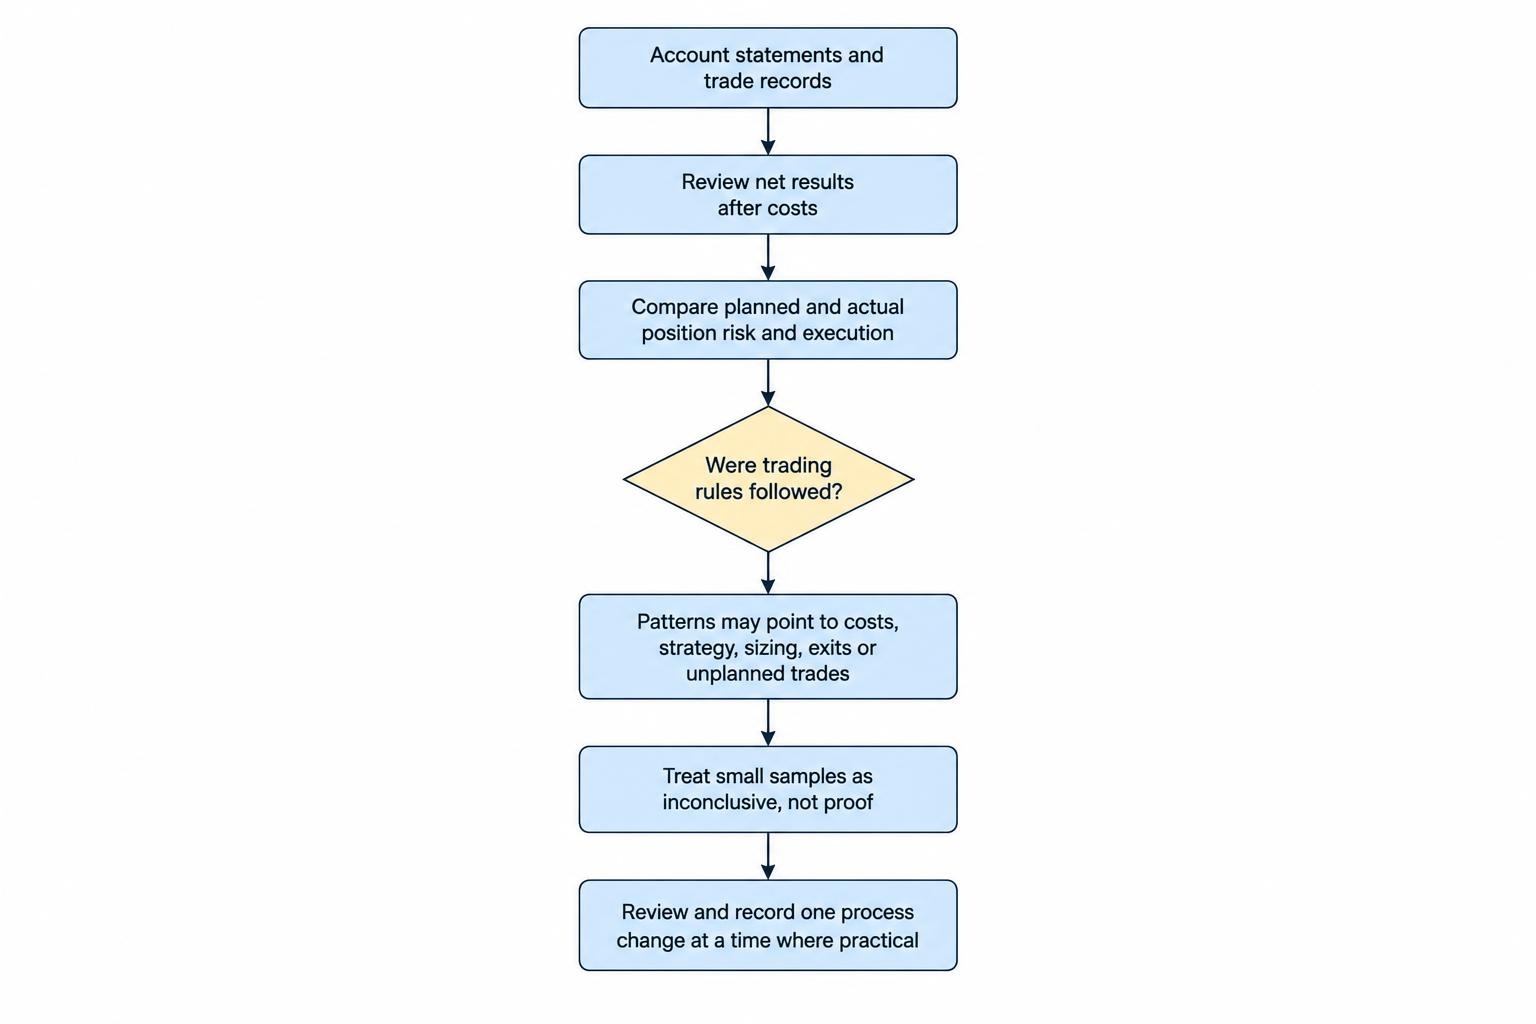
How to identify what is causing your losses
Start with the account record, not the most memorable trade. A dramatic loss may attract attention while a steady stream of small costs or oversized positions does more damage.
Use statements and trade exports to separate trading results from cash movements. Depositing another £1,000 increases the balance but does not improve performance. Open losses also matter; closing winners while leaving losers open can flatter the closed-trade total.
Reading spread betting account statements helps distinguish price profit and loss, financing, adjustments and other entries. Avoid subtracting costs twice where the reported figures already include them.
For each trade, record four things:
- The original plan: reason for entry, stake, intended exit and planned cash loss.
- The actual result: net profit or loss, charges and any difference between intended and actual execution.
- Rule compliance: whether you moved the stop, increased exposure or took an unplanned entry.
- The relevant conditions: market, session, holding period and exposure to scheduled events.
Then look for patterns. Positive results before costs but negative results after costs suggest the method does not clear its trading expenses. A few losses far larger than the plan point to sizing, exit or execution problems. Losses concentrated in unplanned trades indicate a different issue from losses in trades that followed the rules.
Do not treat those patterns as proof from a handful of observations. A small sample can make both a good and a poor method look convincing.
Change one part of the process at a time where practical, and record the change. Replacing the market, entry signal, stake and exit method together makes it difficult to tell what helped. The aim is to establish whether the problem is the strategy, its implementation, the costs or a combination of them.
When stopping is the right decision
Not every losing account needs another indicator, course or deposit. Sometimes the appropriate decision is to stop trading.
Pause if you cannot state the cash risk before entry, repeatedly override exits, hide losses, borrow to replenish the account or trade mainly to recover earlier losses. Reducing the stake does not resolve every problem, particularly where the activity itself is becoming difficult to control.
A pause creates room to reconcile the account and decide whether there is a defensible reason to continue. There is no obligation to recover lost money through the same activity that lost it.
Protecting trading capital includes deciding not to expose it. Better controls can reduce avoidable mistakes, but they cannot promise profitability or remove market risk.
The test is straightforward: can you explain why the method should work after costs, size it so losses remain tolerable, and follow it without changing the rules under pressure? If not, another trade does not answer the problem. It only adds another result.