Support and resistance are price areas that traders use to organise decisions about entries, exits and risk. Support describes an area where a decline has previously slowed or reversed; resistance describes an area where an advance has previously stalled. In financial spread betting, these references can help define a bounce, breakout or failed-break strategy. Their usefulness depends on how they are identified and traded. A historical reaction does not guarantee another one, and a line on a chart is not necessarily an executable price. This guide explains how to draw useful zones, assess their context and turn a price observation into a trade with defined costs and risk.
Support and resistance belong within a complete plan rather than replace one. The Financial Conduct Authority includes spread betting within its CFD product supervision and describes these leveraged products as high risk and unsuitable for some retail consumers. Even a carefully identified level can fail abruptly after news, changing liquidity or a shift in expectations. The examples below use hypothetical markets, prices and charges for trader education, not recommendations or forecasts. They show successful outcomes alongside losses and imperfect execution. Before using a real contract, establish its point value, dealing hours, price source and order rules, then assess whether the proposed stake and holding period fit the risk that can actually be tolerated.
What Are Support and Resistance?
Support is an area where earlier price action suggests that selling pressure was met by sufficient buying interest to interrupt a decline. Resistance describes the reverse situation during an advance. Traders usually identify these areas from previous turning points, range boundaries or other predefined references. The language describes observed behaviour rather than a physical barrier. A support zone does not contain an unlimited supply of buyers, and a resistance zone does not prevent further gains. Conditions can change between visits, so the next interaction needs its own assessment. The practical purpose is to define where a particular trading idea becomes relevant and what price behaviour would support or contradict that idea.
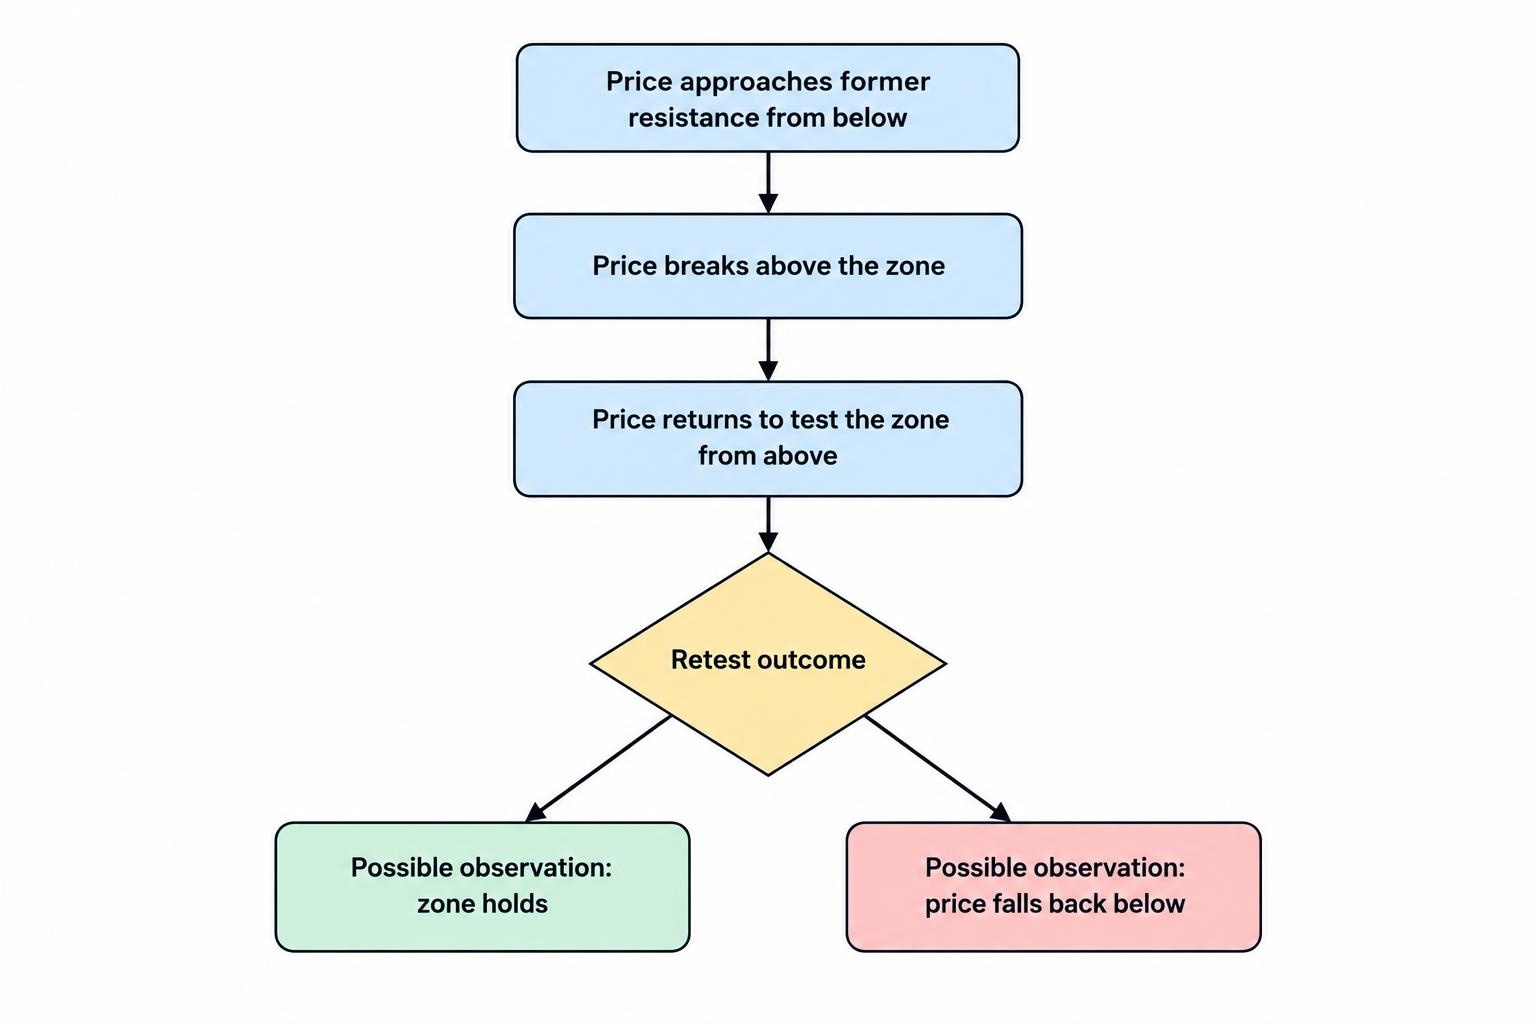
The same area can play different roles at different times. Price may approach a former high from below, break above it and later return towards it from above. Traders then investigate whether the former resistance behaves as support. This is often called a role reversal, but it is a possibility rather than a rule. The market can return below the area without holding, or continue away without ever retesting it. A useful plan defines what qualifies as a break, what counts as a retest and what evidence is needed before entry. Simply renaming a failed level after the event does not establish that the change could have been traded profitably.
Why Prices May React Around Familiar Levels
Previous turning points can become reference points for participants deciding where to enter, exit or revise orders. Round numbers and earlier session extremes may also attract attention. These are plausible reasons for clustered activity, but a standard chart does not reveal every outstanding order or the motives behind a move. A sharp reaction does not prove that a particular institution defended the area, and a brief excursion beyond a level does not establish manipulation. Describe what can be observed before assigning a cause. A trading rule can use a rejection or breakout without claiming access to hidden intentions that the available data cannot verify.
There is some historical research on these ideas, but its scope matters. Carol Osler’s study published by the Federal Reserve Bank of New York examined published support and resistance levels in foreign exchange and found evidence that they helped predict intraday trend interruptions, with results varying across the currencies and firms studied. That is evidence about a particular historical setting, not proof that every hand-drawn level or modern spread betting strategy is profitable. A pause in a trend is also different from a reversal large enough to cover dealing costs. The relevant question remains whether a clearly specified method works with the actual contract, data and execution conditions being used.
Who Might Support and Resistance Trading Suit?
This approach may suit a trader who prefers a clear price-based explanation for where a trade becomes interesting and where it should be abandoned. It can be used in day trading, swing trading or longer approaches, provided the timeframe and monitoring routine fit. The person needs to accept that several reasonable-looking levels will fail and that some reactions will occur without offering an economical entry. A useful skill is restraint: marking an area for observation does not create an obligation to trade every visit. The trader should be able to distinguish a repeatable rule from a discretionary interpretation that changes according to whether the last trade won or lost.
It is a poor fit when the trader treats levels as certainties, cannot tolerate a failed setup or continually widens stops to remain in a position. It can also become unmanageable when so many lines are drawn that almost every movement appears to touch something significant. Beginners can learn the concepts without advanced mathematics, but that accessibility should not be confused with easy profitability. The harder work is defining levels beforehand, keeping their interpretation consistent and calculating trades from actual dealing quotes. A demonstration account is useful for learning those mechanics, although a successful practice period cannot establish that a strategy will handle stressed markets, real slippage or the emotional effect of monetary losses.
Advantages and Limitations
The principal advantage is that support and resistance can make a trading plan concrete. An entry area, invalidation zone and possible target can be identified before the position opens. This allows the trader to compare the available reward with the distance to an adverse exit and reject trades that do not fit. The framework also works alongside other analysis: a fundamental view can identify a market to watch, while price zones help organise execution. These benefits concern decision-making rather than certainty. The fact that a level is visible to many traders does not demonstrate that it will hold, and a neatly drawn chart cannot compensate for a wide spread or an excessive stake.
| Potential advantage | Corresponding limitation |
|---|---|
| Provides identifiable areas for entries and exits | Different traders may draw different zones |
| Makes stop distances and targets easier to compare | Ordinary stops can slip or be crossed by gaps |
| Can support bounce and breakout methods | Choosing the wrong market context can produce repeated losses |
| Works across several chart timeframes | Levels do not transfer automatically between contracts or data feeds |
| Can be recorded and tested in advance | Retrospective drawing can make results appear better than they were |
| Helps reject trades with insufficient room to a target | A visible target does not guarantee that price will reach it |
The main limitation is that a level is a reference derived from earlier information. New earnings, policy decisions or changes in demand can make that information less relevant. Even without news, price can move beyond a zone and reverse, repeatedly cross it, or remain nearby without producing the expected move. The approach therefore needs explicit rules for uncertainty, including when to wait or stop trading a particular area. A strategy that assumes every touch will reverse is different from one that waits for a rejection, and both differ from a breakout method. Their results should be evaluated separately rather than combined into a flexible explanation that claims success regardless of which way price moved.
How to Identify Support and Resistance Before Trading
Begin with the price series and timeframe relevant to the intended trade. Mark a small number of clear earlier turning areas and the nearest boundaries likely to affect the available movement. Previous session highs and lows can be useful references for an intraday plan, while a swing trader may examine broader daily or weekly areas. The selection rule matters more than filling the chart. Record why each zone is included, when it became identifiable and what information was available at that point. If a swing low requires several later candles to confirm it, the level was not fully known at the moment of the low and should not be treated that way in a historical test.
| Reference | How it may be used | What to check |
|---|---|---|
| Earlier swing highs and lows | Identify previous turning areas | When the swing became identifiable |
| Range boundaries | Define the edges of a repeated trading area | Whether the range remains intact |
| Previous session high or low | Organise intraday price references | Session definition, time zone and data source |
| Round numbers | Identify possible areas of attention | Actual price behaviour rather than the number alone |
| Former support or resistance | Investigate a possible role reversal | A defined break and subsequent retest behaviour |
| Trendlines or moving averages | Provide a changing reference alongside horizontal levels | Drawing or calculation rules and their limitations |
Use Zones Rather Than Artificial Precision
Several earlier lows might sit at 8,975, 8,980 and 8,985. Treating 8,980 as an exact boundary may create precision that the evidence does not support; a zone from roughly 8,975 to 8,985 more clearly represents the observed area. Its width should come from a consistent method, not from stretching the zone whenever a trade moves against it. A broad zone may require a wider stop distance, smaller stake or no trade at all. A narrow zone may be less useful when spreads or ordinary price fluctuations are large relative to it. Record the boundaries before entry so the original decision can be assessed without changing the definition afterwards.
Wicks, Closing Prices and Repeated Tests
Wicks and closing prices answer different questions. A wick records the extreme reached during a candle, while its close shows where that interval ended. Neither is universally the correct boundary. A method might use extremes to define the full zone and completed closes to define acceptance beyond it, but those roles should be specified in advance. Repeated tests also need interpretation: they show that an area has mattered, but do not prove it is becoming stronger. Continued pressure can precede a break, while changing participation can produce another rejection. Avoid assigning a guaranteed outcome from the number of touches alone. Study what happened between visits as well as at the level itself.
Timeframes, Trendlines and Dynamic References
A daily support zone may provide context for an hourly entry, but the two charts should have assigned roles. A level from a longer timeframe can involve a wider price range than a short-term account is prepared to risk. It is therefore not automatically a better trade. Trendlines and moving averages can add changing references, although their position depends on drawing rules or calculation settings. Several overlapping references do not necessarily provide independent confirmation because they may reflect the same price history. Choose which information actually changes the decision, and avoid switching timeframes or redrawing a trendline simply to justify holding a trade after its original invalidation condition has occurred.
Support and Resistance Zones Are Not Entry Orders
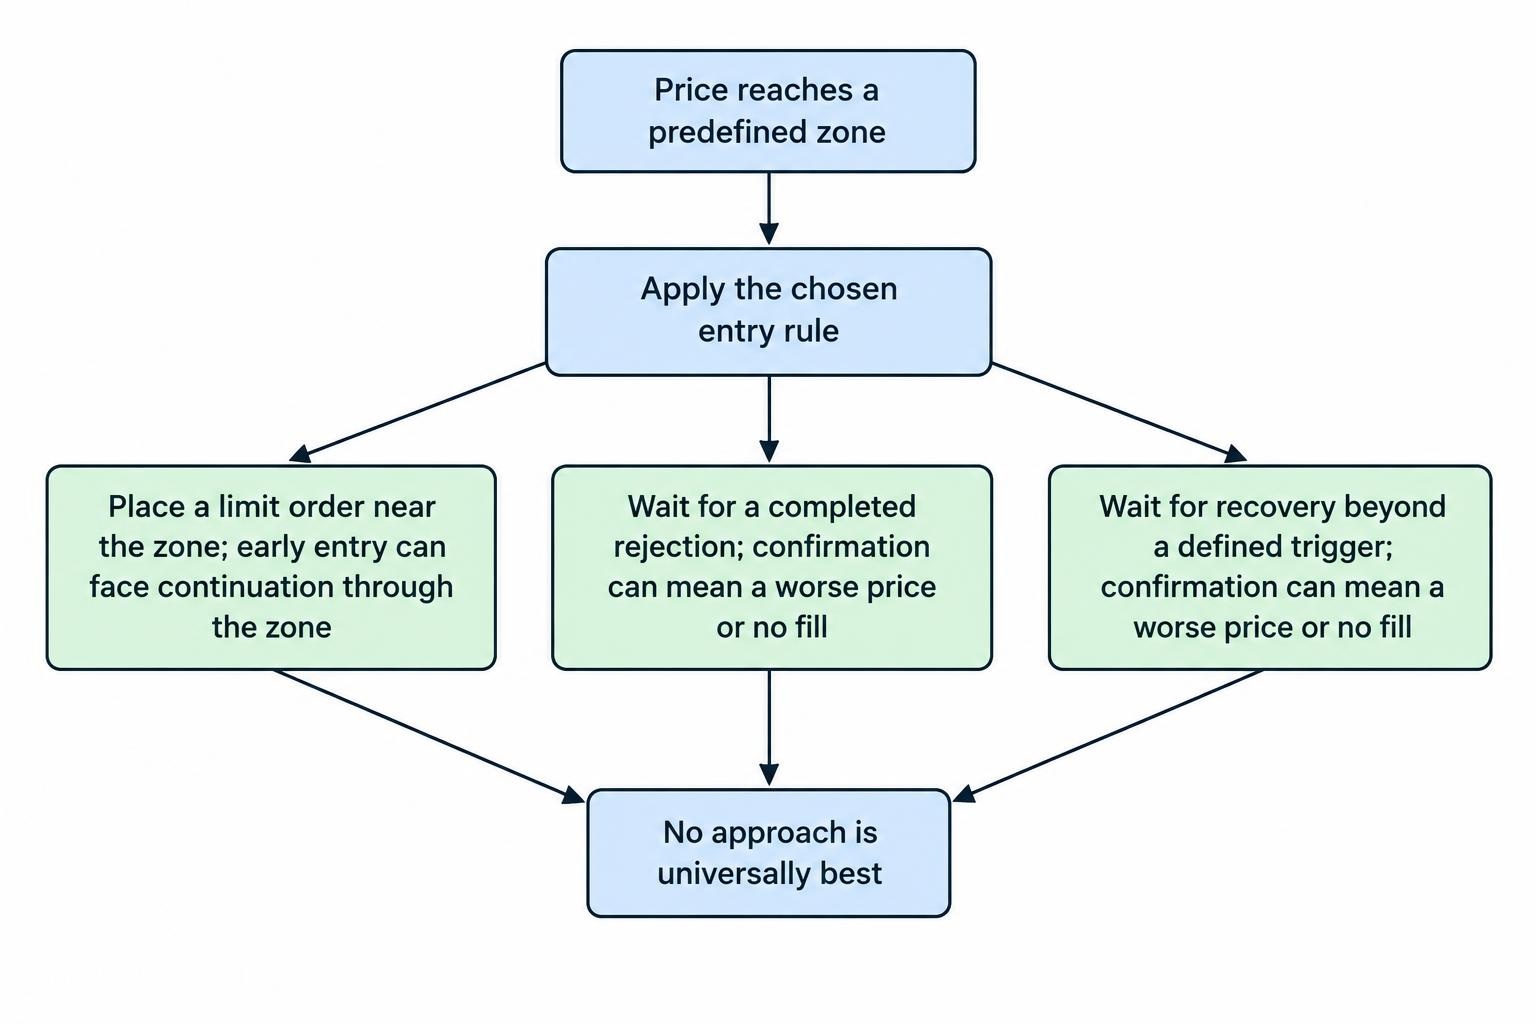
A zone identifies where a decision might be considered; an entry rule determines whether action is taken. A trader could place a limit order near support, wait for a completed rejection candle, or require price to recover above a defined trigger after visiting the area. Those choices involve different trade-offs. Entering early may offer a smaller stop distance but expose the position to a decline that continues straight through support. Waiting provides additional information but can produce a less favourable entry or no fill. There is no universal choice that preserves every benefit. The method should be tested using the entry rule actually intended, including missed trades and the prices available after confirmation.
| Approach | Intended behaviour | Main risk |
|---|---|---|
| Bounce or rejection | Price turns away from a zone | The zone fails and movement continues through it |
| Breakout or breakdown | Price moves beyond a boundary and continues | The break reverses into the previous area |
| Break and retest | A broken area holds when revisited | The retest fails or never occurs |
| Failed-break trade | Price moves beyond a zone, then returns inside | The return is temporary and the breakout resumes |
Trading a Bounce From Support or Resistance
A bounce method expects price to turn away from the identified area. A long setup near support might require a visit to the zone followed by a completed recovery, with a stop beyond a level that makes the idea unacceptable. A short setup near resistance reverses that logic. The target should reflect the next relevant obstacle and the movement realistically available from the actual entry. These methods often appear within range trading, but buying every support touch during a strong downtrend is a different proposition. Assess the approach to the zone and the wider context, and decide in advance what price behaviour would mean that the expected reaction has failed.
Trading a Breakout, Breakdown or Retest
A breakout method expects movement beyond resistance to continue, while a breakdown method expects continuation below support. The plan must define whether a valid break requires a traded price, a completed close, a minimum distance or another observable condition. Waiting for a retest changes the strategy: it may allow an entry nearer the broken area, but the retest can fail and strong moves may never return. A former resistance zone becoming support is therefore a hypothesis to assess, not an automatic buy signal. The breakout trading guide explains the wider entry choices. Record missed retests as part of evaluation rather than assume every historical breakout offered a convenient second opportunity.
False Breaks and the Limits of Chart Interpretation
A false break describes a move beyond a defined boundary that subsequently returns, under whatever timing and distance rules the strategy uses. The term is only useful if those rules are clear. A brief return inside a range may become a reversal, or price may resume the breakout after a pause. Neither outcome can be known from the first excursion alone. A trader using failed breaks needs an entry condition, invalidation point and target just as a breakout trader does. Avoid describing every failed trade as a deliberate stop hunt. The price path may be consistent with many causes, and an unsupported explanation of other participants’ intentions does not improve the next risk decision.
Bid, Ask and the Price That Actually Triggers the Trade
Support and resistance should be connected to the correct price series. A chart may show a bid, ask, midpoint or underlying exchange price, while the spread bet trades at its own two-way quote. A long position opens at the buy price and closes at the sell price; a short opens at the sell price and closes at the buy price. Stop triggers depend on the provider’s rules. A short stop can therefore be reached by the buy quote even if a sell-price chart appears below the same number. Before concluding that an order behaved incorrectly, compare the relevant quote and trigger terms. The analytical level and the executable order are related, but they are not necessarily identical.
For example, a midpoint remaining near 1.2800 can coexist with changing bid and ask prices if the spread widens. The resulting exit price may differ even without a large midpoint movement. Session changes, announcements and thin conditions can make this particularly relevant to narrowly placed orders. Similarly, a level drawn on an underlying cash index may not match the provider’s contract outside the cash session, especially where related futures inform its pricing. Use the contract you intend to trade when checking entry and exit feasibility, and allow for differences between research charts and dealing charts. Do not mechanically copy a line from another price source and assume it defines the same risk in the spread betting account.
Practical Example: Buying an Index After Support Holds
Assume a hypothetical index has an established sell-price support zone between 8,975 and 8,985, with resistance around 9,080 to 9,090. After price visits support and meets a predefined recovery condition, the available quote is 8,990/8,992. The trader buys at 8,992 for £0.50 per whole index point. An ordinary stop is set at a sell price of 8,962, creating 30 points, or £15, of intended price risk. The planned target is 9,072, below the marked resistance area, offering 80 points, or £40, of price profit. Assume each alternative below closes intraday, with no funding, commission or other adjustments. The spread is included in the actual opening and closing prices.
| Alternative outcome | Closing sell price | Movement from entry | Profit or loss |
|---|---|---|---|
| Recovery reaches the planned target | 9,072 | +80 points | +£40 |
| Planned early exit after a limited rise | 9,022 | +30 points | +£15 |
| No follow-through; exit at the original sell quote | 8,990 | −2 points | −£1 |
| Ordinary stop fills at its requested price | 8,962 | −30 points | −£15 |
| Gap through support; stop fills at 8,932 | 8,932 | −60 points | −£30 |
The target before resistance is a planning choice, not proof that price will reach it or reverse afterwards. The example also shows that the £15 stop-based risk is not a guaranteed maximum. An adverse gap can create a larger loss even though the support zone was defined carefully. If the trader waits longer and buys at 9,022 while keeping the same stop and target, the intended price risk rises to £30 and the potential price profit falls to £25 at the same stake. Confirmation has changed the trade’s economics. If an overnight hold instead introduces £3 of funding, the original £40 winning outcome becomes £37, assuming the same exit and no other changes.
Practical Example: Selling Forex Near Resistance
Suppose a hypothetical GBP/USD sell-price chart has a resistance zone from 1.2800 to 1.2810. After a visit to the area and a completed rejection under the trader’s rules, the quote is 1.2792/1.2794. The trader sells at 1.2792 for £0.50 per 0.0001 pip, with an ordinary stop at a buy price of 1.2822. That gives 30 pips, or £15, of intended price risk. The target is a buy price of 1.2732, offering 60 pips, or £30, of price profit. If achieved after an assumed £2 net funding debit, the result is £28. The stop and target use buy prices because those are the prices required to close the short.
If the market instead gaps higher and the ordinary stop executes at 1.2852, the price loss is 60 pips, or £30. With the same assumed £2 funding debit, the net loss is £32. Resistance has failed to provide the expected barrier, but that is a foreseeable category of outcome rather than evidence that the method can never work. The correct response depends on the predetermined loss and review rules. Selling more simply because the market has moved further above the original zone changes the exposure and can magnify the damage. A new short would need a new valid setup and a fresh risk assessment, rather than an attempt to make the original resistance level correct by force of conviction.
Practical Example: Resistance Becomes Support on a Retest
Consider a different hypothetical index with resistance marked from 9,500 to 9,510 on its sell-price chart. A completed candle closes at 9,518, meeting the defined breakout condition. Price subsequently returns to 9,508 and recovers to a completed close at 9,516, meeting the separate retest rule. At a quote of 9,516/9,518, the trader buys at 9,518 for £0.50 per point, with an ordinary stop at 9,488 and a target at 9,578. The intended price risk is £15 and potential price profit is £30. If the target is reached after £1 of assumed funding, the net gain is £29. The example illustrates a defined sequence, not a guarantee that broken resistance becomes support.
If the retest fails and the stop fills at 9,488, the loss is £15 before the assumed £1 funding charge. If a gap instead produces a fill at 9,468, the price loss becomes £25, or £26 after funding. Another possibility is that the breakout never retests and the trader obtains no position. That missed trade belongs in the record because the method deliberately requires the retest. A historical review that enters at the breakout when no retest occurs, but uses the better retest price when one does occur, combines information that was unavailable at the time. Evaluate the chosen entry method consistently, including the opportunities it gives up as well as the entries it permits.
Placing Stops and Choosing the Stake
A stop should relate to what makes the trade unacceptable, with suitable consideration of price variation and contract terms. Placing it exactly on the visible edge of a broad zone may not fit the strategy, while placing it far away merely to avoid being stopped can create excessive risk. There is no universally correct number of points beyond support or resistance. Recent ATR can provide volatility context, but it cannot predict the next maximum move. Once the planned distance is established, calculate the stake from the monetary risk budget. A £15 budget divided by a 30-point stop distance implies £0.50 per point, before allowing separately for costs and worse-than-planned execution.
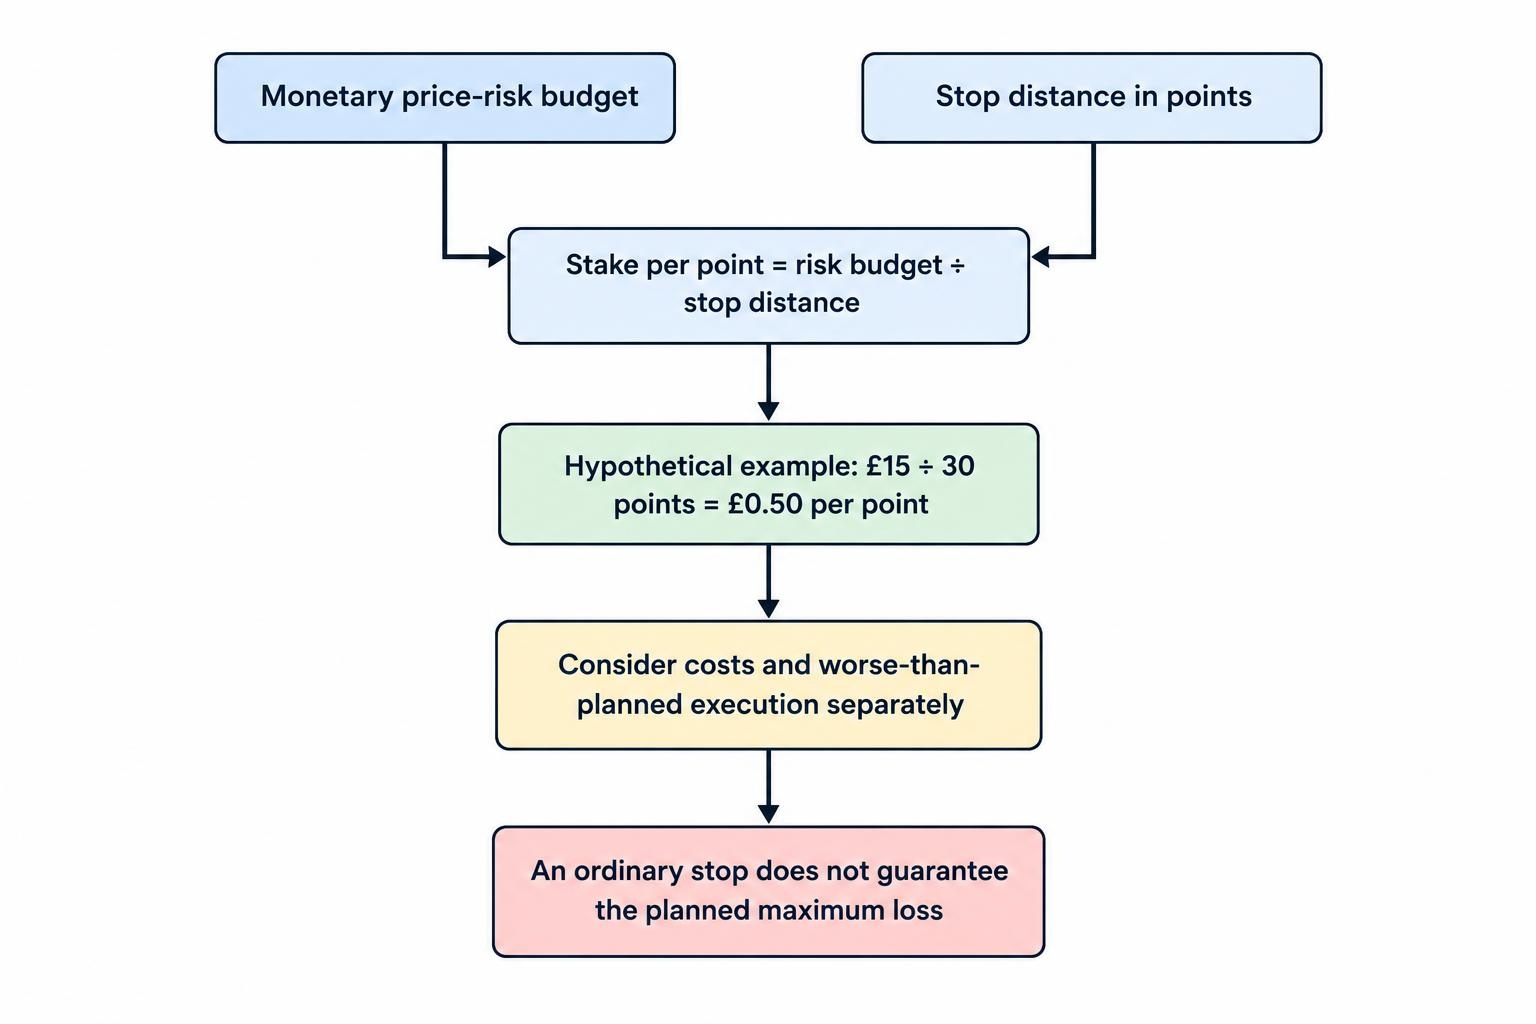
If a different setup needs a 60-point distance, the same £15 price-risk budget implies £0.25 per point, assuming the contract permits that stake. Keeping £0.50 would double the intended price loss. The minimum available stake can therefore make a setup impractical even when the chart looks attractive. Guaranteed stops, where available and valid under their terms, can provide execution at the agreed stop level, but premiums and other costs must be included. They do not establish that the support or resistance analysis is correct. The position sizing guide develops the relationship between stake, stop distance and capital so the level does not become an excuse for taking more risk than intended.
Margin and Account Protection
Margin is different from the intended loss at a stop. In the first index example, 8,992 multiplied by £0.50 represents approximately £4,496 of underlying exposure. At an assumed 5% opening margin requirement, the position needs approximately £224.80. The FCA’s retail rules specify a minimum 5% opening margin for major stock market indices, while firms may require more. The opening requirement does not describe the full cash needed to support losses and charges. Several trades near different support zones can also share the same economic exposure, so their losses may arrive together. A chart level should be considered within the account’s wider capacity rather than treated as an isolated promise of protection.
The FCA’s retail rules also require closeout as soon as market conditions allow when account net equity falls below 50% of required margin, and limit liability for covered investments to funds in the relevant account. These protections do not guarantee a specific stop price or preserve deposited money. A trader can lose account funds even with every level marked correctly and every ordinary stop entered. Understand the firm’s actual closeout arrangements and the effect of other positions before committing capital. Waiting for price to return to a favoured support zone may become impossible if the account lacks sufficient equity to maintain the position through the adverse movement needed to get there.
Targets, Reward and Trading Costs
The next support or resistance area can provide a target reference, but the available reward must be measured from the executable entry. Buying just below resistance may leave too little room for a worthwhile gain even if the broader trend is upward. A favourable-looking reward-to-risk ratio is also incomplete without considering the likelihood and distribution of actual outcomes. A target three times further away than a stop is not automatically superior if it is rarely reached or requires expensive holding periods. Record realised gains, losses and costs rather than evaluating the strategy only from the ratios drawn on its charts. Partial exits and trailing stops change the outcome distribution and should be tested as specific rules.
Funding matters when the reaction takes longer than expected. The FCA’s review of CFD pricing and value highlights funding on full underlying exposure and differences in charges, including whether comparable short positions attract a debit or credit. A support-based entry does not suspend those economics while the trader waits. Include the spread, possible slippage, financing and any applicable borrowing or dividend adjustments in the plan. When actual opening and closing quotes already include the spread, do not deduct it a second time. A modest bounce that looks profitable on a midpoint chart may produce little or no net gain once the executable prices and holding period are taken into account.
Using Indicators and News as Context
Other tools can help answer specific questions about a zone. RSI may describe recent momentum, while candlestick patterns can define a completed rejection condition. Neither proves that support will hold. Several indicators agreeing may simply reflect the same price movement, so avoid multiplying confidence as though each were independent evidence. Scheduled announcements also deserve attention because new information can overwhelm the relevance of earlier turning points. A strategy should state whether it permits entry or holding through those events. The news trading guide explains the execution issues, while fundamental analysis helps assess why changing information may alter the market’s behaviour around a previously useful price area.
How to Get Started Practically
Choose one market and a timeframe that matches the attention available. Establish the chart’s price source and mark only a few zones relevant to the current area. Write down how they were identified, what qualifies as a valid interaction and whether the method trades bounces, breakouts or failed breaks. Practise the complete process in a demonstration account, including the stake calculation and the closing side of the quote. Before opening a real account, follow the FCA’s guidance on checking authorisation, including permissions and contact details. Authorisation does not validate a charting method. The contract’s dealing hours, minimum stake and order facilities must still make the intended plan workable.
Keep a record of the zones as drawn before price revisits them. Save the entry condition, the available quote, the planned stop and target, and the reason for accepting or rejecting the trade. Include zones that failed and occasions when no valid signal appeared. This prevents the learning process from becoming a collection of attractive reversals selected afterwards. When reviewing a loss, distinguish whether the level selection was inconsistent, the entry rule was ignored, execution differed from the assumption or the trade simply failed within the method’s normal uncertainty. Each has a different implication. Changing every part of the method after each loss makes it difficult to discover which decisions are helping or harming the results.
Testing Support and Resistance Without Hindsight
Historical tests must identify levels using only data available before the proposed trade. Previous-day highs cannot be used before that session ends, and a confirmed swing requires whatever later observations the definition specifies. If the same bar reaches both the stop and target, its high and low alone do not establish which happened first. Use suitable finer data or a conservative assumption rather than automatically selecting the favourable path. Include actual dealing-side logic, wider spreads where relevant and trades that would not have filled. Levels drawn on adjusted share data or continuous futures charts also need care: corporate actions and contract rolls can create differences between the research series and prices historically available for dealing.
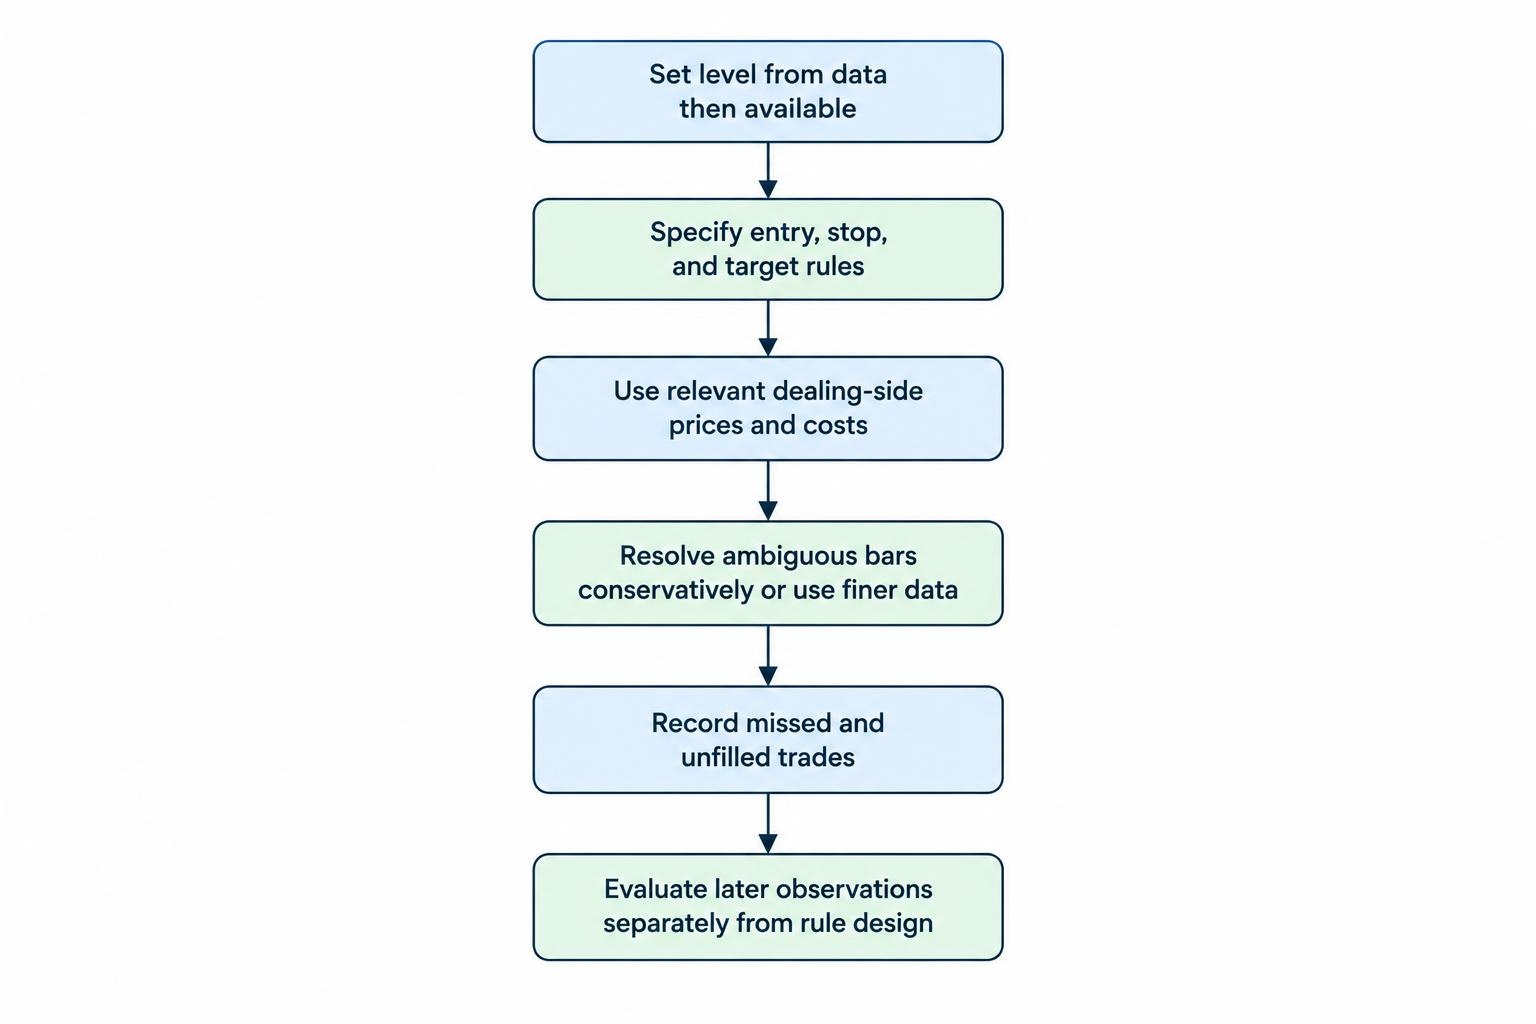
Separate the period used to design the rules from later observations used to evaluate them. Trying many zone widths, timeframes and confirmation conditions can produce an attractive historical result by chance. The research paper The Probability of Backtest Overfitting examines this wider strategy-selection problem. Record the alternatives considered and look for results that do not disappear after small, reasonable changes in settings or costs. Evaluate drawdowns, losing streaks and dependence on a few unusually large winners, not just the winning percentage. A demonstration test can help verify the mechanics, but neither it nor a historical chart proves that future support and resistance interactions will offer the same opportunities or execution.
Common Mistakes to Avoid
Common mistakes include drawing levels after a reversal, assuming repeated touches guarantee strength, and widening a zone until a losing trade appears valid again. Others involve entering too close to the next obstacle, ignoring a changing spread or taking every bounce against a strong trend. A trader may also remove a stop because the level looks important on a longer timeframe, thereby changing the original risk agreement with themselves. Keep the chart interpretation and the money-management decision separate enough to evaluate both. A level can remain relevant to future analysis after a particular trade has been closed. There is no need to remain exposed indefinitely merely to prove that the original observation eventually had some value.
UK Tax Treatment of Support and Resistance Trades
Using support and resistance does not determine the tax treatment of a spread bet. HMRC’s general guidance on betting and gambling explains that betting profits are not normally taxable and losses are not normally relieved. Its specific spread betting guidance says the terms and economic substance matter, including whether the activity arises from carrying on a trade. Personal circumstances and residence can be relevant, with separate considerations for companies. A chart-based method or a formal set of rules does not resolve those questions by itself. Where tax treatment is uncertain or important to the decision, obtain advice on the actual circumstances rather than assume that an expected tax advantage makes the strategy worthwhile.
What Makes Support and Resistance Useful?
Support and resistance are useful when they make a decision clearer before the outcome is known. The trader should be able to explain why a zone was selected, what behaviour would justify entry, where the trade becomes unacceptable and how the actual quote affects the available reward. That framework must allow for breaks, missed trades and larger-than-planned losses rather than assume the market respects every line. Within technical analysis, these areas provide context for a complete spread betting strategy. Their practical value comes from consistent identification, realistic execution and disciplined risk limits, together with the willingness to stop using an interpretation when price or new information no longer supports it.