The UK spread betting market connects private traders with financial prices through contracts quoted in pounds per point. Its commercial appeal rests on flexible position sizes, access to rising and falling markets, and the UK tax treatment of qualifying bets. Its risks come from the same place: a small initial payment can support a much larger exposure.
Measuring this market is harder than describing it. Spread betting sits alongside contracts for difference, foreign exchange dealing, share trading and institutional services inside broader businesses. A provider’s revenue, customer count or trading volume may therefore say little about UK spread betting on its own.
This article examines the market’s structure, the public evidence available, and the forces that shape competition. It uses publications available by 22 October 2026, distinguishes reported figures from illustrative calculations, and does not present global broker results as a domestic market estimate. Related studies sit within our spread betting research hub.
What Counts as the UK Spread Betting Market?
A useful definition is the provision and use of financial spread betting contracts by UK customers through firms serving that market. That sounds straightforward until the research starts. Customers, contracts, trading brands and legal entities do not always line up neatly.
A UK resident might use several providers. One provider might offer both spread betting and CFDs through the same platform. A corporate group might operate several brands, serve customers across several countries, and report results under a broad derivatives category. Counting any one of those categories as “the market” produces a different answer.
Financial spread betting also needs to be separated from sports betting. A financial spread bet references a market price, such as a share index, currency pair or commodity. A sports spread bet references a sporting outcome. Similar staking language does not make their customers, commercial economics or regulatory analysis interchangeable.
The Product Boundary
For market research, spread betting should be identified by the contract rather than the appearance of the trading screen. A platform can display almost identical charts and prices for products with different contractual and tax treatment.
CFDs and spread bets can provide closely related economic exposures. That makes combined reporting understandable, but it does not make the products interchangeable for measurement. Our comparison of spread betting and CFDs covers the product differences; the research problem is that combined figures cannot be separated without supporting disclosure.
Nor should every balance held with a provider be treated as spread betting capital. A customer may hold cash for future trades, maintain an investment account, or use several services within the same group. Account balances need a clear product boundary before they become useful evidence.
The Geographic Boundary
“UK market” can refer to customer residence, the location of the contracting firm, the office managing the relationship, or a reporting division labelled “UK and Ireland”. Those definitions answer different questions.
For a study of domestic participation, customer residence is the most relevant starting point. For a study of supervision, the contracting legal entity matters more. For a study of a listed company, management’s geographic reporting may be the available measure. A sound analysis states which definition it uses rather than switching between them halfway through.
How Large Is the UK Spread Betting Market?
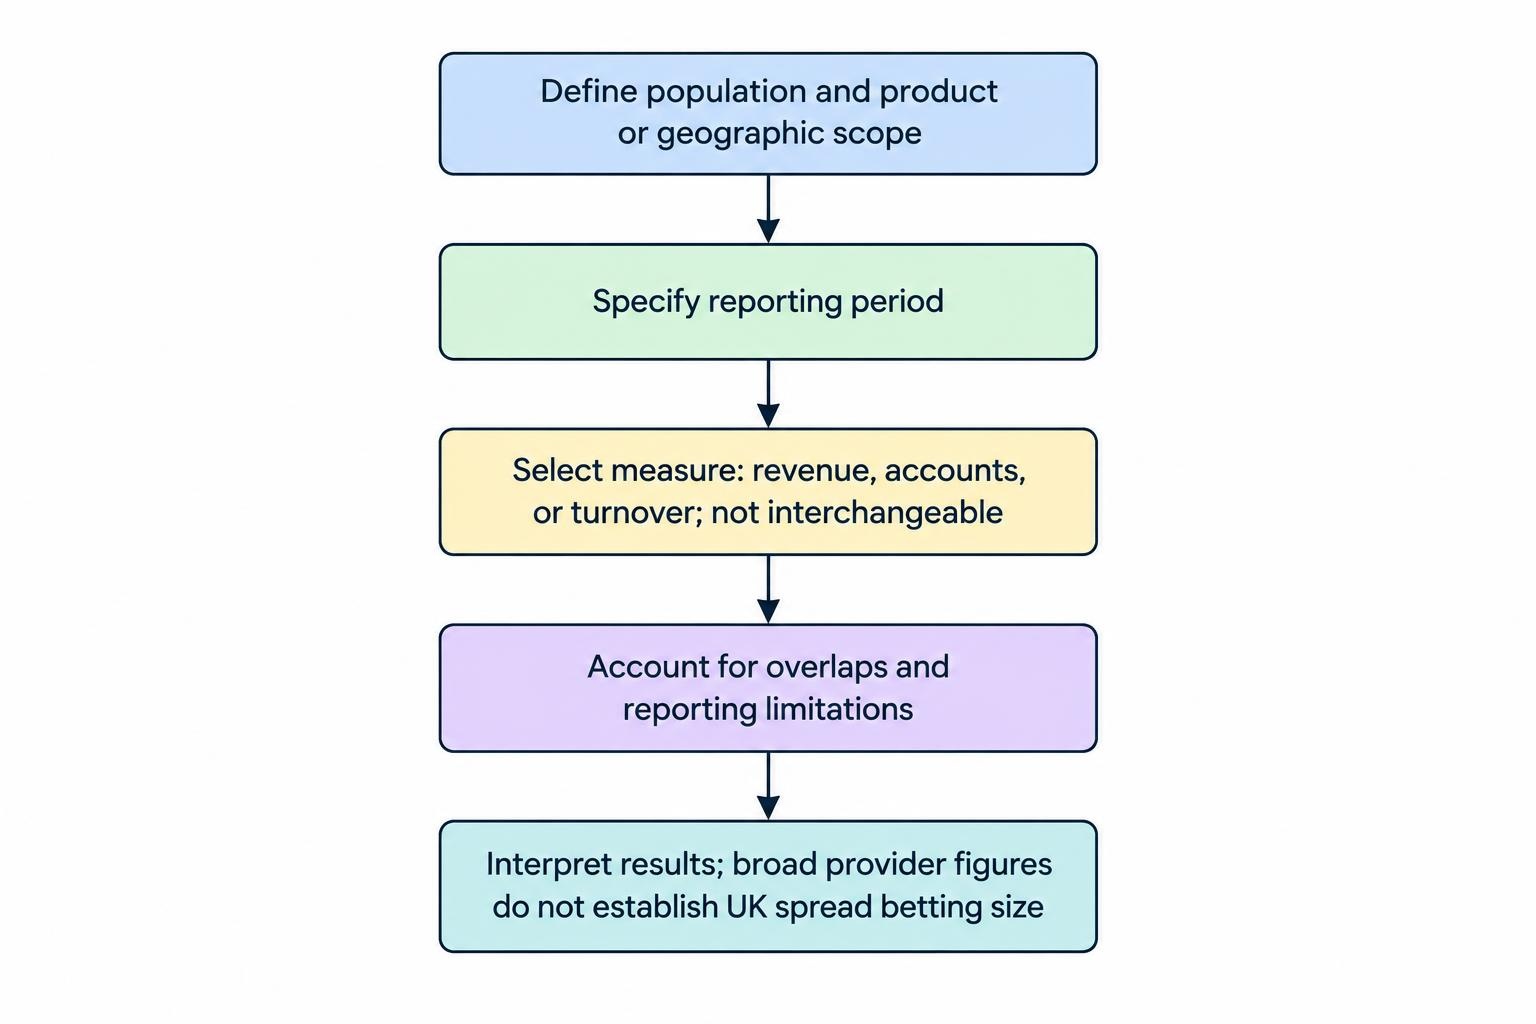
The public evidence reviewed for this article does not establish a defensible standalone revenue figure or count of individual UK spread bettors. It does establish the scale of some businesses operating around the product, and it provides evidence about broader derivatives activity and regulatory priorities.
That distinction matters. A global trading group can generate hundreds of millions of pounds in revenue without that sum representing UK spread betting. A large customer figure can include share investors, overseas customers and people using other derivatives. Even a domestic derivatives total may combine CFDs with spread bets.
A market estimate needs more than a large number and a confident heading. It needs a defined population, a reporting period and a method for removing overlap.
| Measure | What it can show | What it does not establish by itself |
|---|---|---|
| Provider revenue | The commercial income reported for a business or product category | Total UK spread betting revenue unless product and geographic boundaries match |
| Active accounts or customers | Participation under the reporting firm’s definition | The number of distinct people active across the whole market |
| Notional trading turnover | The reference value of trading activity over a period | Customer deposits, provider revenue or money at risk |
| Client money balances | Funds held at a reporting date within the stated scope | Annual trading activity or the value of open market exposure |
| Survey participation estimates | Estimated behaviour within a sampled population | An audited census of customers or accounts |
Accounts Are Not People
Suppose three fictional providers each report 20,000 active UK spread betting accounts. Adding them gives 60,000 accounts. It does not prove that 60,000 different people traded.
If some customers use two or three providers, the person count is lower. The amount of overlap cannot be recovered from the three account totals alone. An adjustment requires customer-level matching under appropriate safeguards, or a survey designed to measure use of multiple providers.
The activity definition matters too. Someone who traded once during a year is different from someone active every month. An annual active count, a monthly average and an end-of-period funded account count should not share a comparison column without explanation.
Turnover Is Not Market Revenue
Notional turnover can be large because positions provide exposure beyond the cash committed, and because the same capital can support repeated trades. It is a measure of activity, not a pot of money sitting in customer accounts.
A trader could repeatedly open and close exposure using the same account balance. Counting the reference value of every transaction would produce turnover far above that balance. This is not an accounting error; it is the wrong number being used to answer the wrong question.
Revenue measures need care for a different reason. Gross revenue, net trading revenue and net operating income can deduct different items. Before comparing providers, read the definitions. A study of spread betting costs also needs to distinguish what customers pay from what a provider retains after its own trading and distribution expenses.
What Published Evidence Actually Shows
Two listed-company disclosures illustrate both the commercial scale around spread betting and the limits of using group figures. They are examples, not a complete provider census or a market-share ranking.
IG: A Domestic Derivatives Figure Is Still Broader Than Spread Betting
IG’s results announcement dated 19 March 2026 reported £287.0 million of UK and Ireland OTC derivatives net trading revenue for calendar year 2025, compared with £261.5 million for calendar year 2024. That was reported as 10% growth. The announcement also distinguished its transitional seven-month financial year from its calendar-year comparisons: IG’s results and reporting-period definitions.
This is useful evidence of revenue generated within a stated regional derivatives division. It is not a standalone UK spread betting figure: the category is OTC derivatives, and the geography includes Ireland.
The reporting-period distinction is just as important as the amount. Comparing a seven-month statutory figure with a twelve-month figure would distort the apparent direction of trading. A researcher should preserve the period labels even when the shorter version would make a cleaner chart.
CMC Markets: Group Scale Does Not Equal Domestic Product Size
CMC Markets’ preliminary announcement dated 4 June 2026 reported net operating income of £392.6 million for the year ended 31 March 2026, against £340.1 million a year earlier. Its alternative performance measures also reported 55,081 active trading clients, compared with 52,290. The announcement covered a broader international business, including investing and institutional partnerships, and identified the financial information as unaudited: CMC Markets’ preliminary FY2026 results.
Those figures help assess the reporting group’s scale and direction. Neither is a count or revenue measure for UK spread betting alone.
They also demonstrate why revenue and participation should be examined separately. A business can earn more because more customers trade, existing customers trade more, the product mix changes, or income per transaction changes. Revenue growth alone cannot distinguish those explanations.
The October 2026 Regulatory Evidence
The FCA’s publication of 15 October 2026 followed a May 2026 survey asking 81 CFD firms about changes made after its earlier price and value review. Its scope included spread bets and rolling spot forex. Only 12% of firms said they had changed any charges, while concerns remained about overnight funding, disclosure and charges on matched positions: FCA findings on CFD firms’ pricing and fair value practices.
The 81 firms were a survey population for a broader sector exercise, not a count of UK spread betting providers. The 12% figure described firms’ reported actions, not the share of customer accounts receiving lower prices.
The commercial inference is narrower, but useful: clearer fee information and cheaper trading are separate outcomes. A disclosure can become easier to read without the underlying charge falling. Market comparisons should test both.
Why the Product Has a Strong UK Association
A Long Commercial History
Financial spread betting has a long domestic history. IG’s 2014 annual report records that IG Index was founded in 1974 as the UK’s first financial spread betting company: IG’s historical account of its UK spread betting business.
That history helps explain established terminology and brand recognition. It does not, by itself, tell us how many people trade now or how market shares have changed. Historical prominence and present market size are different research questions.
London’s Financial Infrastructure
The UK’s wider financial markets provide context, but their size must not be confused with retail spread betting. The Bank of England’s release of 30 September 2025 reported average daily UK foreign exchange turnover of $4,745 billion in April 2025 and a 37.8% share of global turnover. The survey concerned leading financial institutions, not a census of spread bettors: Bank of England results from the 2025 BIS turnover survey.
The reasonable inference is that spread betting operates alongside a substantial financial services base. Pricing inputs, hedging relationships and specialist staff belong in that broader commercial context. There is no defensible calculation that converts wholesale foreign exchange turnover into a retail spread betting market value.
Tax Treatment Creates a Product Distinction
UK capital gains treatment is one reason the contract matters. HMRC’s guidance states that no assets are acquired or disposed of through spread betting and that no chargeable gains or allowable losses arise: HMRC guidance on financial spread betting and capital gains.
The losses point belongs beside the gains point. A favourable treatment of qualifying gains does not imply relief for qualifying losses. Describing only one side gives an incomplete account of the product’s economics.
Tax language also needs boundaries. HMRC’s business income guidance says that whether a particular spread bet is taxable depends on the contract terms and economic substance, and that taxable wins must arise from carrying on a trade: HMRC guidance on spread betting and trading income.
A market article should not turn those provisions into a personal tax assurance. Residence, business use and the nature of an arrangement require separate consideration. Our UK spread betting tax guides examine those questions without treating a marketing phrase as a universal rule.
How the Supply Side Works
The Customer Contract and the Underlying Market
A financial spread bet is a contract with the provider. It is not a purchase of the referenced shares, currency or commodity. The customer receives an economic result determined by the contract’s prices, stake and terms.
Consider a fictional index trade at £2 per point. A favourable 40-point change in the relevant dealing prices produces an £80 gross trading gain. An adverse 40-point change produces an £80 gross loss. Financing and other applicable charges can change the final account result.
The index exposure does not mean the customer owns a small parcel of every constituent company. Nor does it mean a matching customer order has appeared on a stock exchange. These distinctions matter when assessing execution, corporate actions and counterparty exposure.
The name on the app is not enough to identify that counterparty. A study of broker legal entities separates the customer-facing brand, the contracting company and the wider corporate group.
Internal Matching and External Hedging
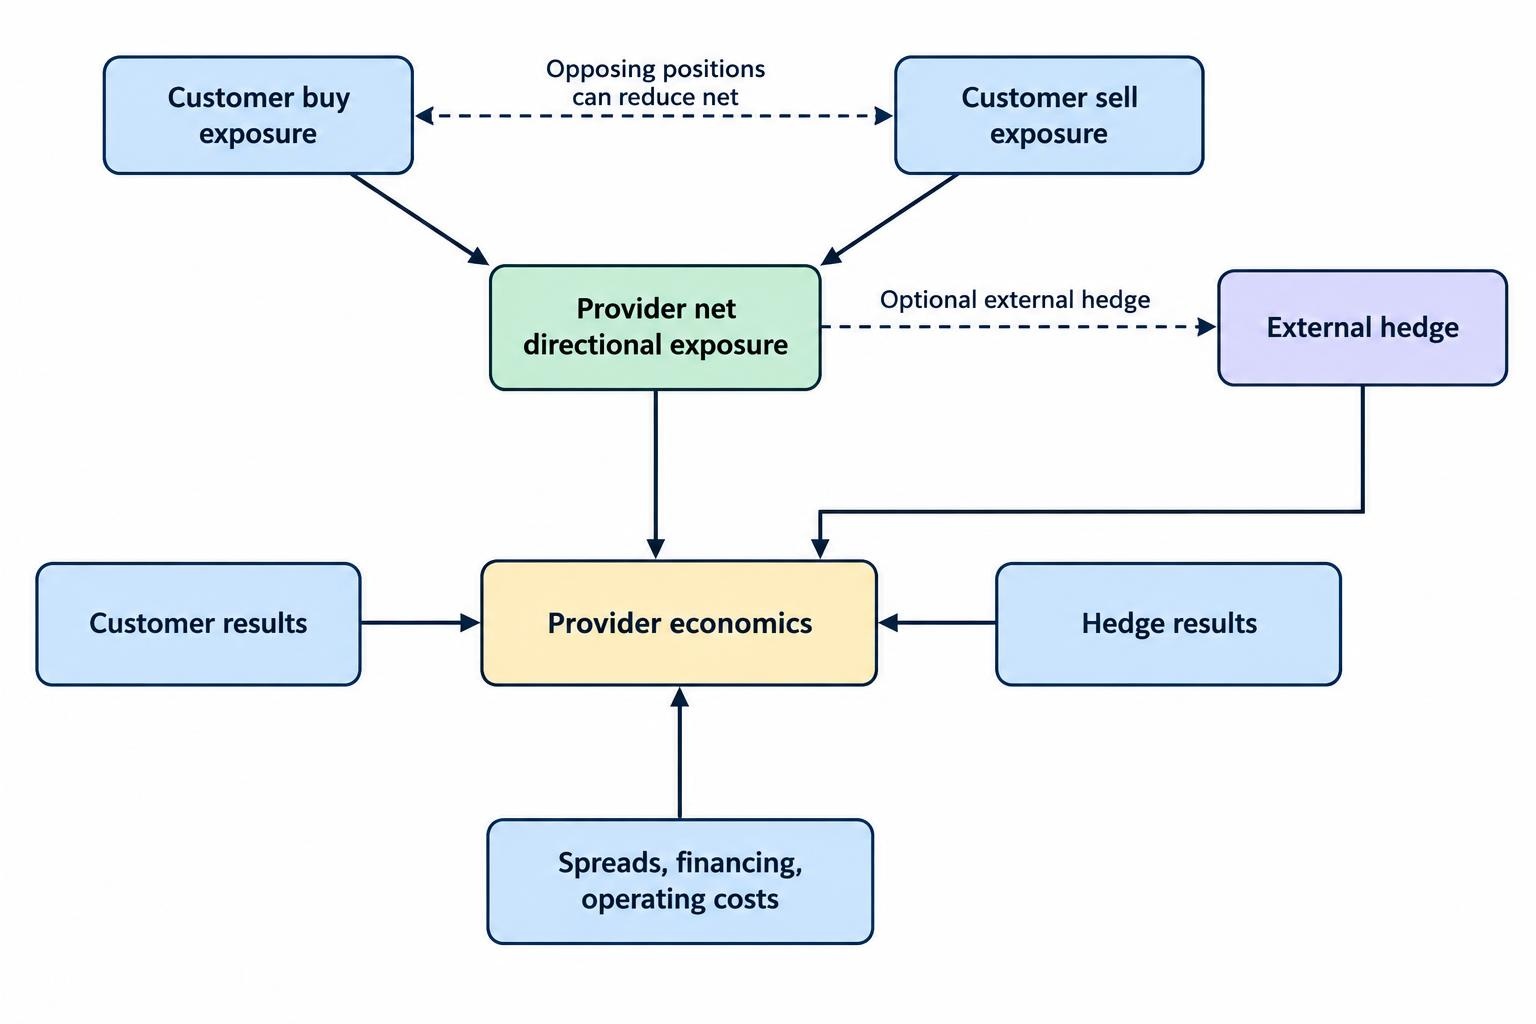
A provider can manage risk by offsetting opposing customer exposures and by hedging externally. These are risk-management choices, not mutually exclusive business identities. Different exposures can receive different treatment.
If one customer buys an index and another sells an equal exposure, the provider’s net directional position can be smaller than its gross customer positions. If customers are heavily positioned in one direction, the provider may choose to hedge some of that net exposure elsewhere.
This explains why the claim that every customer loss becomes provider profit is too crude. Customer results, external hedge results, spreads, financing and operating costs all affect the economics. Equally, external hedging does not remove every conflict or guarantee a favourable customer outcome.
For the customer, the practical questions concern the quoted price, the accepted order, the achieved fill and the contract terms. Our research on broker execution quality addresses those questions separately from market size.
Why Scale Matters Without Proving Quality
Running a trading service involves technology, market data, risk systems, customer support and compliance work. Some costs can be spread across a larger customer base. That creates a possible economic advantage for scale, but not a guarantee of better service.
A large provider can still have an expensive contract for a particular trading style. A smaller provider can still offer suitable terms for a narrow use case. Neither corporate size nor a long instrument list substitutes for examining the actual service.
Distribution also complicates market mapping. A trading interface, an introducing relationship and a risk-taking provider may involve different businesses. Counting customer-facing names without checking the underlying arrangements can exaggerate the number of independent competitors.
Who Uses Financial Spread Betting?
It is more useful to examine possible use cases than to invent a demographic portrait. The examples below describe ways the product can be used; they are not measured shares of UK customers.
Short-Term Directional Trading
A trader may want exposure to a price move during a trading session rather than ownership of an asset. The relevant decision then concerns stake size, entry and exit prices, execution and the risk of an adverse move.
For this use case, a small difference in dealing costs can matter across repeated transactions. Platform reliability and order controls can matter more than the number of markets that will never be traded. The economics differ from holding a position for weeks, as our day trading guide discusses.
Positions Held Across Several Sessions
A trader holding an exposure for days or weeks faces a different cost and risk profile. Overnight financing, market gaps, contract expiry and adjustments become more relevant.
A provider that looks cheaper for a brief trade can be more expensive over a longer holding period. The same person can therefore reach different provider choices for different strategies without either choice being inconsistent.
Temporary Hedging
A share investor might consider a short index exposure to offset part of an existing portfolio’s market sensitivity. The intention would be to reduce a risk rather than to create a standalone bearish speculation.
That does not make the hedge exact. The portfolio and index may move differently, the hedge incurs costs, and the position can lose money while the original holdings rise. A hedge needs an exposure calculation, not just an opposite direction. Our guide to hedging with financial spread bets examines those trade-offs.
Retail and Professional Are Not Descriptions of Skill
For research purposes, client classification should not be used as a shortcut for sophistication or profitability. A person’s confidence, trading frequency or account balance does not establish their results.
Customer segments should instead be defined using observable measures relevant to the question: trading frequency, holding period, products used, account funding or formal classification. Mixing those categories creates attractive labels and weak analysis.
The Markets Offered and the Exposures Customers Receive
A provider’s market catalogue describes what can be traded. It does not establish where customer activity is concentrated. A thousand rarely used instruments should not carry the same analytical weight as a handful that account for most of a hypothetical customer’s trades.
Indices and Shares
Index exposure combines the price movements of a group of constituents into one reference level. It avoids selecting a single company, but it does not remove market risk. An index can move sharply, and its composition determines the exposure it represents.
For a provider comparison, the useful questions concern the particular index contract: dealing hours, point value, funding method, expiry and treatment outside the underlying market’s main session. Our index spread betting guides cover those product-level differences.
Individual share contracts introduce company-level events. Earnings releases, takeovers, dividend changes and trading suspensions can affect the reference price or the terms under which a position can be managed. A broad share catalogue is useful only if it includes the required companies on workable terms.
Foreign Exchange and Commodities
Foreign exchange exposure concerns the relationship between two currencies. A position described as “buying sterling” is incomplete without identifying the other currency. Position sizing also depends on the provider’s point convention, not simply the number of decimals on a chart.
Within forex spread betting, market comparisons should preserve the currency pair and contract definition. A quoted spread on one pair cannot stand in for the cost of trading every pair.
Commodity contracts require similar care. A cash-style reference, a futures-based reference and contracts with different expiries need not have identical prices or holding costs. Counting them as interchangeable instruments can distort both coverage and cost comparisons.
The relevant research question is therefore not “How many markets are listed?” It is “Does the provider offer the required exposure, at the required size and time, under terms the customer can assess?” Our market coverage research uses that narrower approach.
Where Providers Compete on Price
The Advertised Spread Is Only a Starting Point
A quoted minimum spread is a price available under stated conditions. It is not automatically the average cost achieved by a customer across different times, market conditions and order sizes.
Even an accurately advertised spread leaves other questions unanswered. How long is the position held? Does it incur financing? Is a guaranteed stop selected? Is there a currency conversion? Does the achieved execution price differ from the price expected when the order was sent?
The appropriate comparison is a defined trade or strategy, not a collection of the smallest numbers from separate fee pages. Our total spread betting cost comparison sets out that approach.
An Illustrative Comparison: Brief Trades Versus Longer Holdings
The following figures are fictional. They are not quotes from providers and should not be read as current market rates. They show how holding period can change a cost comparison.
Assume Provider A quotes a one-point spread and Provider B quotes a 1.5-point spread. At £2 per point, the spread cost for one round trip is £2 and £3 respectively, assuming unchanged spreads and no underlying price movement.
For the longer holding example, assume a constant £10,000 reference exposure, one round trip, 30 chargeable days, and simple financing at 7% a year for A and 5% for B using a 365-day basis. Ignore all other charges and adjustments.
| Cost measure | Provider A | Provider B |
|---|---|---|
| Spread at £2 per point | £2 per round trip | £3 per round trip |
| Twenty round trips with no overnight holding | £40 | £60 |
| Assumed annual financing rate | 7% | 5% |
| Financing on £10,000 for 30 days | £57.53 | £41.10 |
| One round trip plus the assumed financing | £59.53 | £44.10 |
Under these assumptions, A is cheaper for repeated trades closed before overnight charges arise. B is cheaper for the single position held for 30 chargeable days. The narrower spread does not win both comparisons.
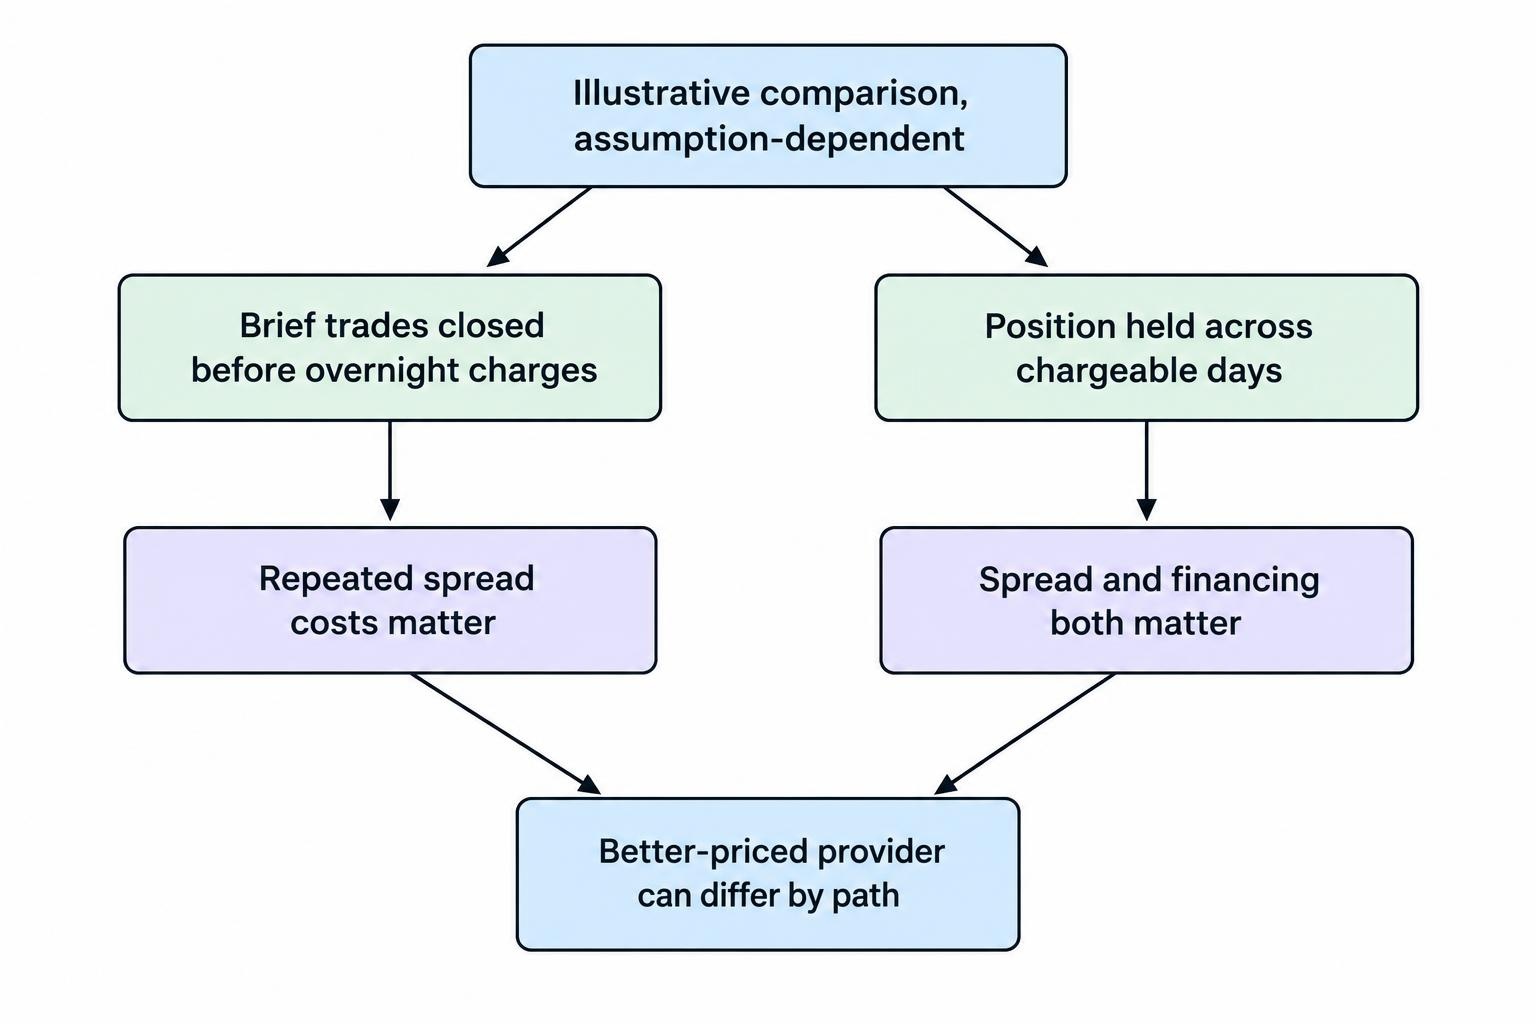
Real calculations must use the contract’s charging basis, changing exposure where relevant, and actual chargeable days. A trade held for 30 calendar days should not automatically be assigned 30 identical charges without checking the terms. Our overnight financing guide covers the mechanics.
Measuring Typical Prices Fairly
A useful price study records comparable contracts at comparable times. It should distinguish normal sessions from thin trading periods, scheduled announcements from quieter intervals, and displayed quotes from achieved fills.
Averages need context too. A time-weighted average spread answers a different question from an average weighted by customer trades. If customers trade most during volatile periods, a quiet-hours average may poorly describe their experience.
The broker spread study is the appropriate place for measured quote comparisons. This market overview does not substitute invented observations for a dataset.
How Retail Rules Shape the Market
Retail rules affect the exposure firms can offer and the information customers receive. FCA COBS 22.5 sets minimum opening margins, including 3.33% for major currency pairs and relevant sovereign debt, 5% for major stock indices, minor currency pairs and gold, 10% for other commodities and minor stock indices, and 20% for shares and other covered assets.
The same section requires positions to be closed as soon as market conditions allow when account net equity falls below 50% of the required maintenance margin. It restricts liability for the covered investments to funds dedicated to them in the account. Provider loss percentages must be recalculated every three months using the preceding twelve months, including costs and charges: FCA rules for retail speculative investments.
These provisions set boundaries; they do not make trading low risk. An account can suffer substantial losses within those boundaries. Nor should a margin close-out threshold be treated as a carefully chosen exit for an individual trade.
From a competition perspective, a provider comparison should not reward a proposition simply because it appears to allow a larger position for less cash. The customer must first establish the applicable entity, classification and terms. Our guide to retail client protections examines those distinctions.
Why Loss Percentages Are Not a Market League Table
A provider’s disclosed loss percentage concerns accounts under a defined calculation. It does not identify the amount lost by each account, the trading strategy used, or the customer’s results elsewhere.
Consider two fictional firms, each with 100 relevant accounts. At one, 60 accounts lose small amounts. At the other, 55 lose much larger amounts. The second firm has a lower percentage of losing accounts, but that statistic alone does not establish better financial outcomes.
Customer mix also prevents a simple causal interpretation. Different account sizes, instruments, holding periods and trading behaviour can contribute to different results. A lower reported loss percentage does not prove that the platform caused the difference.
Nor should provider percentages be averaged without their account counts. A firm with 1,000 accounts and a firm with 100,000 accounts cannot receive equal weight in an account-weighted market estimate. Even a weighted calculation would still need consistent periods and a treatment of customers using multiple firms.
Our research on retail client loss rates examines that evidence separately. The useful message here is that the denominator matters as much as the percentage.
What Can Drive Trading Activity and Revenue?
Price Movement Creates Opportunities and Operational Demands
Changes in volatility can affect the reasons to trade, the costs of execution and the difficulty of managing positions. More movement creates a larger range of possible outcomes, not a promise of more profitable customers.
A busy period can produce more transactions while also producing wider spreads or poorer fills. Customer activity may rise at the same time that the cost per transaction rises. Those are separate effects and should be measured separately.
Volatility can also change the capital required to maintain a chosen exposure under the provider’s terms. A customer who sized a position around a quiet market may face a different practical risk when prices become less orderly. Our margin risk guide covers the account consequences.
For market analysis, this means a revenue increase during an eventful period should not automatically be interpreted as lasting customer growth. The follow-up question is whether customers, balances and activity remain after conditions change.
Interest Rates Affect More Than One Side of the Business
Interest rates can influence the cost of maintaining exposure and the income associated with cash balances. Those effects need not move together for the customer.
A customer holding a financed position should examine the reference rate, the provider’s adjustment and the charging base. Looking only at the central bank rate cannot establish the actual charge. Looking only at a daily cash amount can also make comparisons awkward when position sizes differ.
A research series should therefore separate changes in the reference rate from changes in the provider’s pricing adjustment. It should also preserve the holding period and trade direction. Our overnight financing study addresses that comparison rather than treating every rate change as a change in provider margin.
Growth Can Come From Activity, Pricing or Customer Mix
Revenue can be analysed through several moving parts: the number of active customers, how often they trade, their exposure, the products used and the income retained from that activity. A change in any one can move the headline result.
Suppose a fictional provider’s customer count falls by 5%, while revenue rises by 10%. That is not automatically evidence of deterioration or improvement. Remaining customers may trade more, prices may have changed, or higher-revenue products may account for a larger share.
The appropriate next step is to inspect the components, not choose the interpretation that best fits a preferred story. Customer acquisition, retention, activity and pricing should each have their own measure.
Technology, Access and the Cost of Switching
Technology belongs in a market study because it affects how customers place orders and how easily they can move elsewhere. The relevant comparison is practical functionality, not the number of features on a product page.
A trader may depend on chart layouts, alerts, order controls, account reporting or a familiar workflow. Moving provider can require rebuilding that setup, checking contract conventions and learning how the new platform handles amendments and position closures.
That creates a switching cost even where no transfer fee exists. Time spent checking settings and adapting a process has value. It can explain why a small price difference does not automatically produce a change of provider.
Reliability Needs a Defined Measure
A platform availability percentage is useful only with its scope. Does it cover login, price display, order submission or the full path to execution? Does it exclude planned maintenance? Is the measure group-wide or product-specific?
The same discipline applies to execution speed. A median can conceal a small number of long delays, while a fast response can still be an order rejection. A meaningful study records both successful and unsuccessful attempts under stated conditions.
No such testing is claimed here. A market overview should identify the measurements needed without pretending that reviewing marketing material amounts to testing a platform.
More Access Does Not Require More Trading
Convenient access can reduce the effort needed to manage an existing position. It can also reduce the pause between an impulse and a new trade. Those are different uses of the same interface.
For an individual customer, the useful test is whether a feature improves the planned process. For a researcher, the question is whether a claimed improvement can be linked to observable outcomes rather than screen design alone.
How to Assess Competition Without Inventing Market Shares
A competitive market assessment can be useful even when a complete revenue denominator is unavailable. It should compare the service that customers can actually obtain and state where the evidence ends.
Market shares require a consistent numerator and denominator. Dividing one firm’s global derivatives revenue by an estimate of domestic spread betting revenue does not produce a meaningful share. Neither does dividing its survey mentions by the total number of respondents if respondents can name several providers.
Start With a Defined Customer Requirement
A brief should specify the required instrument, likely stake, usual trading time, expected holding period and order controls. Without that brief, a provider comparison risks answering a question no actual customer asked.
A trader opening small index positions during the main session has different needs from someone holding individual share exposure through earnings. The best fit cannot be inferred from a general popularity ranking.
Our spread betting broker coverage provides a route into provider research. Any selection should still be checked against current contract terms rather than treated as permanent.
Use a Consistent Evidence File
A manageable market-monitoring file should preserve five items:
- Scope: the product, customer geography, entity and reporting period.
- Participation: the activity definition and whether the count concerns accounts or people.
- Economics: comparable revenue definitions and a realistic trading-cost scenario.
- Service: contract availability, execution evidence, order controls and operational restrictions.
- Change: the date of each observation and any revision to the underlying definition.
Definitions should be stored alongside figures, not in a separate document that disappears when a chart is copied. A figure without its scope is too easy to reuse incorrectly.
For legal identity checks, use the contracting firm rather than relying on a familiar trading name. Our guide to checking a broker on the FCA Register sets out that verification process.
Compare Risk Controls on Their Terms
Risk controls should be examined as contract features, not decorative checkboxes. Availability, eligible markets, minimum distances, amendment conditions and charges can affect their usefulness.
A guaranteed stop comparison, for example, needs to assess the conditions attached to the guarantee rather than assuming every provider offers an identical arrangement. Our guaranteed stop comparison keeps that product question separate from general provider size.
The same restraint applies to ratings. If a study does not measure withdrawals, outages or achieved execution, it should not award confident scores for those outcomes.
What Would Demonstrate a Better-Functioning Market?
A larger market is not necessarily a better market. More accounts, transactions or provider revenue can coexist with poor customer outcomes. Market quality needs its own tests.
Clearer price information would allow customers to estimate the cost of their intended holding period before opening a position. Comparable reporting would make it easier to distinguish customer growth from acquisitions or changes in definitions. Better execution evidence would help separate attractive displayed quotes from the prices customers achieve.
Research would also benefit from clearer product splits. A consistent series for UK spread betting revenue, active accounts and customer residence would answer questions that broad derivatives disclosures cannot. Any person-level estimate would still need a method for handling multiple accounts.
These are measurement goals, not claims that the necessary data already exist in a complete public series. Until they do, carefully labelled partial evidence is more useful than a false total.
The Market Outlook: What to Watch Next
The direction of UK spread betting cannot be reduced to one forecast for customer numbers or revenue. A useful outlook tracks separate questions: whether providers attract and retain suitable customers, whether pricing becomes easier to compare, and whether trading services remain workable during difficult market conditions.
Watch the difference between changes in presentation and changes in economics. A clearer fee page is progress in disclosure. A lower cost for the same trade is a pricing change. Evidence of better customer decisions or outcomes is a further question again.
Also watch the boundaries of company reporting. Expansion into investing, institutional services or other products can strengthen a group without demonstrating growth in UK spread betting. A larger corporate result should prompt a closer reading of the product split, not an automatic upgrade to a domestic market estimate.
For traders, the practical response is more concrete than a sector forecast: identify the contracting entity, define the intended exposure, calculate realistic costs and assess the conditions under which a position can be closed. Provider scale and brand familiarity can inform that work, but neither completes it.
The UK spread betting market is best assessed as a set of contracts, firms and customer behaviours, not as one impressive headline number. Where the evidence is broad, label it broad. Where it is incomplete, leave the gap visible. Precision is useful only when the figures deserve it.