Average True Range, usually shortened to ATR, is a technical indicator that measures the size of recent price ranges, including gaps relative to the previous close. Spread bettors use it to assess market conditions, compare proposed stop distances with recent movement and calculate stakes around a defined risk budget. It can also support trailing stops, entry filters and decisions about whether a potential move is large enough to justify trading costs. ATR does not indicate whether to buy or sell. A rising reading can accompany either an advance or a decline, so an ATR spread betting method needs a separate reason for choosing the direction of a trade.
This guide explains the calculation, practical uses, suitable trading styles and limitations of ATR, with examples showing both profitable and losing outcomes. All market prices, stakes and charges are hypothetical. They illustrate the mechanics rather than establish that a particular strategy is profitable. The Financial Conduct Authority includes financial spread bets within its coverage of contracts for difference, which it describes as high-risk products unsuitable for some retail consumers. Using a volatility indicator does not remove that risk. A planned loss calculated from ATR remains an estimate based on specified execution assumptions, especially when the position relies on an ordinary stop that can fill beyond its requested price.
What does ATR measure?
ATR is a smoothed average of true range, a measure that considers each bar’s high, low and the previous bar’s closing price. It is commonly described as a volatility indicator, but it is not the same calculation as the standard deviation of returns. Its result is expressed in price units: index points for an index chart, the quoted currency unit for a share chart, or decimal exchange-rate units for a forex chart. The TradingView ATR documentation explains its non-directional construction. Before applying the reading to a spread bet, translate those chart units into the contract’s actual point size and confirm what a movement of one point means for the selected stake.
A higher ATR means the smoothed true range is larger, not that the market is more likely to rise. A lower ATR means that measure has declined, not that a large move has become impossible. A relatively orderly trend can continue while ATR falls, and sharp alternating advances and declines can lift ATR without producing a useful directional trend. The indicator also does not measure the total distance price travels through repeated movements within a candle. Two bars with the same high, low and previous close can have the same true range despite very different sequences of trading inside them. ATR is a summary of selected price information rather than a complete description of market behaviour.
How true range is calculated
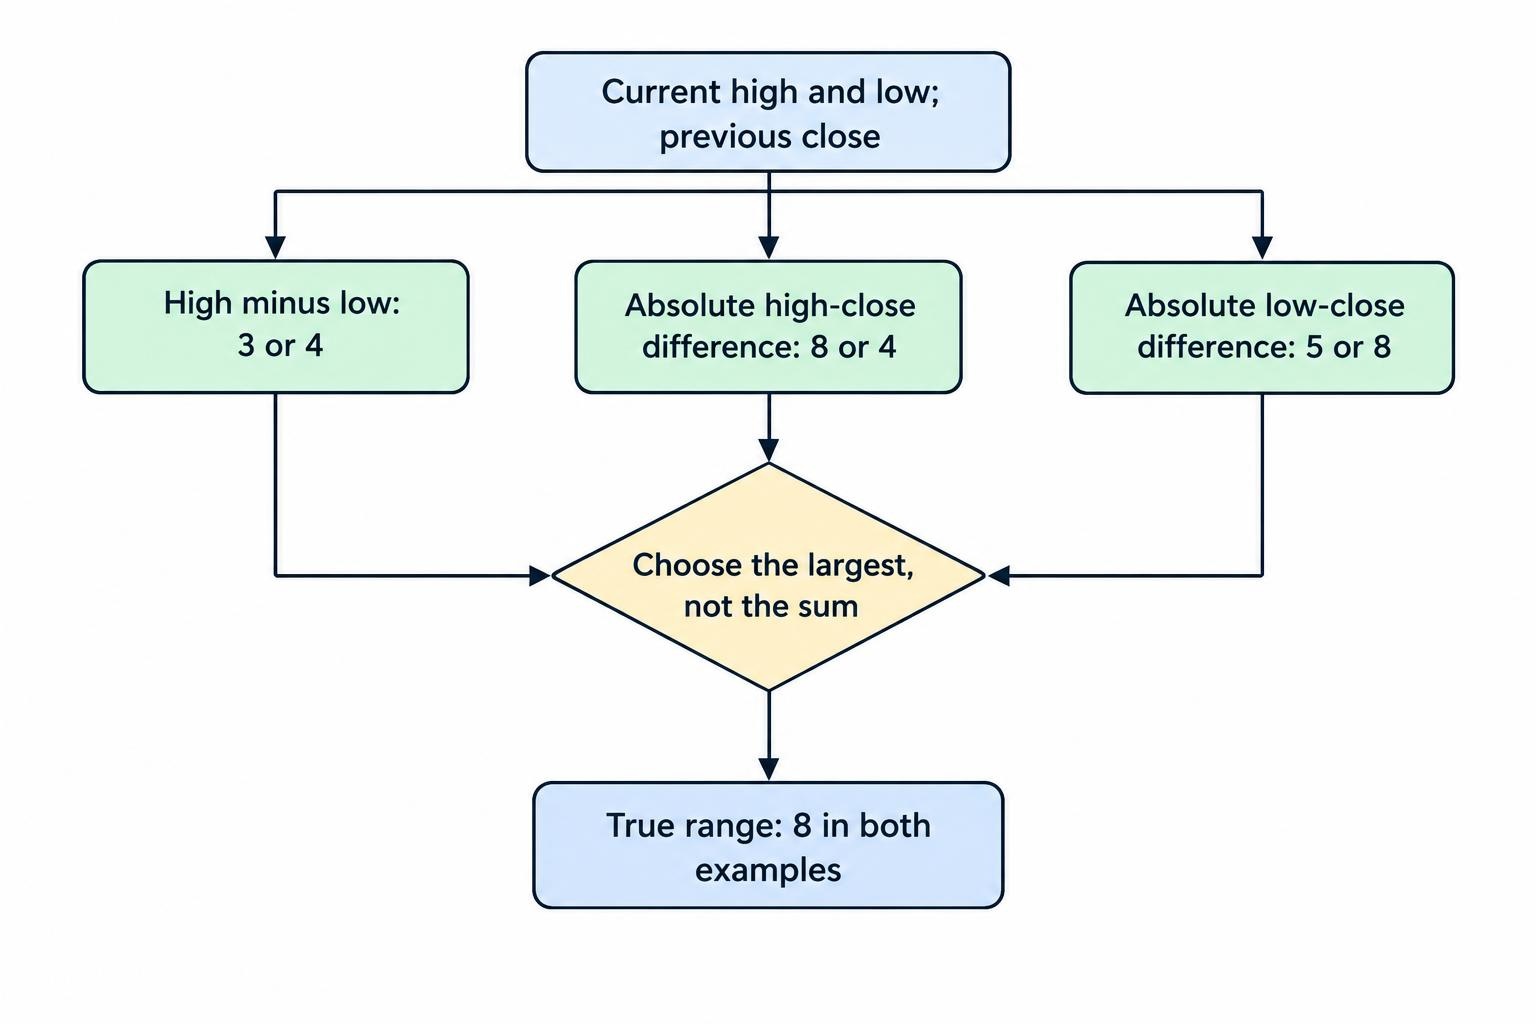
True range is the largest of three distances: current high minus current low, the absolute difference between current high and previous close, and the absolute difference between current low and previous close. Only the largest distance is used; the three figures are not added together. Suppose the previous close is 100 and the next bar trades between 99 and 103. The three distances are four, three and one, so true range is four. If the next bar instead trades entirely above the previous close, between 105 and 108, true range is eight. Its own high-to-low range is only three, but the calculation also captures the separation from the previous close.
The same treatment applies to a downward gap. With a previous close of 100 and a current high of 96 and low of 92, the three distances are four, four and eight, giving a true range of eight. These examples show why true range can exceed a candle’s visible high-to-low range. They also show why an ordinary daily range and daily true range are not interchangeable. A gap can form part of the measured movement even though no trading occurred at the intervening prices. That observation matters for spread betting because an order cannot necessarily execute at every price between the previous close and the next available quote.
| Example | Previous close | Current high | Current low | High minus low | True range |
|---|---|---|---|---|---|
| Previous close lies within the bar | 100 | 103 | 99 | 4 | 4 |
| Bar trades above the previous close | 100 | 108 | 105 | 3 | 8 |
| Bar trades below the previous close | 100 | 96 | 92 | 4 | 8 |
From true range to a 14-period ATR
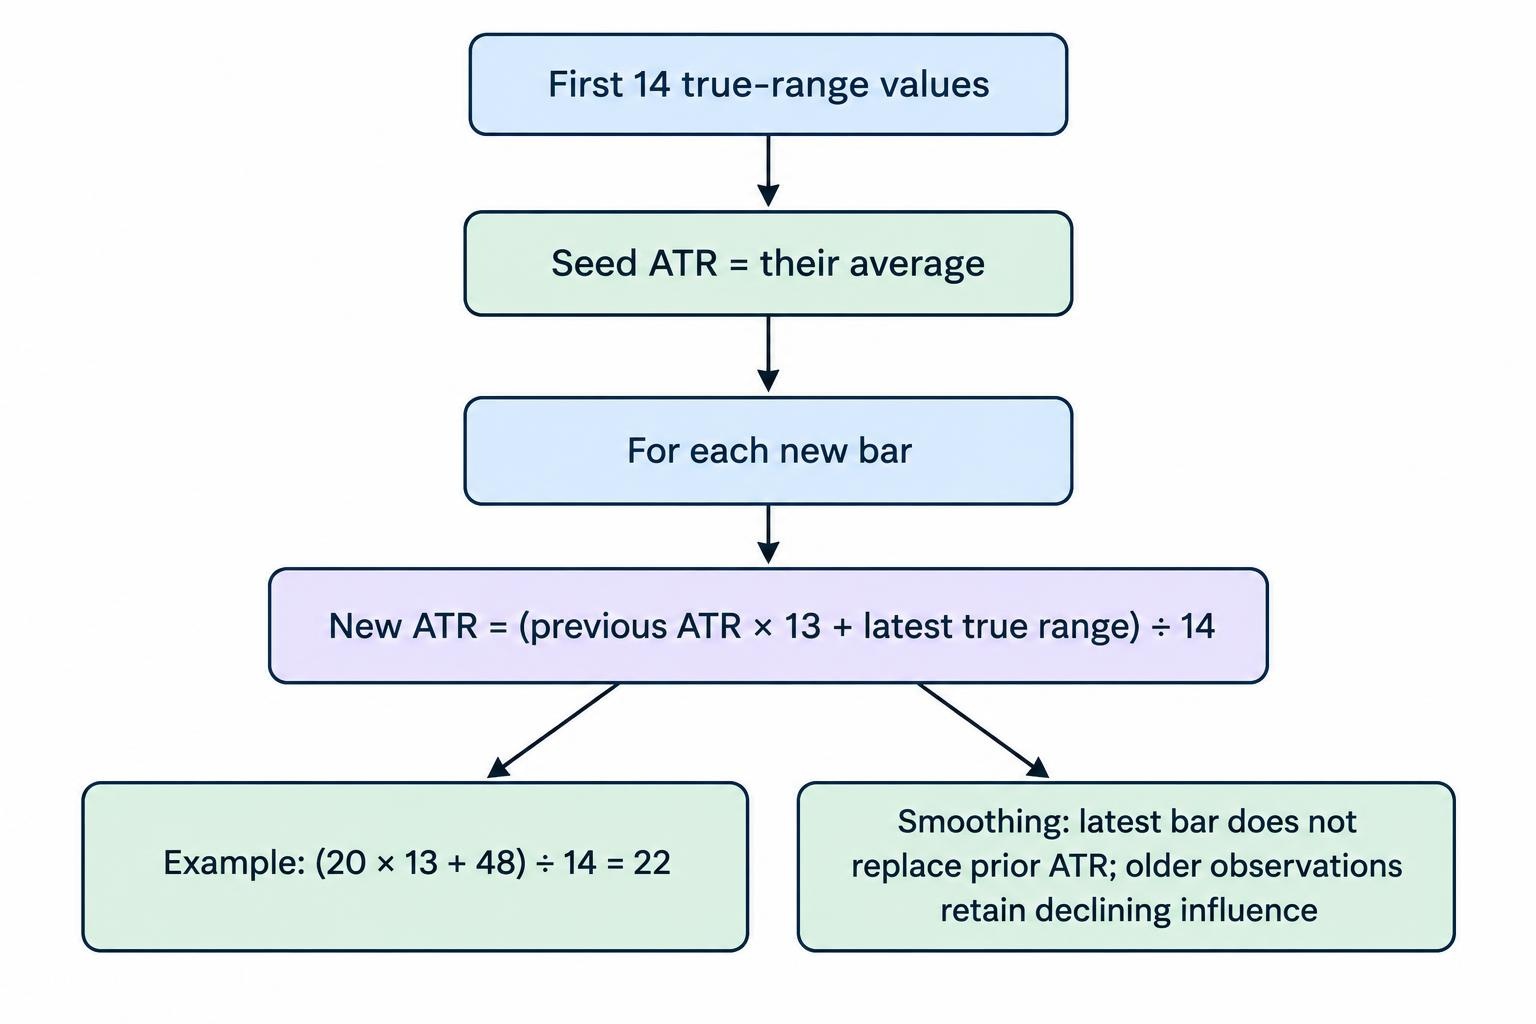
Wilder’s conventional ATR uses 14 periods. An initial value can be seeded with the average of the first 14 true ranges, followed by new ATR = (previous ATR × 13 + latest true range) ÷ 14. The StockCharts ATR documentation sets out this method. When no preceding close is available for the first bar, an implementation may initialise its true range using that bar’s high minus low. Once the smoothed update begins, older observations retain a declining influence rather than dropping out completely after 14 bars. A 14-period Wilder ATR therefore differs from a simple moving average of the latest 14 ranges and from a conventional 14-period EMA.
For example, suppose the previous ATR is 20 points and the latest true range is 48 points. The updated value is (20 × 13 + 48) ÷ 14, or 22 points. The new bar was much larger than the old average, but smoothing means ATR increases by only two points immediately. This explains a practical limitation around sudden announcements: the market can become more volatile before the indicator fully reflects the change. Software may offer different smoothing methods, and initialisation or rounding can also affect readings. Record the method as well as the period length when comparing platforms or testing a strategy. Matching the number 14 alone does not establish that the calculations match.
ATR settings, timeframes and the meaning of “average”
A 14-period ATR refers to 14 chart periods, not automatically to 14 days. On a five-minute chart it averages five-minute true ranges through the selected smoothing method; on a daily chart it uses daily true ranges. A daily value should not simply be divided by the number of trading hours to estimate an hourly value, because the underlying bar ranges and gaps do not combine that way. Shorter settings generally respond faster to changing ranges, while longer settings respond more slowly. Neither is automatically better. Choose the timeframe and smoothing to match the trading process, then test whether the resulting decisions remain practical under the intended entry, exit and monitoring schedule.
ATR is an average of historical measurements, not the market’s remaining allowance for movement. If daily ATR is 100 points and today’s range has already reached 80, it does not follow that only 20 points remain available. The day can exceed its recent average substantially. Nor does a two-ATR stop establish a particular probability of avoiding a stop-out: ATR is not a standard deviation, and the future distribution of adverse movement has not been specified. A one-ATR target is simply a price distance chosen using the indicator. Whether that target is reached before the stop depends on the entry, direction, subsequent path and execution, none of which the ATR number determines by itself.
ATR percentage: comparing markets more meaningfully
Raw ATR values cannot establish relative volatility across instruments with different price scales. A common normalisation is ATR percentage = ATR ÷ closing price × 100, described in the StockCharts ATR percentage documentation. An instrument priced at 2,500 with ATR of 25 has an ATR percentage of 1%. Another priced at 10,000 with ATR of 80 has a reading of 0.8%, despite its larger absolute range. Use matching timeframes and calculation methods when making this comparison. Percentage normalisation also becomes unsuitable or unstable when the reference price is zero or close to it. It does not make instruments with different trading hours and gap exposure equivalent.
For a spread bettor, percentage range is only one part of the comparison. The actual stake per point determines the cash effect of movement, while margin, dealing spread, funding and contract specifications determine other costs and constraints. A market with a lower ATR percentage can still create a larger account loss if its position size is much greater. Conversely, a market with a higher percentage reading can be traded at a smaller stake, where contract minimums permit. Compare the planned loss and total exposure alongside the indicator. The objective is to understand the consequences of the proposed position, rather than ranking instruments by one number and assuming that the lowest reading identifies the safest trade.
Using ATR to choose a stop distance
A common educational approach sets an initial stop distance as a multiple of ATR. With ATR at 25 index points, a two-ATR distance is 50 points; a three-ATR distance is 75 points. Those distances adapt to the measured range, but neither multiplier is universally appropriate. A stop should also relate to what would invalidate the trade. If an upward-trend setup fails below a particular support area, a mechanical two-ATR stop that sits above that area may end the trade before testing the intended idea. Compare both the price structure and the recent range. Our guides to support and resistance and stop losses explain those complementary decisions.
An alternative is to place the stop beyond a price level with an ATR-based buffer. Suppose support is at 10,950, ATR is 20 points and an illustrative rule adds half an ATR below support. The stop reference becomes 10,940. If the actual long entry is 10,982, the relevant distance for position sizing is 42 points, not the ten-point buffer. The entry, support level and buffer are separate parts of the calculation. Check whether the chart uses the same price side as the stop trigger and whether the contract permits the proposed order distance. A neatly calculated buffer is not useful if it is measured from the wrong reference or cannot be placed as intended.
Position sizing from an ATR-based stop
Once the actual entry-to-stop distance is known, an illustrative stake calculation is price-risk budget ÷ stop distance = stake per point. With a £25 price-risk budget and a 50-point stop, the stake is £0.50 per point. If £3 of expected funding must fit inside the same budget, only £22 remains for the planned price loss, implying £0.44 per point before considering other costs or slippage. Where a permitted stake increment requires rounding, rounding down preserves the intended budget more closely. Minimum stakes may make the position impractical. The position sizing guide explains why having a valid chart setup does not mean the contract can be traded at an acceptable size.
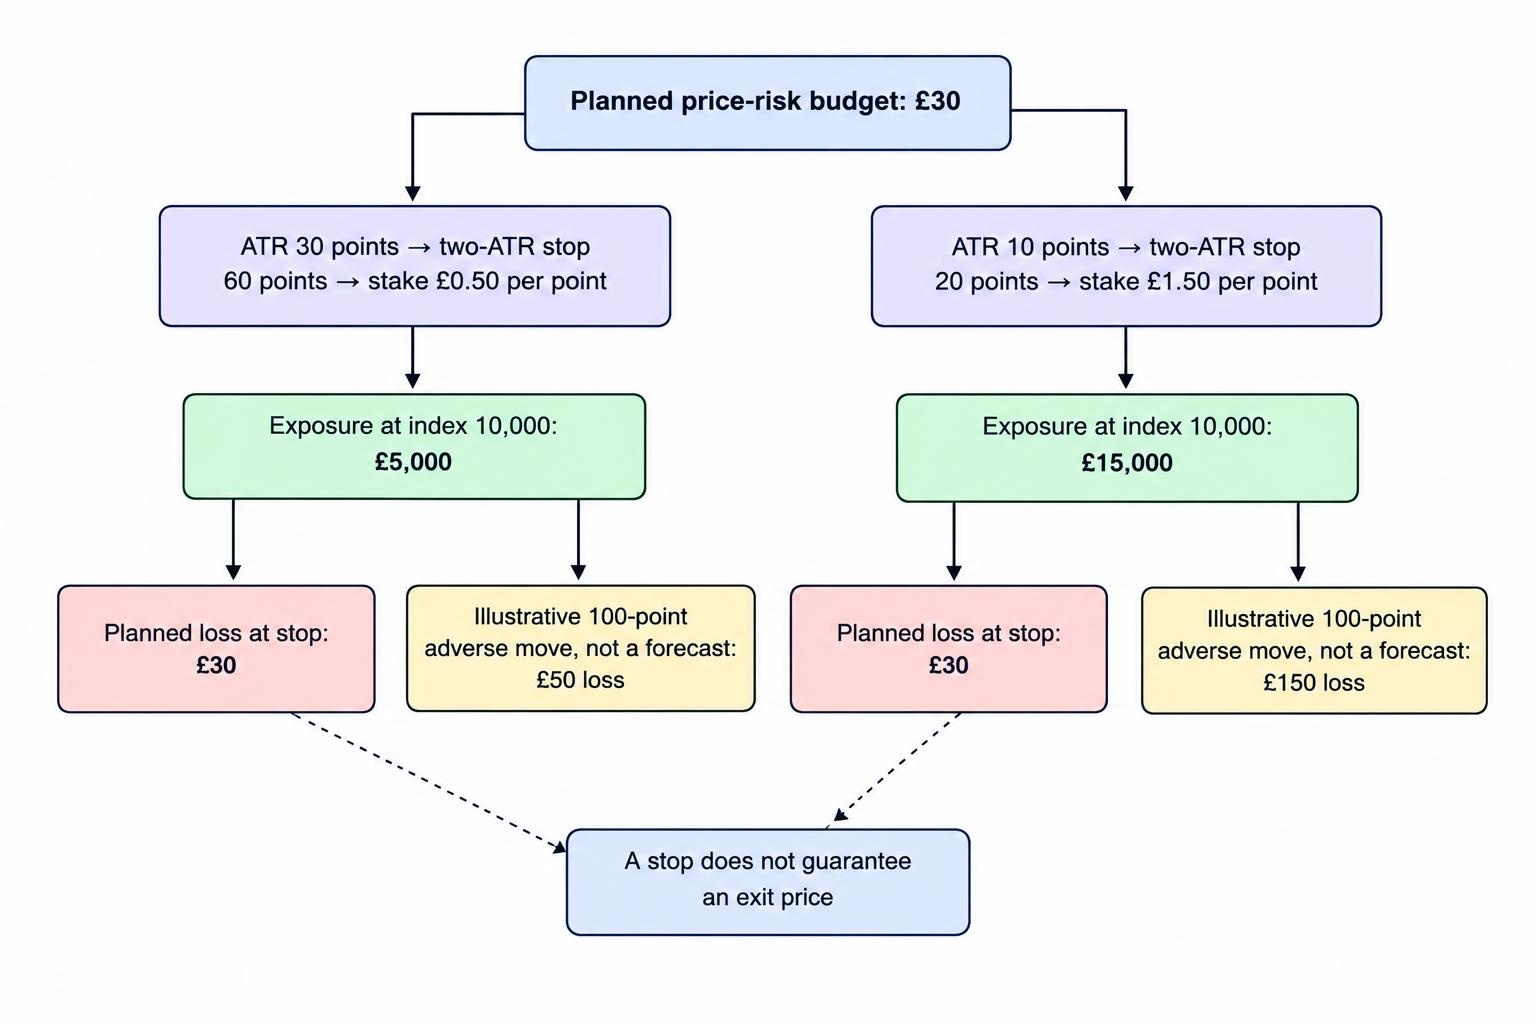
ATR-based sizing can reduce the stake when the selected stop distance grows, but low readings can produce the opposite problem. Assume a hypothetical index price of 10,000, a £30 price-risk budget and a two-ATR stop. ATR of 30 implies a 60-point stop and £0.50 per point. ATR of 10 implies a 20-point stop and £1.50 per point. Both produce a planned £30 price loss at their stop levels, yet the second position has three times the exposure. A sudden 100-point adverse gap would produce a £150 price loss at the larger stake versus £50 at the smaller one, assuming fills at that distance. Equal planned stop risk does not imply equal gap risk.
| ATR at entry | Two-ATR stop distance | Stake for £30 planned price risk | Exposure at an index price of 10,000 | Price loss on a 100-point adverse move |
|---|---|---|---|---|
| 30 points | 60 points | £0.50 per point | £5,000 | £50 |
| 10 points | 20 points | £1.50 per point | £15,000 | £150 |
This is why an ATR sizing rule needs additional limits on stake, notional exposure, margin usage and combined account risk. An unusually quiet period before an announcement is not a reason to allow position size to grow without a cap. The indicator cannot include the size of a future surprise before it appears in the data. Consider what happens if several related positions gap together as well. Equalising their individual planned stop losses does not remove correlation between them. Our guides to leverage risk, gap risk and portfolio correlation address risks that a historical range calculation cannot contain on its own, regardless of how consistently the formula is applied.
Practical example: a long index trade with an ATR stop
Assume a hypothetical index has pulled back within an upward price trend and then broken above a minor resistance level. That price setup supplies the reason to consider buying; ATR supplies a reference for the stop distance. The latest completed hourly ATR is 25 points. With a quote of 11,000 to sell and 11,002 to buy, a trader buys at 11,002 for £0.50 per point. A two-ATR stop is placed at 10,952, which is 50 points below entry and represents £25 of planned price risk. A fixed target sell price of 11,102 offers a possible 100-point gain, worth £50 before separate charges. The setup is hypothetical, not a tested recommendation.
The spread is already reflected by using the actual buy entry and executable sell exits. Immediately closing at the unchanged sell quote of 11,000 would lose £1. Assume £3 of funding over the holding period and no other separate charges. Closing at 11,102 produces £47 net profit, while closing early at 11,012 produces £2 after funding. An exit at the original entry price produces a £3 loss, so cash break-even requires an executable sell price of 11,008. The same funding charge is used below to isolate the effect of exit price; real funding changes with the product and holding period. These outcomes do not assign a probability to the target, stop or gap scenario.
| Outcome | Executable sell exit | Price profit or loss | Assumed funding | Net result |
|---|---|---|---|---|
| Fixed target reached | 11,102 | £50 | £3 | £47 |
| Small favourable exit | 11,012 | £5 | £3 | £2 |
| Exit at the entry price | 11,002 | £0 | £3 | −£3 |
| Ordinary stop fills as planned | 10,952 | −£25 | £3 | −£28 |
| Gap through the stop | 10,902 | −£50 | £3 | −£53 |
The last outcome illustrates the distinction between a stop distance and a guaranteed loss limit. An ordinary stop can fill beyond its requested price when the market gaps or moves rapidly through available quotes. A two-ATR distance does not prevent that, and an ATR increase after the event does not undo the cash loss. A guaranteed stop, where offered and subject to its terms, can provide protection at the specified stop price, but its charge and restrictions must be incorporated into the method. The guaranteed stops guide explains that contractual distinction. Never treat the number of ATR units separating entry and stop as a substitute for understanding how the exit order actually works.
Practical example: a short forex position
Suppose EUR/USD is declining and a rally fails near resistance. An illustrative entry rule requires a completed price break below the rally’s latest minor support. Hourly ATR is 0.0020, equivalent to 20 pips when one pip is 0.0001. The quote is 1.1020 to sell and 1.1022 to buy. A trader sells at 1.1020 for £0.50 per pip and uses a two-ATR stop distance of 40 pips, placing the buy-side stop at 1.1060. The planned price loss is £20. A target buy price of 1.0940 is 80 pips below entry, offering £40 of potential price profit. ATR helps define scale; the price setup supplies the direction and entry condition.
If the target is reached and funding costs £2, the net profit is £38. A smaller exit at a buy price of 1.1010 produces a ten-pip gain worth £5, leaving £3 after funding. A stop fill at 1.1060 produces a £22 net loss, while a gap to an executable buy price of 1.1100 produces a £42 net loss. Confirm whether the provider’s quoted point is a pip or a smaller increment before entering the stake. Also check whether an ATR displayed as 0.0020 has already been converted by the platform to 20 pips. A unit error can multiply the intended exposure, and a short trade does not automatically receive a financing credit.
ATR trailing stops and changing volatility
A trailing method can update a stop as a trade moves favourably, using ATR to determine a reference distance. One illustrative long rule uses the highest price recorded since entry minus three ATRs. Suppose that high reaches 11,120 and ATR is 30 points: the candidate stop is 11,030. Later, the high reaches 11,160 and ATR is 35, producing a candidate of 11,055. Under a rule that never loosens the stop, the protective level can rise from 11,030 to 11,055. The method must specify which chart price forms the high, when ATR is sampled, when orders are updated and whether a completed bar is required. Those details change the available executions.
If ATR then rises to 50 while the highest price remains 11,160, the raw formula produces a lower candidate of 11,010. A trailing rule that never loosens protection retains 11,055 instead. For a short position, the corresponding logic places a candidate above a defined low and prevents the stop from moving upwards once tightened. This is only one possible design; a rolling-window high or a closing-price anchor creates a different method. In testing, do not use the final high and low of a candle to assume that a newly calculated stop was already active earlier inside it. The order of price events and the timing of the update affect the result.
ATR targets, entry filters and trading conditions
ATR can express a target distance in units of recent range, such as a two-ATR stop and four-ATR target. That produces a planned two-to-one ratio of price reward to risk if both distances are measured from the executable entry. It does not establish a profitable expectancy, because target frequency, stop frequency, early exits, costs and gaps still matter. Specify whether the ATR reading is fixed at entry or recalculated. Updating a target whenever ATR rises can move it further away after the position is opened; updating a stop can also increase exposure to loss. These are changes to the trade-management rules, not harmless adjustments that automatically preserve the original risk–reward relationship.
As an entry filter, ATR might exclude conditions where recent ranges are too small relative to trading costs or too large for the permitted stop and stake. A breakout trading method could also compare the breakout bar’s true range with an earlier ATR reading, using a rule defined before the bar occurs. State the reference carefully: comparing against the previous completed ATR differs from using an ATR that already includes the breakout. Increased range does not prove that the break will continue, while low ATR does not forecast its direction. Treat these filters as hypotheses to test alongside the unfiltered method, rather than assuming that a volatility condition necessarily improves the quality of every remaining signal.
Margin and account risk remain separate calculations
In the long index example, 11,002 multiplied by £0.50 per point gives approximately £5,501 of exposure. At an assumed 5% initial margin requirement, the deposit needed to open the position is £275.05. That differs from the planned £25 price loss and is not a maximum-loss figure. The FCA’s retail CFD rules set a 5% minimum initial margin for major stock indices, with different minimums for other underlying categories; firms can require more. Use the actual contract terms. An ATR-based stake that fits the planned stop budget can still use too much margin or leave insufficient account funds to withstand adverse movements across several positions.
The same FCA rules require account-level closeout when net equity falls below 50% of required margin, as soon as market conditions allow. Negative balance protection for covered retail accounts limits liability to funds in the relevant account, but does not prevent those deposited funds from being lost or guarantee an individual stop price. Account closeout may end a position before its ATR-based exit is reached. Monitor account equity, open losses and margin commitments alongside the indicator. A calculation focused only on the intended trade-level loss can miss the account-level condition that actually forces execution, particularly when several correlated trades move against the account at the same time.
Trading costs relative to ATR
Comparing the quoted spread with ATR can provide a useful cost reference without becoming a profitability forecast. A two-point spread alongside a 20-point ATR equals 10% of that ATR reading. This does not mean the trade can capture the other 90%: ATR is not an available profit pool, and the entry and exit may span a much smaller favourable movement. Use the timeframe relevant to the method rather than comparing a short scalp’s spread with a large weekly ATR. Where profit-and-loss calculations already use the actual buy and sell prices, the spread is already included and should not be subtracted again. Add genuinely separate charges according to the contract and holding period.
Overnight funding can also change whether an ATR-based target is economically worthwhile. Charges may be calculated on underlying exposure rather than just the margin deposit, while short share positions can involve borrowing costs. The FCA’s review of CFD providers’ price and value examines costs including overnight funding. For a hypothetical method winning 40% of trades, with £50 average price gains and £25 average price losses, the average result before separate charges is £20 minus £15, or £5. Average additional costs of £3 reduce that to £2. If actual average winners shrink to £40, the result becomes £16 minus £15 minus £3, or a £2 average loss.
Which traders and markets does ATR suit?
ATR may suit traders who want to make stop distances and stakes responsive to measured price movement rather than applying the same arbitrary point distance everywhere. It can support day trading, swing trading and trend trading, provided each method defines its own timeframe, entry reason and exit rules. It is less suitable as a standalone solution for someone looking for a simple buy or sell arrow, because the calculation contains no directional signal. The trader also needs to be comfortable translating price units into pounds of exposure. If the contract’s minimum stake prevents a suitably small position, changing the indicator settings does not solve that practical constraint.
Market and session differences affect the reading. A share chart using regular exchange hours can capture an overnight gap differently from a chart that includes extended trading. An index cash chart, a futures chart and a spread betting quote may also produce different ranges. Corporate actions, adjusted historical data and contract rollovers can introduce or remove apparent jumps, affecting both ATR and a historical test. Know what the data represents before using it to place live orders. Keep a calendar of relevant company and economic announcements as well. A low reading immediately before an event describes earlier trading, while the event can produce a much larger movement than the indicator has yet incorporated.
Advantages and disadvantages of ATR
ATR’s main practical advantage is that it makes recent price-range information explicit and includes gaps relative to the previous close. It can help a trader compare a stop distance with prevailing movement and maintain a consistent method for sizing positions around a chosen budget. Its non-directional design is useful when combined with a separate entry approach, but it also means ATR cannot decide the trade alone. Historical smoothing creates a delayed response to sudden changes, and a multiplier does not establish the chance of a stop-out. The most serious misuse is treating a low reading as permission for unrestricted exposure. A consistent formula still needs limits that account for events outside its historical sample.
| Advantage | Limitation to assess |
|---|---|
| Includes gaps relative to the prior close | Cannot predict the next gap or guarantee a stop fill |
| Expresses recent movement in price units | Requires correct conversion to the contract’s point size |
| Can inform stop distances and stakes | Does not identify the price level that invalidates every setup |
| Supports repeatable trailing rules | Recalculation can loosen protection unless the rule prevents it |
| ATR percentage aids scale comparisons | Does not equalise liquidity, event risk or account exposure |
Combining ATR with other technical analysis
Assign each tool a clear task. Price structure or moving averages may define a trend, RSI or MACD may supply a momentum condition, and ATR may help assess the distance to a protective exit. These calculations all use price information, so their agreement should not be presented as independent proof of a trading advantage. An ATR filter that removes trades can reduce losses, remove winners or do both. Compare the complete method with the simpler version. Adding indicators without a stated function makes it easier to explain past outcomes and harder to decide consistently what should happen when their readings disagree in live trading.
ATR and Bollinger Bands also measure different aspects of price behaviour. Conventional Bollinger Bands use the dispersion of closing-price levels around a moving average, while ATR uses smoothed true ranges from highs, lows and previous closes. Their readings need not rise or fall together. A series of steady upward closes can spread prices around their average while individual true ranges remain fairly regular. A trading template that combines the two should explain what each contributes rather than calling them interchangeable volatility measures. The same caution applies to ATR-based channels and trailing indicators: inspect their anchor, multiplier and update logic instead of assuming that the presence of ATR makes all implementations behave the same way.
How to get started with an ATR spread betting method
Choose one market and timeframe, then define the directional setup independently of ATR. Record the smoothing method, the completed ATR reading used at entry, the stop calculation, the cash-risk budget and any exposure cap. Confirm how chart units translate into the contract’s point size and whether the intended stake and stop distance are permitted. Before funding an account, follow the FCA’s guidance on checking that a firm is authorised and has relevant permissions. Those checks address the provider; they do not establish that the strategy is profitable or that a position’s risk is appropriate. The practical objective is a complete written process that can be followed without improvising its financial limits after entry.
Practise the process on historical examples and in a demonstration account, including trades that fail and periods when the rules require standing aside. Record the ATR value, entry quote, chosen stop, stake, exposure, actual exit and charges. Include whether the stop or target was fixed at entry or updated later, and whether any adjustment increased the permitted loss. Demo practice helps with calculations and order handling, but does not fully reproduce live fills or the emotional effect of losses. A useful journal should make deviations visible. If the planned method says to reduce the stake during wider ranges but the trader repeatedly keeps the larger stake, the real process differs from the one being evaluated.
Backtesting ATR rules without overfitting
Trying many ATR periods, multipliers, filters and trailing rules creates opportunities to find an attractive historical result by chance. The research paper The Probability of Backtest Overfitting examines this problem in investment strategy selection. Keep a record of the variations tried and evaluate chosen rules on data not used to develop them. Repeatedly consulting that evaluation data while adjusting the method weakens the separation. Check whether results remain plausible across nearby settings, different market conditions and less favourable costs. A narrow historical optimum is not evidence that one multiplier has discovered the market’s natural risk boundary. Even careful testing cannot guarantee that future gaps, trading conditions or execution will match the assumptions used.
Timing assumptions matter as much as the formula. If a trade opens during a candle, the final ATR calculated from that candle’s high and low was not yet available. Likewise, a trailing stop calculated from the completed bar cannot be assumed to have protected the position earlier inside it. If both the target and stop are reached within one bar, use suitable intrabar data or a stated conservative assumption to resolve the sequence. Include spreads, funding, slippage, data adjustments and trading interruptions. Review drawdown, losing sequences and occasional large losses alongside average net results. Equal planned stop risk across trades is not enough if realised losses repeatedly exceed it when market conditions become difficult.
Frequently asked questions about ATR spread betting
Does rising ATR mean you should buy?
No. Rising ATR means the smoothed true range has increased. That can happen during an upward breakout, a downward break, a sharp reversal or wide movements in both directions. It provides information about the scale of recent movement rather than a directional forecast. A complete trading method needs a separate rule explaining why a long or short position is appropriate and where that reasoning fails. Even when an increase accompanies a price breakout, it does not establish that the breakout will continue. Examine the entry price, available reward, execution conditions and position size instead of treating the rising indicator line as evidence that the market itself must rise next.
What is the best ATR stop-loss multiplier?
There is no universally best multiplier for financial spread betting. A two-ATR stop is a familiar illustrative rule, but its suitability depends on the instrument, timeframe, entry conditions, holding period and exit design. A larger multiple can avoid some small stop-outs while increasing the price distance of losses; with a fixed cash budget, it should generally imply a smaller stake. A smaller multiple can permit a larger stake but may place the stop inside routine fluctuations and increase gap exposure at that stake. Compare complete methods after costs rather than judging the multiplier only by win rate. The chosen distance also needs to make sense relative to the price structure that invalidates the trade.
Should you widen an existing stop when ATR rises?
An increase in ATR is not, by itself, a reason to enlarge the loss allowed on an open position. If the stake stays the same, moving a stop further from entry increases planned price risk. A method that permits such changes needs an explicit budget, rules for reducing exposure where necessary and testing that reflects the actual adjustment. A trailing method may instead prevent any movement that loosens protection, even when the raw ATR formula produces a wider distance. Decide that behaviour before entering. The purpose of the indicator is to inform a considered risk process, not to provide a changing numerical justification for remaining in a trade after its original limits have been exceeded.