Slippage costs money when a spread bet executes at a worse price than the price used to plan the order. A one-point difference costs £2 at £2 per point, £10 at £10 per point, and more if both entry and exit slip against you.
Unlike an overnight financing charge, slippage usually appears inside the execution price rather than as a separate account debit. That makes it easy to overlook when reviewing spread betting costs. The practical task is to measure it consistently, include it in trade budgets, and distinguish ordinary execution risk from a pricing error.
What Counts as a Slippage Cost?
Slippage is the difference between a reference price and the price at which an order actually executes. For a market order, the reference might be the executable quote when you submitted it. For an ordinary stop order, it is usually the stop level.
The direction of the order determines whether that difference helps or hurts:
- Buying: a higher execution price is adverse; a lower price is favourable.
- Selling: a lower execution price is adverse; a higher price is favourable.
Favourable execution is often called positive slippage or price improvement. Adverse execution is negative slippage. Those labels can cause confusion in a spreadsheet, so use a separate convention for costs: record adverse slippage as a positive expense and favourable slippage as a negative expense.
The broader guide to how slippage works covers the execution mechanics. Here, the focus is the cash effect and how to account for it.
Slippage Is Not the Spread
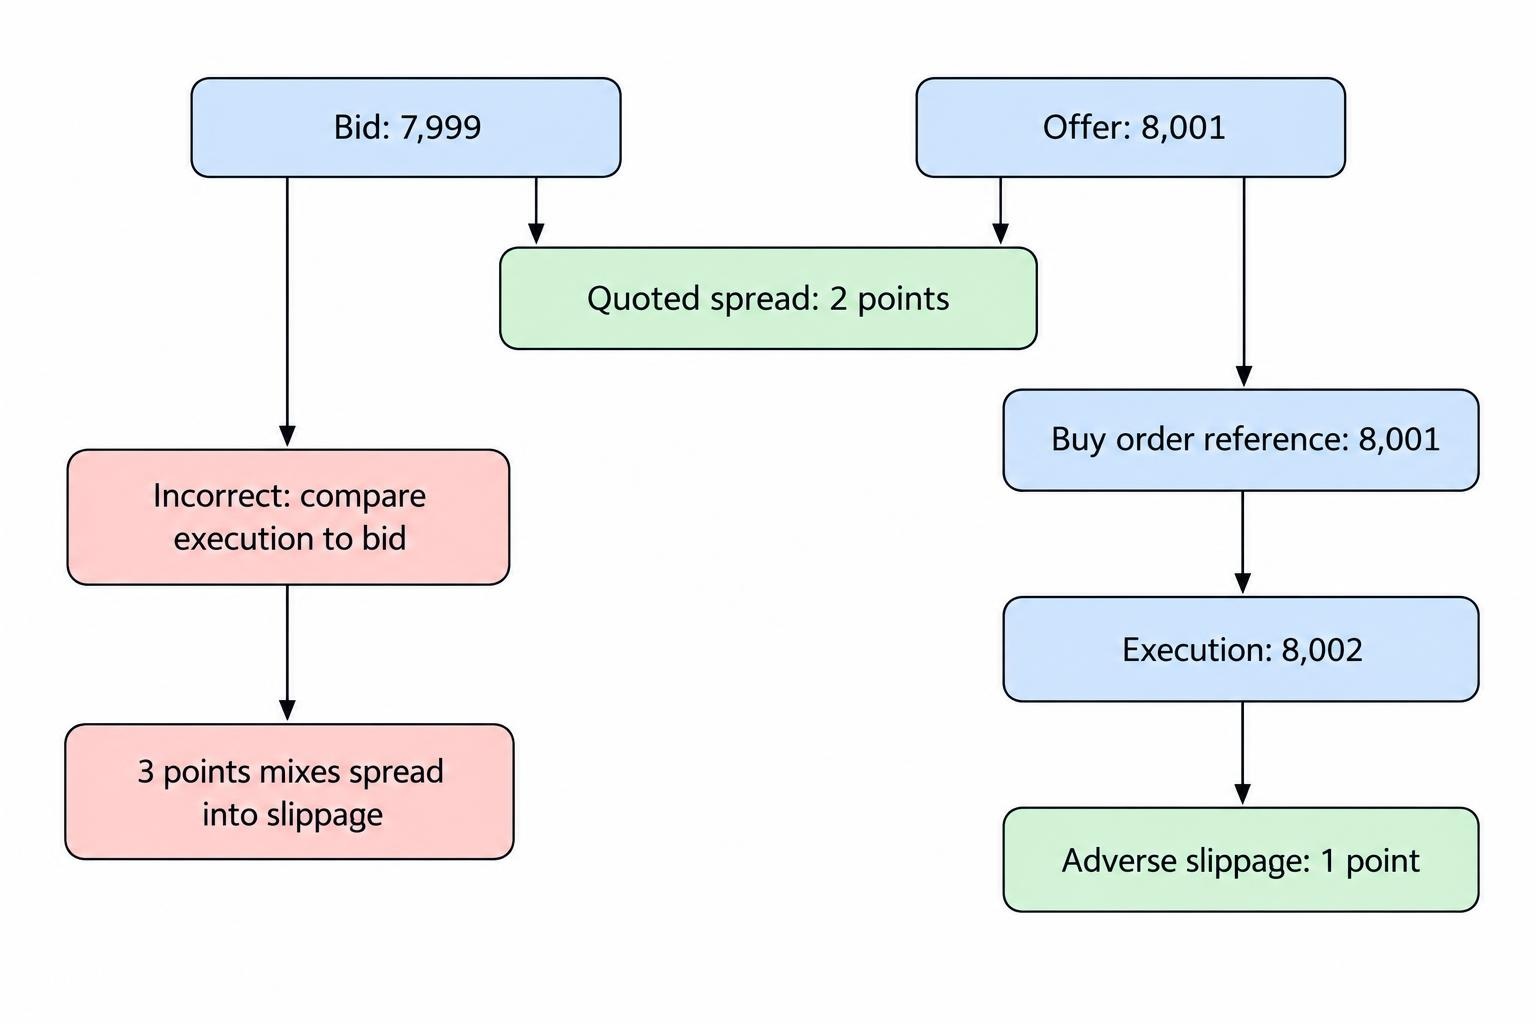
The spread is the difference between the quoted buying and selling prices. Slippage is a difference between your chosen reference price and your actual fill. They can occur on the same order, but they are not interchangeable.
Suppose a market is quoted at 7,999–8,001. You submit a buy order using the offer of 8,001 as your reference, but it fills at 8,002. The adverse slippage is one point, not three. Comparing the fill with the bid would wrongly include the spread.
Use the correct side of the bid-ask spread: the offer for a buy and the bid for a sell. A chart’s midpoint or last traded price may not have been an executable price for your order.
How to Calculate Slippage in Pounds
Once the price difference is expressed in the platform’s dealing points, the calculation is straightforward:
Slippage cost = adverse price difference in points × stake per point.
For a signed calculation that also captures improvements:
- Buy order cost: (execution price − reference price) × stake per point.
- Sell order cost: (reference price − execution price) × stake per point.
The following index examples are hypothetical. Each row represents an order, and a negative cost means the execution improved on the reference price.
| Order | Reference price | Execution price | Slippage cost |
|---|---|---|---|
| Buy to open | 8,000 | 8,001.5 | £6 |
| Sell to open | 8,000 | 7,998 | £8 |
| Sell to close | 8,050 | 8,048.5 | £6 |
| Buy to close | 7,950 | 7,949 | −£4 |
Check what constitutes one point before using the formula. A displayed decimal, a pip and a platform dealing point are not necessarily the same unit. The monetary conversion must match the contract’s stake per point.
Count Both Sides of the Trade
Take the first and third rows as one long trade. Buying at the reference price of 8,000 and selling at the reference price of 8,050 would produce a £200 profit at £4 per point, before separately charged fees.
The actual entry is 8,001.5 and the actual exit is 8,048.5. That leaves 47 points, or £188. Entry slippage costs £6 and exit slippage costs another £6, reducing the result by £12.
Your realised trading result already contains that £12 reduction. Record it separately for analysis, but do not deduct it again from the account’s realised profit. That would turn one execution cost into two accounting mistakes.
How Stop Slippage Changes Your Planned Loss
A stop placed 20 points from an executed entry at £5 per point gives a planned price loss of £100. If the closing order executes eight points beyond that stop, the price loss becomes £140. The slippage component is £40, before any other charges.
An ordinary stop therefore gives you an exit instruction, not a guaranteed cash loss. The distinction matters most when a position is sized right up to a maximum trade budget.
One approach is to include an execution allowance in the sizing calculation:
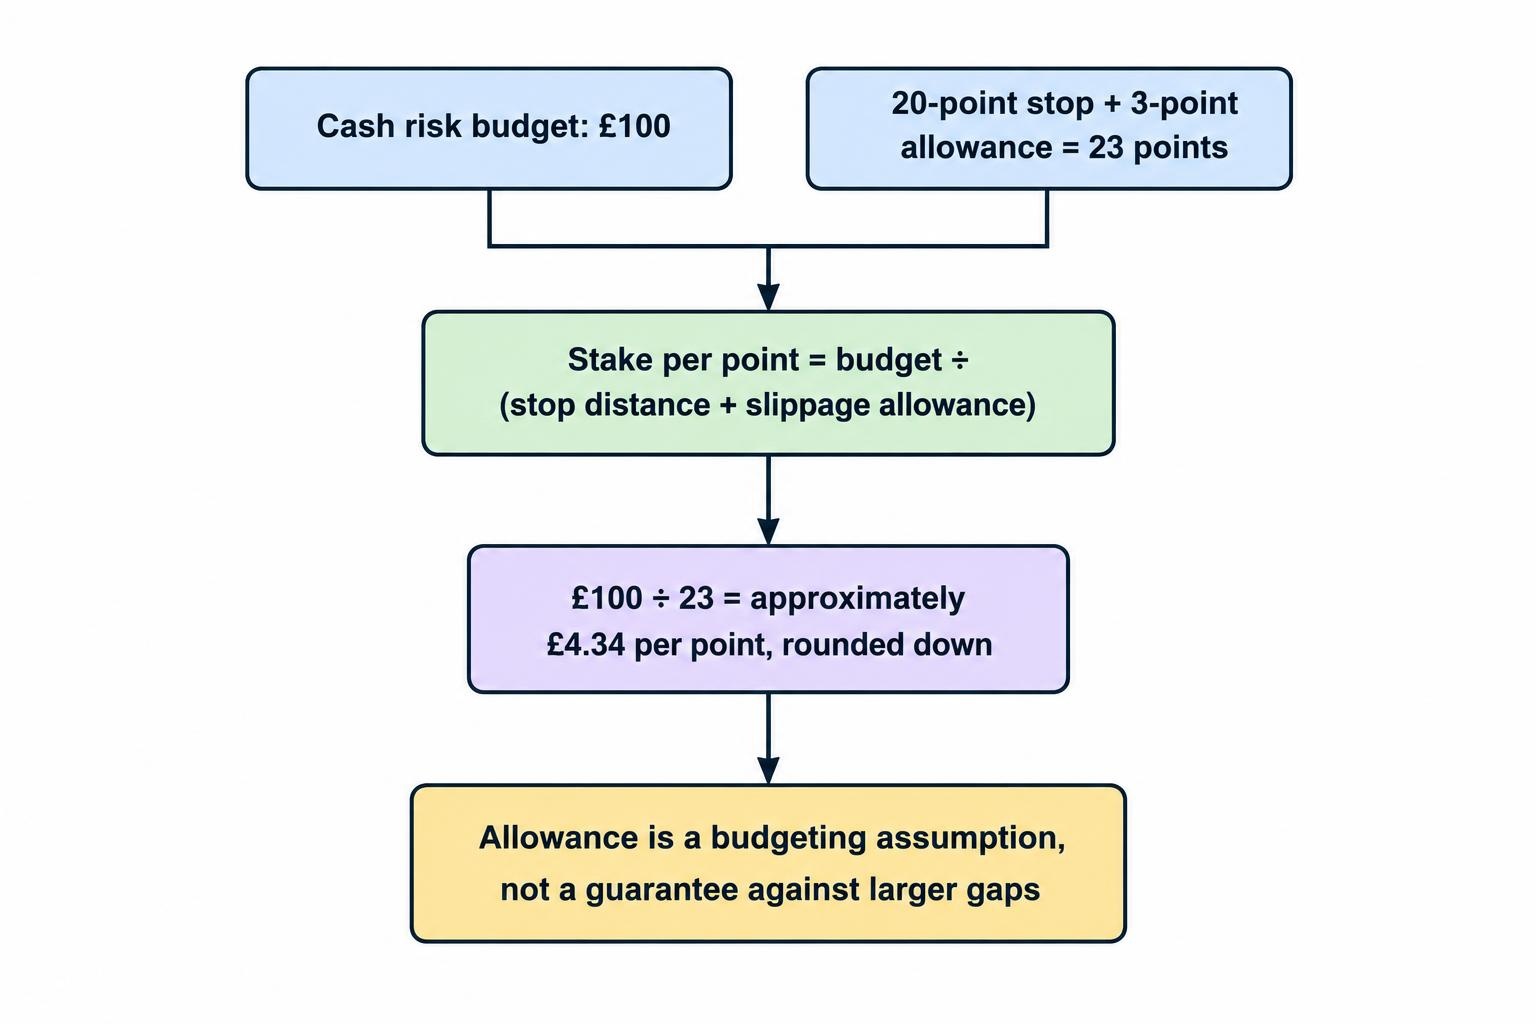
Stake per point = cash risk budget ÷ (stop distance + slippage allowance).
With a £100 budget, a 20-point stop and a hypothetical three-point allowance, the calculation gives about £4.34 per point, rounded down. A 23-point loss would then cost £99.82. Any separately charged fees would need their own allowance.
This is a budgeting method, not a loss guarantee. A gap can exceed the allowance. Use recorded execution data and stress scenarios when setting it; an arbitrary buffer can make a spreadsheet look safer without making the position safer. The wider position sizing guide covers how that calculation fits within account risk.
Why Small Slippage Costs Can Damage a Strategy
The size of the cost matters relative to the profit a strategy expects to retain. A few tenths of a point may be tolerable for a trade targeting a large move but expensive for a method that relies on small, repeated gains.
Consider a hypothetical sequence of 100 completed trades at £5 per point. Average net adverse slippage of 0.6 points per completed trade costs £300. That average includes both entry and exit, and includes orders with no slippage or favourable slippage.
If the same sequence would otherwise have earned £450 after spreads and other charges, slippage reduces it to £150. It has consumed two-thirds of the remaining profit, despite averaging less than one point per trade.
Backtests need the same discipline. Separate any spread assumption from the slippage assumption, and check whether the test already applies execution costs. A historical strategy that buys and sells at convenient chart prices may look profitable only because it has never had to get an order filled.
When the Cost Can Increase
Slippage risk rises when prices move between order submission and execution, or when the required price is not available for the order size. Rapid moves and market closures can also defeat ordinary stop protection, risks covered in the ESMA and EBA warning on CFD execution risk.
For cost planning, separate routine trading from event exposure. An average drawn from quiet sessions is a weak allowance for a position held through an economic release, company announcement or market reopening.
Order size also matters. Do not assume the execution obtained on a small stake will remain available after increasing it. Equally, do not assume every spread bet is sent directly to an exchange order book. Review the provider’s execution arrangements and measure the prices received on your own orders.
A reliable connection can reduce avoidable transmission problems, but it cannot create liquidity at a missing price. Faster equipment is not a substitute for a sensible stake.
Reducing Slippage Without Creating Another Risk
Use Price Controls Where Non-Execution Is Acceptable
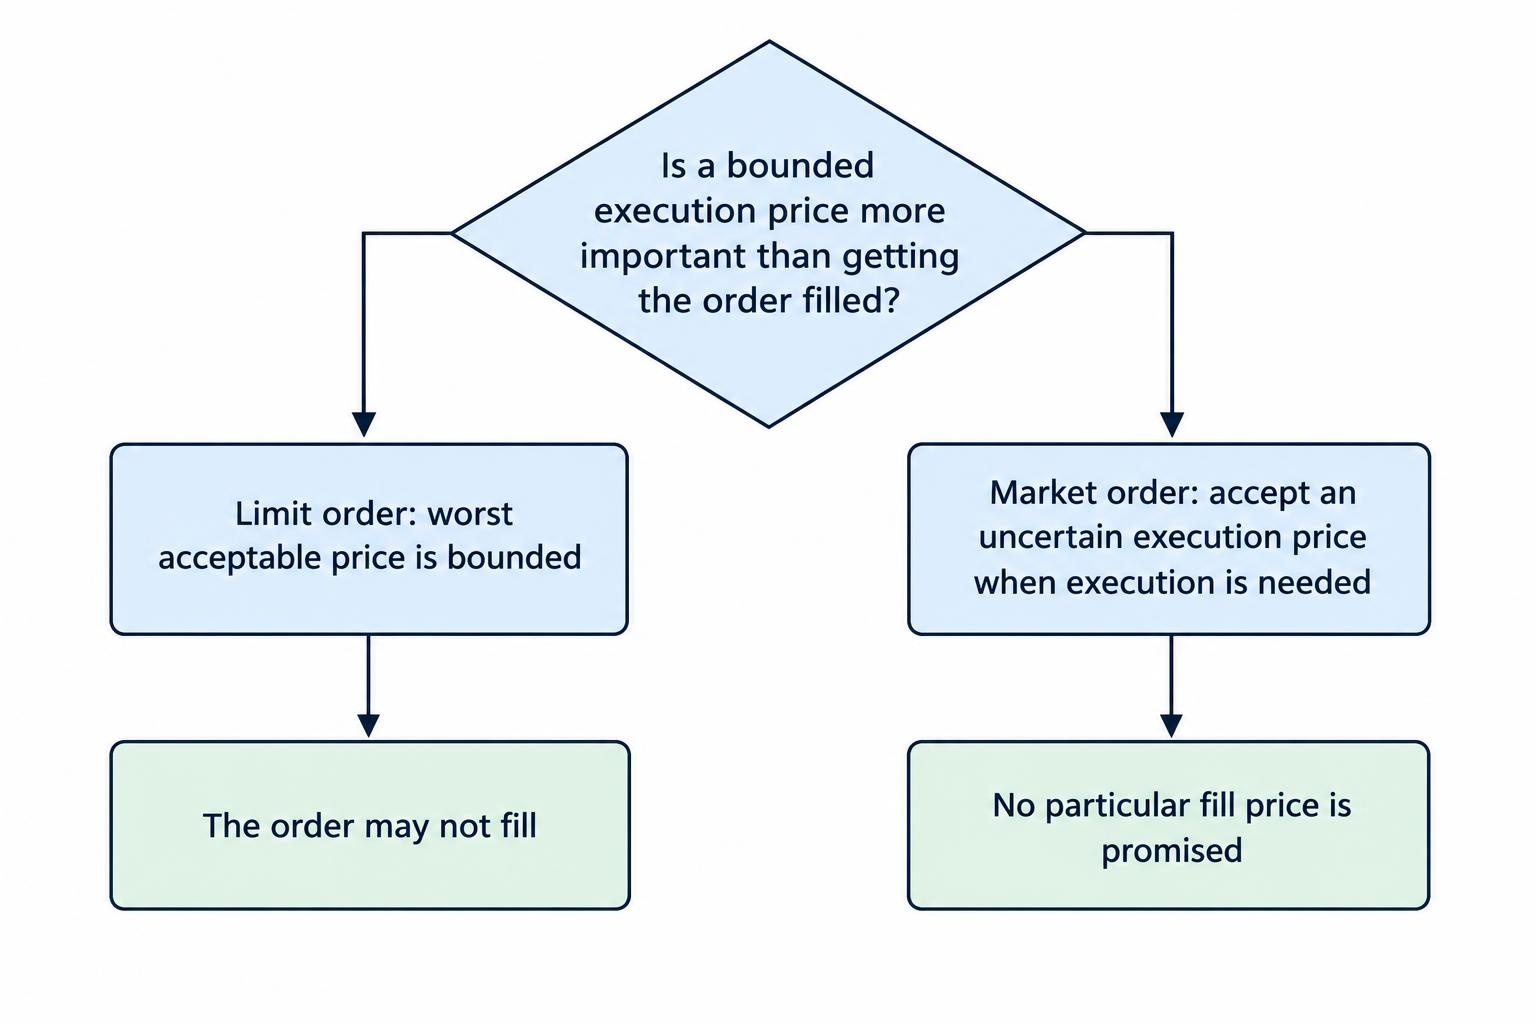
A limit order sets the worst acceptable execution price: a maximum for a buy or a minimum for a sell. It can prevent adverse execution beyond that boundary, but the order may remain unfilled.
That trade-off can suit an entry where missing the trade is acceptable. It can be much less suitable for an urgent exit. Where offered, a stop-limit order may trigger without closing the position if the market moves beyond its limit.
The relevant comparison is not “slippage versus no cost”. It is uncertain execution price versus the consequences of non-execution. Use limit orders when that price control matches the purpose of the order.
Compare Guaranteed Stop Charges with the Exposure
Where available, a guaranteed stop provides execution at the agreed stop level under the product’s terms. Its cost should be compared with the adverse stop slippage it protects against, rather than treated as an unrelated platform feature.
For illustration, a premium quoted as two points at £5 per point represents £10 whenever the charging terms make that premium payable. Check whether the charge applies when the stop is attached, when it triggers, or under another arrangement.
Also check eligible markets, minimum stop distances and amendment restrictions. The guide to guaranteed stop premiums covers those cost comparisons. Protection against an uncertain exit price does not make the underlying trade profitable.
Reduce Exposure Rather Than Moving the Stop Blindly
Reducing the stake lowers the cash cost of every point of adverse execution. Trading outside an event window can avoid that particular exposure, although it may also change the strategy’s opportunities.
Widening a stop is different. At an unchanged stake, it increases the planned loss and does not prevent slippage when the stop eventually triggers. Change the stop only for a trading reason, then recalculate the stake.
Measure the Cost in an Execution Ledger
An account statement normally provides executed prices, but a fill price alone cannot establish slippage. You also need a defensible reference price recorded at the relevant time. Use spread betting account statements to reconcile the completed orders, not to reconstruct quotes from memory.
Record the market, order direction, order type, stake, reference price, execution price and timestamp. Note whether the order occurred during routine trading, a scheduled announcement or a reopening.
Then calculate total adverse slippage less total favourable slippage. Keep the cash total alongside the average in points. A simple point average can hide the fact that the worst fills occurred on the largest stakes.
Also examine unusually costly fills separately. Ten modest improvements do not necessarily offset one large adverse stop execution. Reporting only the percentage of orders receiving price improvement can conceal the size of the losses elsewhere; the ESMA execution-quality Q&A identifies this weakness in slippage disclosures.
Compare Brokers on Executed Cost, Not Just Quoted Spread
A narrower advertised spread does not automatically produce a cheaper completed trade. Compare spread and slippage using matched markets, order types, stake sizes and trading periods. Keep financing and separately charged fees visible too.
The FCA’s retail best-execution rules assess the best possible result through total consideration: the instrument’s price and execution-related costs. That duty should not be mistaken for a promise that every order will fill at the price first displayed.
Look for a clear explanation of favourable as well as adverse execution. This is not a theoretical concern: the FCA’s 2014 final notice on asymmetric slippage found unfair treatment where favourable movements were retained while adverse movements were passed to customers.
For practical comparisons, assess broker execution quality alongside quoted pricing. One unusually good or bad fill is not enough to rank a provider, but a consistent pattern deserves investigation.
When an Unexpected Fill Needs Challenging
A worse fill does not, by itself, prove an execution failure. Preserve the order confirmation, reference quote, timestamps and relevant contract terms. Ask the provider to explain the trigger, execution price and market conditions used.
The Financial Ombudsman Service’s approach to spread betting complaints considers what customers were told about stop execution and what happened in the underlying market. Its assessment also considers unfair treatment of favourable and adverse price movements.
The practical rule is simple: budget for uncertain execution, measure what actually happens, and challenge fills that do not match the agreed arrangements. Slippage belongs in the trading cost calculation even when it never appears on a fee schedule.