Retail client loss rates show how many eligible retail trading accounts finished a reporting period with a net loss. They do not show how much money those accounts lost, how many individual trades failed, or the probability that your next spread bet will lose.
That distinction matters. A risk warning is useful evidence about customer outcomes, but it is not a broker quality score or a personal trading forecast. A lower percentage deserves attention, not an automatic endorsement.
This review examines published regulatory findings, the calculation behind provider warnings, and the limits of comparing them. It uses public evidence rather than a new audit of broker accounts. Within spread betting research, loss rates belong alongside costs, execution and account protections, not above them.
What Does a Retail Client Loss Rate Measure?
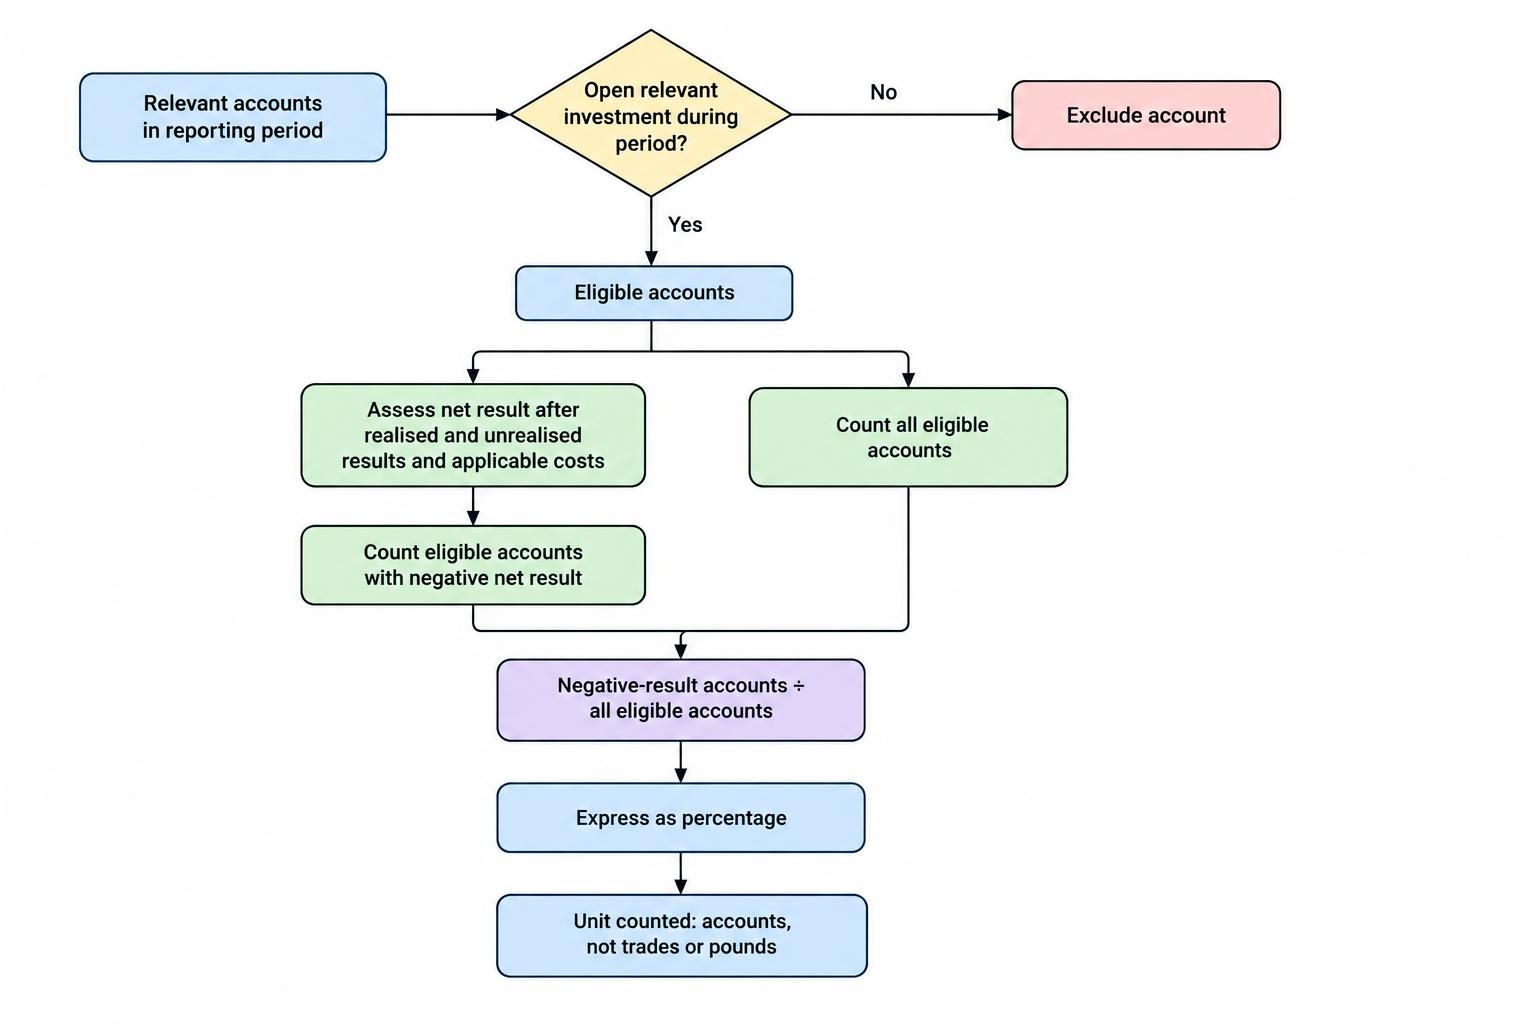
A provider’s loss percentage answers a narrow question: what proportion of the retail accounts included in its calculation had a negative result during the reporting period?
For UK providers covered by the rules, the calculation is updated every three months using the preceding 12 months. It includes realised and unrealised net results, all costs, fees, commissions and other charges. Accounts without an open relevant investment during that period are excluded, as are deposits, withdrawals and results from unrelated investments. The warning framework covers leveraged spread bets, CFDs and rolling spot forex; its wording can therefore refer to CFDs even where a spread betting product is offered. These requirements appear in the FCA’s standardised risk warning rules in COBS 22.5.
The unit being counted is an account, not a trade, pound of capital or necessarily a separate person. Someone who wins on most trades can still finish with an account loss. Someone who trades only occasionally can finish ahead.
Nor should a combined warning be treated as clean evidence about one product. A provider figure covering several relevant products cannot establish the results of its spread betting customers alone. The commercial similarities between these products do not make every dataset interchangeable; the comparison of spread betting and CFDs covers their practical differences.
A Worked Loss Rate Calculation
Consider a hypothetical provider with 1,000 eligible retail accounts during its reporting period:
| Account outcome | Number of accounts | Share of eligible accounts |
|---|---|---|
| Net loss | 760 | 76% |
| Net profit | 210 | 21% |
| Exactly break even | 30 | 3% |
| Total | 1,000 | 100% |
The loss rate is 760 divided by 1,000, multiplied by 100: 76%.
The remaining 24% did not lose money, but only 21% made a profit. The difference is the group that broke even. Subtracting the published loss rate from 100 does not necessarily produce the percentage of profitable accounts.
Nothing in this calculation reveals the size of the results. An account down £2 and an account down £20,000 each contribute one losing account. Likewise, a £1 gain and a £10,000 gain each count as a profitable outcome.
The calculation also says nothing about trade frequency. One account might have placed three trades, another three thousand. Each still contributes one account to the denominator. For the arithmetic behind individual positions, use the guide to calculating spread betting profit and loss.
What Published Regulatory Evidence Shows
Regulatory findings provide context for provider warnings. They need dates, product boundaries and geographic labels, though. A historical European study and a recent Australian review are not observations of the same customers under the same conditions.
The findings below show that losses have affected a majority of retail customers in the populations examined. They do not establish a current, UK spread betting only loss rate.
UK: Approximately 80% in the FCA’s December 2022 Statement
On 1 December 2022, the FCA stated that approximately 80% of customers lost money when investing in CFDs. Its statement on continuing concerns in the CFD sector also addressed poor customer outcomes and conduct problems at some firms.
This is a dated sector statement, not a fresh measurement for October 2026. It should not be presented as the current percentage for every UK provider, or as proof that exactly four out of five spread betting accounts lose in every reporting window.
Its value is broader: it establishes that widespread customer losses were a regulatory concern. For an account opening decision, the relevant provider disclosure still needs checking separately.
Europe: A Historical Range of 74% to 89%
On 27 March 2018, ESMA reported that national regulators’ analyses across EU jurisdictions showed 74% to 89% of retail CFD accounts typically losing money. Average losses per client across those analyses ranged from €1,600 to €29,000. Both figures appeared in ESMA’s announcement of retail CFD intervention measures.
The percentage range is not one pooled European loss rate. It summarises results from different national analyses. Taking its midpoint would not create a valid European average, still less a current UK estimate.
The monetary range also needs care. Differences in deposits, trading activity, observation periods and the customers studied can affect average losses. A larger average loss does not, by itself, prove that one country’s traders were less capable.
Australia: 68% for the 2023–24 Financial Year
ASIC’s consultation released on 12 October 2026 reported that 68% of Australian retail clients who traded CFDs made a net loss in the 2023–24 financial year. Aggregate net retail client losses exceeded A$458 million, including A$73 million in fees. These findings appear in ASIC’s consultation on extending CFD consumer protections.
The publication date and measurement period are different. These are findings published in October 2026 about trading during 2023–24, not losses incurred during October 2026.
They are also Australian CFD results, not UK spread betting results. They offer a more recent published comparison, but the lower percentage cannot establish that Australian providers are safer or that UK customer outcomes have improved by the same amount.
What the Percentage Does Not Tell You
It Is Not the Percentage of Your Deposit You Will Lose
A warning showing a 76% account loss rate does not mean the average customer lost 76% of their deposit. It does not mean you should expect to retain 24% of your capital either.
Consider two hypothetical groups of 100 accounts. In each group, 70 accounts lose money. In the first, every losing account loses £20. In the second, every losing account loses £2,000. Both groups have a 70% loss rate, despite losses among the losing accounts totalling £1,400 and £140,000 respectively.
Those totals are not aggregate net results across all accounts, because the winning accounts have not been included. Even a simple example needs the right label.
It Is Not a Trade Win Rate
A trader could win on 60 out of 100 trades and still lose money. Suppose each winning trade makes £20 and each losing trade costs £40. The winners produce £1,200; the losers cost £1,600. The account is down £400 before any further charges.
Another trader could win less often but finish ahead because their average gain exceeds their average loss. Counting successful trades and counting profitable accounts answer different questions.
This is why screenshots of winning positions are weak evidence about an account’s performance. They leave out losing positions, position sizes, charges and the period over which the results were achieved.
It Does Not Measure the Path Taken
Two accounts can finish £100 ahead after very different experiences. One might never have been more than £50 below its starting equity. The other might have fallen £4,000 before recovering.
Both have the same final profit, but they do not present the same risk history. A final account outcome leaves out the depth and duration of losses along the way. That missing information is the reason to examine trading drawdown separately.
A profitable endpoint also says little about how repeatable the result was. One large winning position can outweigh months of small losses without proving that the trading process has a dependable advantage.
It Is Not Your Personal Probability of Losing
A provider’s customers are not a controlled sample of people following your proposed strategy with your capital and trading schedule. Their results combine different decisions, markets, holding periods and account sizes.
The warning should challenge casual expectations of easy profits. It cannot calculate your personal odds. Claiming that education or discipline automatically places someone in the profitable minority is just as unsupported as assuming everyone faces identical outcomes.
Can You Compare Brokers Using Loss Rates?
Yes, but only as one input. A lower reported rate means fewer accounts in that provider’s measured population finished below zero. It does not identify why that happened.
Possible explanations include differences in customer experience, products traded, trading frequency, holding periods or market exposure. Pricing and execution could matter too. The headline percentage does not separate these effects.
Match the Legal Entity and Account Population
Start with the contracting company, not just the brand name. A brand may operate through several companies serving different jurisdictions. A percentage attached to one entity should not be transferred to another without evidence that it covers the relevant accounts. Research into broker legal entities helps keep that comparison straight.
Next, identify whether the disclosure covers spread betting alone or a wider set of products. A combined figure may be valid for its intended population while being unsuitable for a product level comparison.
Regulatory status is a separate check. A reassuring percentage cannot substitute for confirming that the company offering the account has the appropriate permissions. The guide to checking a broker on the FCA Register covers that process.
Do Not Average Percentages Without Account Counts
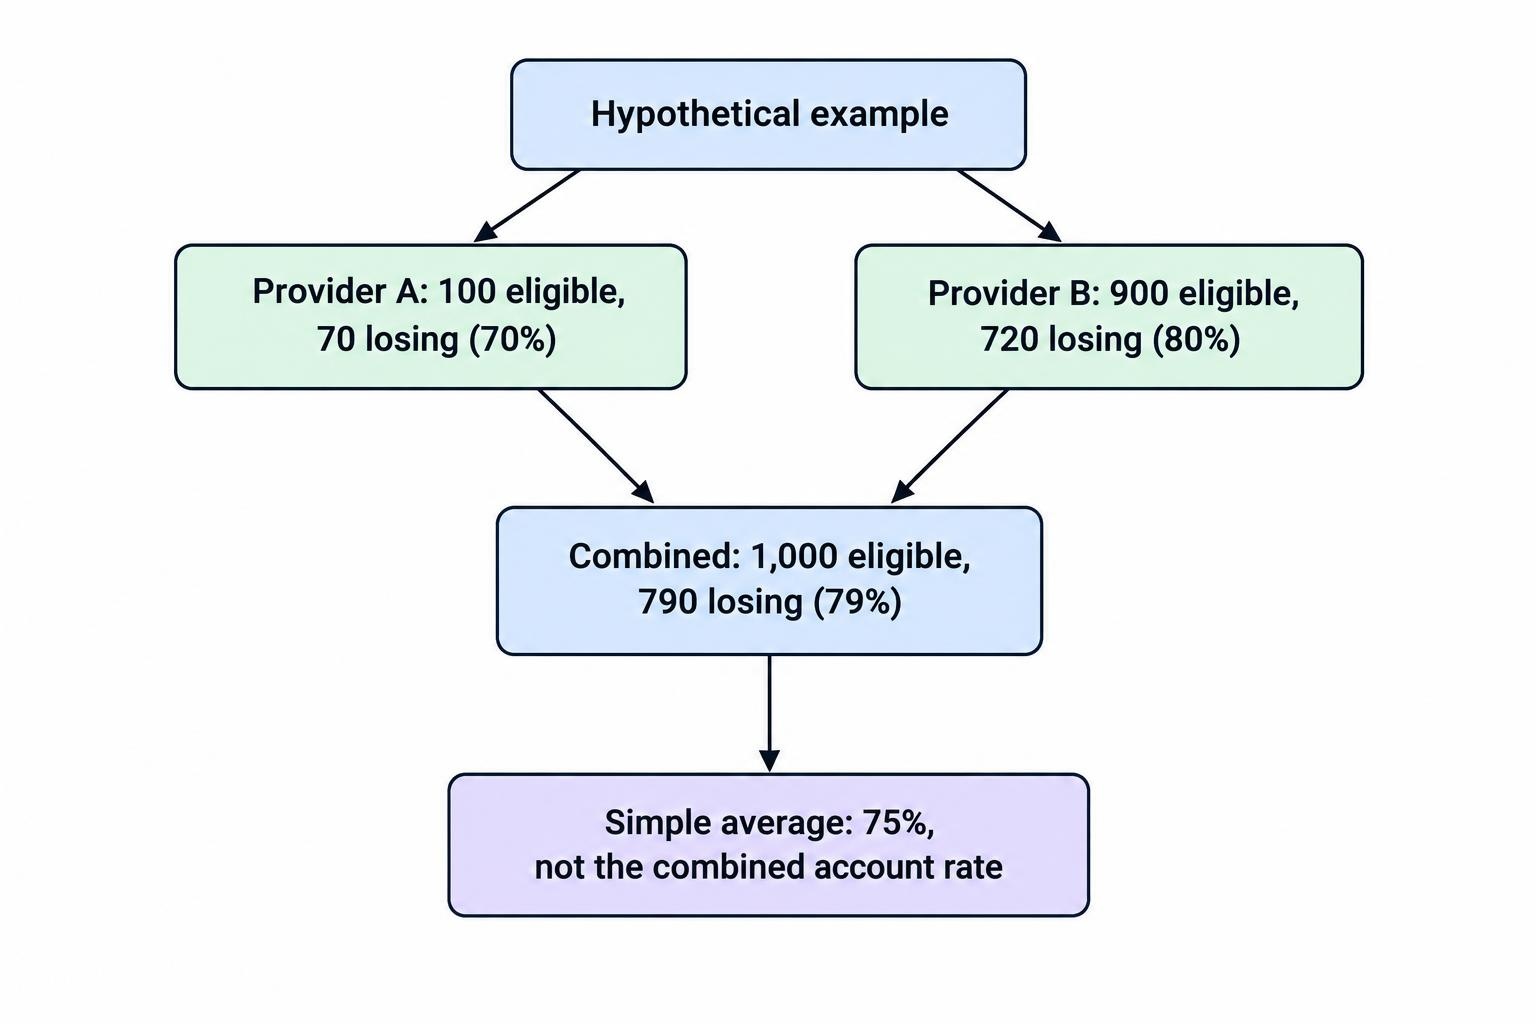
Suppose two hypothetical providers publish the following results for matching periods and definitions:
| Hypothetical provider | Eligible accounts | Losing accounts | Loss rate |
|---|---|---|---|
| Provider A | 100 | 70 | 70% |
| Provider B | 900 | 720 | 80% |
| Combined | 1,000 | 790 | 79% |
The simple average of 70% and 80% is 75%. The combined account loss rate is 79%, because the larger provider contributes nine times as many accounts.
Without eligible account counts, averaging a collection of provider warnings produces an average of provider percentages, not a market account loss rate. Label it incorrectly and an innocent spreadsheet becomes a fairly persuasive mistake.
Even a correctly weighted calculation would describe accounts at the included firms, not necessarily separate individuals. Someone with accounts at both firms could appear twice. Missing providers and inconsistent reporting dates would create further gaps.
Check Costs and Execution Independently
A lower loss rate does not prove lower trading costs. Customers could trade less frequently at an expensive provider, while more active customers generate a higher loss rate at a cheaper one.
Compare the charges that apply to your intended activity through a total spread betting cost comparison. A short intraday position and a position held for several weeks can face very different cost profiles.
The same caution applies to execution. Account outcomes cannot tell you whether orders experienced favourable fills, adverse slippage or rejected instructions. Those questions require separate evidence about broker execution quality.
Why a Changing Loss Rate Needs Context
A falling percentage can be encouraging, but it is not a clean test of a provider’s improvements. The customer population and market conditions may have changed at the same time.
There is also substantial overlap between successive annual windows. As an illustration, a period running from 1 July 2025 to 30 June 2026 shares nine months with one running from 1 October 2025 to 30 September 2026. Only three months leave the window and three enter it.
Two successive readings are therefore not two independent annual experiments. A change could reflect results dropping out of the calculation rather than a sudden improvement in recent trading.
Time spent trading also varies within a reporting window. An account active for nearly the whole period has had a different opportunity to accumulate gains, losses and charges from one active only near the end.
Finally, repeated snapshots do not automatically track the same people. If some customers stop trading while others arrive, a sequence of percentages cannot tell you whether a fixed group improved with experience. That would require following the same group through time.
Loss Frequency and Loss Severity Are Different Measures
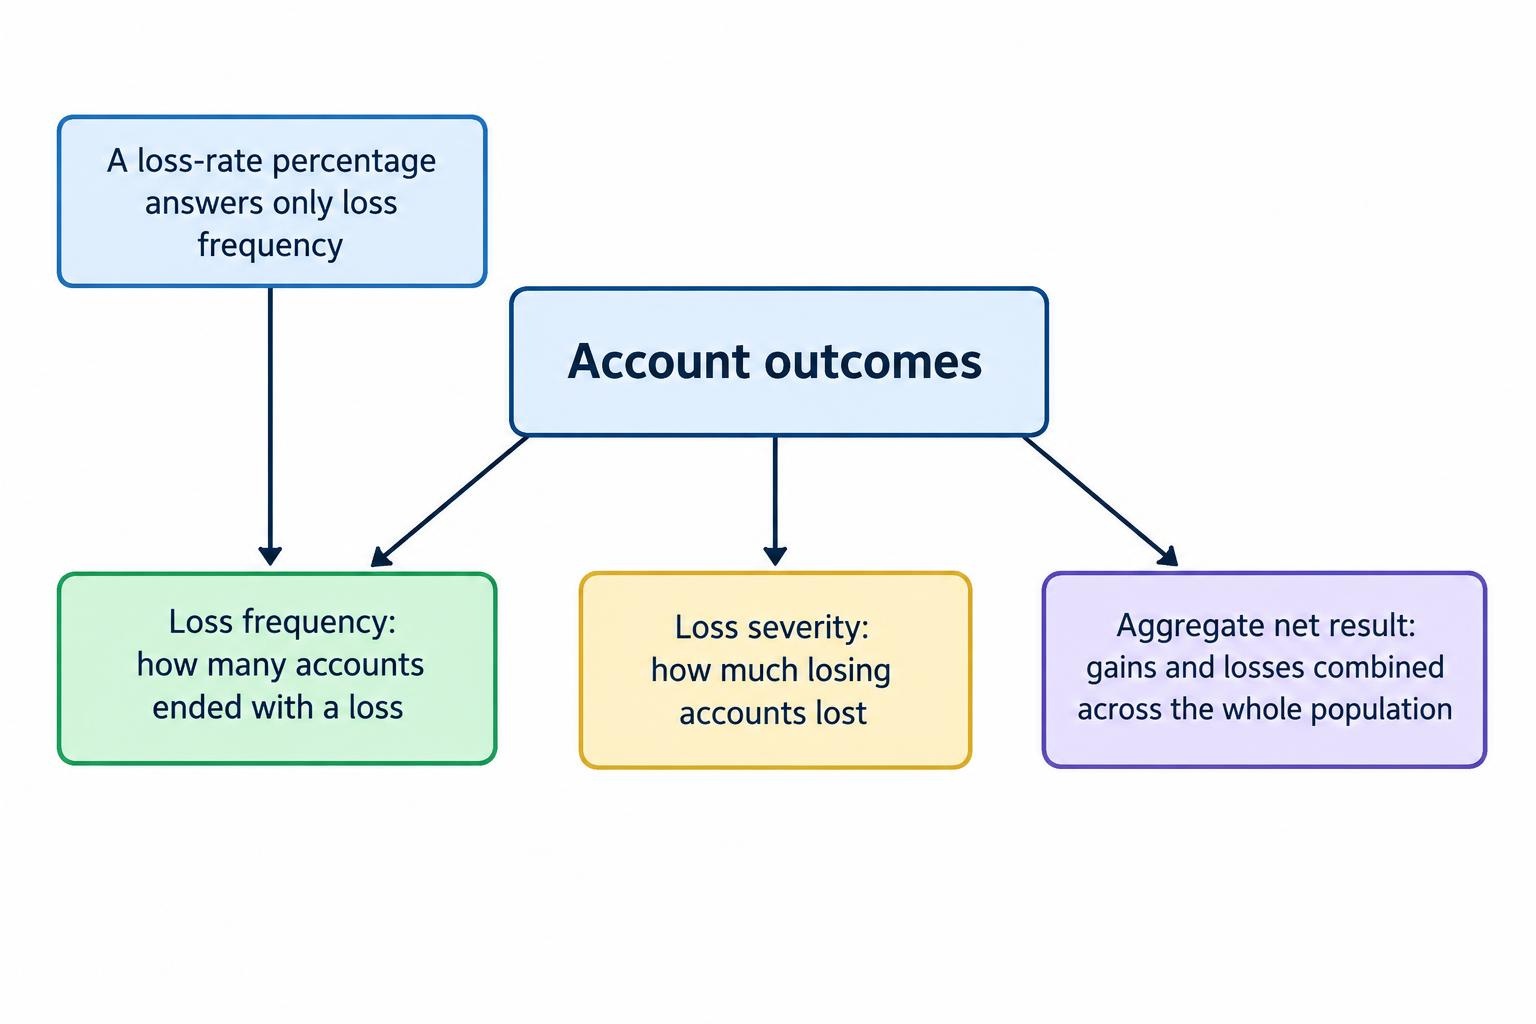
A useful assessment separates three questions: how many accounts lost, how much losing accounts lost, and what happened across the entire population after gains and losses were combined.
A regulator can reduce financial harm without turning most customers into winners. Smaller positions or lower exposure might reduce the amount lost even if many accounts still finish slightly below zero.
Australia provides an example of this distinction. In April 2022, ASIC reported a 91% reduction in aggregate net retail account losses during the first six months of its intervention order, from an average A$372 million to A$33 million per quarter. It also reported 51% fewer losing retail accounts per quarter on average. Those findings came from ASIC’s review supporting the extension of its CFD intervention order.
Neither statement means that the percentage of losing accounts fell by 91% or 51 percentage points. One concerns aggregate net money losses; the other concerns the number of losing accounts. To calculate a proportion, the relevant total account population is still needed.
For UK readers, the lesson is about measurement rather than importing Australian rules. Account safeguards and financial outcomes need separate assessment. The guide to retail client protections covers the protections relevant to UK accounts.
How Exposure and Costs Affect Account Results
A loss percentage records outcomes. It does not diagnose the cause of every loss. Still, the arithmetic of exposure and charges helps explain why a correct market view is not enough.
At £3 per point, a 30 point adverse move produces a £90 trading loss before other adjustments. At £10 per point, the same move produces £300. The forecast is identical; the financial consequence is not.
A small margin requirement does not make the larger position a small risk. It changes the cash needed to establish exposure, not the pounds gained or lost per point. This distinction is central to leverage risk.
Charges can also change the sign of an account result. A hypothetical account making £120 before costs but incurring £150 in charges ends £30 down. Another making £1,000 before the same charges remains profitable. A binary loss measure treats the first as losing and the second as profitable without showing their different margins over costs.
These mechanisms should not be turned into unsupported claims that one behaviour explains a stated share of losses. A broader examination of why spread bettors lose money needs more than a provider’s headline warning.
How to Measure Your Own Results More Usefully
For your own account, a profitable or losing label is only the starting point. The more useful task is to reconcile the money, include open exposure and examine how the result developed.
Begin with equity rather than cash balance alone. A cash balance that excludes open losses can give a flattering picture of an account still carrying risk.
For a straightforward account reconciliation, calculate ending equity minus starting equity, minus deposits, plus withdrawals. Suppose an account starts with £5,000 and finishes with £5,400, after £1,000 of deposits and £200 of withdrawals:
£5,400 − £5,000 − £1,000 + £200 = −£400.
The account contains more equity than at the start, yet its result after adjusting for those cash flows is a £400 loss. Adding money did not create a trading profit.
This calculation reconciles a pound result; it is not automatically a valid percentage return. The timing of deposits and withdrawals matters when measuring returns on changing capital. Use the guide to spread betting account statements to identify the entries behind the reconciliation.
A useful review should record:
- Net account results after charges, including open positions.
- Average winning and losing trade amounts, not just the win rate.
- The largest drawdown and the exposure held during it.
- Costs by category and results by strategy or holding period.
- Changes in capital, trading size and trading frequency.
Keep comparisons consistent. If stakes doubled halfway through the year, the larger pound results do not necessarily show better trading. If several positions express the same market view, counting them as separate trades can also disguise concentrated exposure.
Assess the planned loss in pounds before opening a position. That requires connecting stake size, the intended exit and the possibility of an exit at a worse price, rather than sizing from the available margin alone. The guide to position sizing for spread betting develops that calculation.
Using Loss Rates in an Account Decision
Treat the warning as a reason to question the proposed activity, not as a challenge to join the winning minority. A high historical loss rate is evidence against assuming that easy access to a platform makes profitable trading easy.
For a provider comparison, record the percentage, the date checked, the contracting entity and the products covered. Keep reported facts separate from explanations you cannot test. A three point difference between firms does not reveal whether pricing, customer behaviour or market exposure caused it.
For a personal decision, ask a different set of questions. Can you afford the contemplated losses? Do you know the cost of holding the position? Does the planned exposure remain tolerable if several related trades move against you? Would you stop if the process failed, rather than add funds to defend the original forecast?
Deciding not to trade is a valid response. Where trading does proceed, a written spread betting risk management plan is more useful than confidence drawn from a provider having a slightly lower warning percentage.
Retail client loss rates are informative but narrow. They show how often measured accounts ended below zero. Read them with their dates, populations and product scope intact, then assess loss amounts, costs and exposure separately. That produces a more defensible decision than treating one percentage as the whole story.