Overnight financing changes the cost of a spread bet as the holding period grows. A narrow dealing spread may matter most on a trade closed within the same session. Keep the position open for several weeks and the funding rate can become the larger expense.
This study measures that effect through transparent calculations. Under the central assumptions, a £20,000 position charged at 6.5% a year costs £106.85 to finance for 30 chargeable calendar days. That charge applies before dealing costs, price losses or any other adjustments.
The figures below are calculated scenarios, not observed broker prices or a ranking of providers. They show how exposure, rates, holding periods and charging conventions affect the bill. For an explanation of the charge itself, see the guide to overnight financing costs.
Study Scope and Method
This is a scenario study supported by primary institutional evidence reviewed on 22 October 2026. It does not contain a collected sample of broker funding schedules, live dealing tickets or customer account statements. No provider average, cheapest broker or market median can be inferred from its results.
The purpose is narrower: isolate the arithmetic of overnight financing and establish a consistent method for comparing charges. The broader spread betting cost study covers the relationship between funding and other trading expenses.
Central assumptions
- Position: a hypothetical cash index at 10,000 points, traded at £2 per point, giving £20,000 of notional exposure.
- Funding rate: an assumed annual charge of 6.5%, with alternative scenarios at 4% and 9%.
- Calculation basis: simple daily accrual using a fixed 365 day denominator.
- Exposure: unchanged throughout each scenario, with no additions, partial closures or price movement affecting the funding base.
- Presentation: calculations use unrounded amounts, with displayed sterling totals rounded to the nearest penny.
The central model represents an explicit funding charge on a daily funded position. It is not a universal pricing formula for every spread betting market. The guide to daily funded bets covers the contract structure separately.
Unless stated otherwise, the calculations exclude spreads, commissions, dividend adjustments, share borrowing charges, currency conversion, interest on cash and taxes. Excluding those items makes the funding effect easier to measure; it does not make them irrelevant to a trading decision.
All rates are assumptions rather than current benchmark readings or advertised offers. The 365 day scenario is a sensitivity test, not a suggested holding period. Results also assume that the account remains open and sufficiently funded throughout.
The Financing Calculation
For the modelled position, the calculation is:
Funding charge = notional exposure × annual funding rate × chargeable days ÷ annual day count
The central scenario therefore produces:
£20,000 × 0.065 × 30 ÷ 365 = £106.85
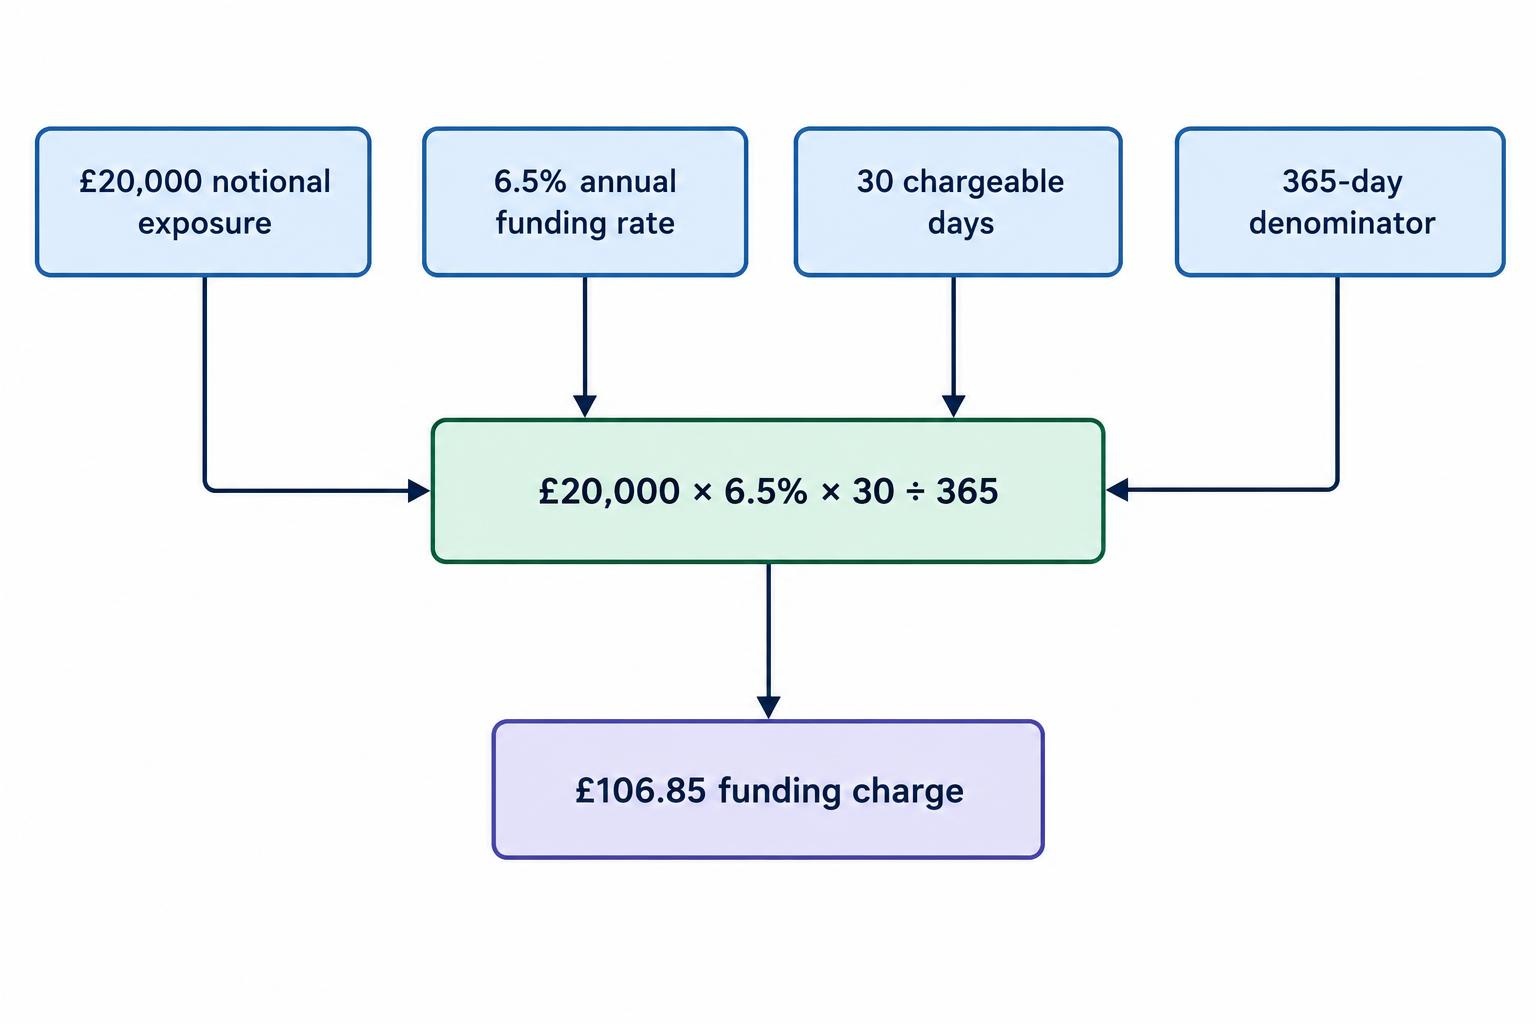
Notional exposure is the amount of market exposure used in the calculation, rather than the cash deposited to support the position. The FCA’s November 2025 review of CFD pricing and value, which includes spread bets, highlighted charges on full exposure without an offset for client funds. It also identified the effect this can have on costs relative to the money supporting a position.
For this hypothetical index, exposure is straightforward: 10,000 points multiplied by £2 per point equals £20,000. That relationship depends on the contract’s point definition. A quote displayed in pence, a currency pair with a fractional point convention, or a differently scaled index needs the correct conversion before the calculation starts.
The guide to stake per point covers those units. A funding calculation can be arithmetically perfect and still wrong if its starting exposure is off by a factor of ten.
Separate the benchmark from the provider’s adjustment
A quoted funding rate needs to be broken into its components where the contract allows that. In a simple assumed arrangement, a 4% reference rate plus a 2.5 percentage point provider adjustment produces a 6.5% annual debit rate for a long position.
SONIA is a sterling overnight benchmark administered by the Bank of England and based on actual wholesale transactions. The Bank of England’s SONIA benchmark resource establishes what that reference rate measures. It does not establish the rate a spread betting provider must charge.
A comparison should record the reference benchmark, the provider adjustment and the resulting client rate separately. Otherwise, a change in market interest rates can be mistaken for a change in the provider’s pricing.
The same caution applies to terminology. A rate described as “base rate plus” needs an identified base rate, an effective date and a clear adjustment. The label alone is not enough to reproduce a charge.
Results: Funding Costs by Holding Period
The table holds exposure constant at £20,000 and changes only the annual debit rate and number of funding days. A funding day means a calendar day included in the charge, not necessarily a separate statement entry or a day when the underlying market trades.
| Chargeable days | 4% annual rate | 6.5% annual rate | 9% annual rate |
|---|---|---|---|
| 1 | £2.19 | £3.56 | £4.93 |
| 7 | £15.34 | £24.93 | £34.52 |
| 30 | £65.75 | £106.85 | £147.95 |
| 90 | £197.26 | £320.55 | £443.84 |
| 365 | £800.00 | £1,300.00 | £1,800.00 |
At 30 days, the difference between the 4% and 9% scenarios is £82.19. At 90 days, it is £246.58. Those gaps arise without changing the market, stake or entry price.
The central 30 day charge is 0.534% of notional exposure. Over 90 days, it becomes 1.603%. These percentages describe the funding deduction relative to the exposure used in the model; they are not forecasts of trading returns.
Another useful measure is the price movement needed to cover financing. At £2 per point, the £106.85 charge requires approximately 53.42 points of favourable movement. Spread and other costs would raise that hurdle.
The model scales directly with exposure. Halving the stake to £1 per point halves every charge in the table, provided the rate and charging terms stay unchanged. Doubling the position doubles the calculated bill. Time and position size both matter; neither makes an unfavourable trade profitable.
Why Margin Is the Wrong Starting Denominator
Suppose the £20,000 position requires £1,000 of initial margin under the assumed contract terms. The central 30 day funding charge remains £106.85 because the model charges against £20,000, not £1,000.
Applying 6.5% to the margin instead would produce £5.34 for 30 days. That understates the modelled charge by a factor of twenty. The distinction between deposited security and market exposure is covered in spread betting margin.
The £106.85 charge equals 10.68% of the assumed £1,000 initial margin. That is a measure of cost relative to margin, not a separate annual borrowing rate. It should not be presented as though the provider quoted a 10.68% monthly interest rate.
Account equity is another denominator again. If the account contains £5,000, the same funding charge represents approximately 2.14% of starting equity. A comparison that switches between exposure, margin and account equity can make an unchanged charge appear cheap or expensive simply by changing the denominator.
For a useful report, show the cash charge first, then its percentage of notional exposure. Cost relative to margin or account equity can follow, clearly labelled. Adding more cash without changing the position does not reduce the charge in this model, although actual contracts may recognise cash balances differently.
Changing Exposure, Rates and Day Counts
The headline table freezes exposure to make comparisons clean. An account reconciliation should instead follow the contract’s actual daily calculation inputs. Where the funding base changes with the market price, holding the stake constant does not necessarily hold notional exposure constant.
Consider an assumed charging method that uses each day’s index value. At £2 per point, a move from 10,000 to 10,500 increases the funding base from £20,000 to £21,000. With the same 6.5% rate, the next day’s charge rises by 5%.
A partial closure changes the arithmetic too. If exposure is £20,000 for 15 chargeable days and £10,000 for the following 15, the modelled total is £80.14, not £106.85. Record the change when it occurs rather than applying the final stake retrospectively. This is one reason to connect cost estimates with position sizing.
Rate changes require the same treatment. Calculate each period at its applicable rate, then add the charges. Using the rate displayed at the end of a month for every preceding day can create an apparent discrepancy that is simply a timing error.
The annual denominator also matters. At £20,000 and 6.5%, a 30 day calculation using 360 produces £108.33, compared with £106.85 using 365. Neither denominator should be substituted for the other without checking the contract.
Daily posting does not, by itself, mean funding compounds on the position. This study uses simple accrual on the stated exposure. It does not add yesterday’s financing charge to today’s notional amount.
Weekends, Holidays and the Funding Cutoff
The number of funding entries is not always the number of days financed. Under a schedule that collects three calendar days in one posting, a single debit can cover a weekend as well as a business day.
In the central model, a three day charge is £10.68. Treating that posting as a one day charge would make the implied annual rate look roughly three times too high. The amount cannot be interpreted properly without its accrual period.
A reproducible comparison therefore needs the funding cutoff, its time zone, the days covered by each posting and any holiday changes. These details belong alongside the rate rather than buried in a separate note.
Nor should every market be assigned the same weekend collection day. Use the schedule for the actual instrument. The practical guide to holding spread bets overnight covers the wider decisions around carrying an open position.
Opening shortly before a cutoff may have a different funding result from opening shortly after it. The comparison should follow the contractual trigger rather than assume that the charge is proportional to the number of hours the position was open.
Closing before the cutoff and reopening later also needs a full cost calculation. It may avoid a funding debit under the applicable terms, but the replacement trade can create another spread cost and a different entry price. A funding saving is not a saving if the method used to obtain it costs more.
Can a Narrower Spread Be More Expensive?
The next calculation combines funding with a simplified dealing spread. It compares two invented pricing schedules, not two brokers. Both use the same £20,000 exposure and £2 stake per point.
Schedule A has a one point spread and an 8% annual funding rate. Schedule B has a three point spread and a 6% annual funding rate. Assume an unchanged market midpoint and stable spreads, so the combined opening and closing spread cost equals one full quoted spread: £2 for A and £6 for B.
| Chargeable days | Schedule A: £2 spread cost, 8% funding | Schedule B: £6 spread cost, 6% funding |
|---|---|---|
| 0 | £2.00 | £6.00 |
| 1 | £6.38 | £9.29 |
| 7 | £32.68 | £29.01 |
| 30 | £133.51 | £104.63 |
Schedule A starts £4 cheaper. Schedule B then saves approximately £1.10 for each funding day. The calculated cost crossover is 3.65 days, making B cheaper from four chargeable days in this simplified comparison.
Crossover days = extra spread cost ÷ daily funding saving
£4 ÷ (£20,000 × 0.02 ÷ 365) = 3.65 days
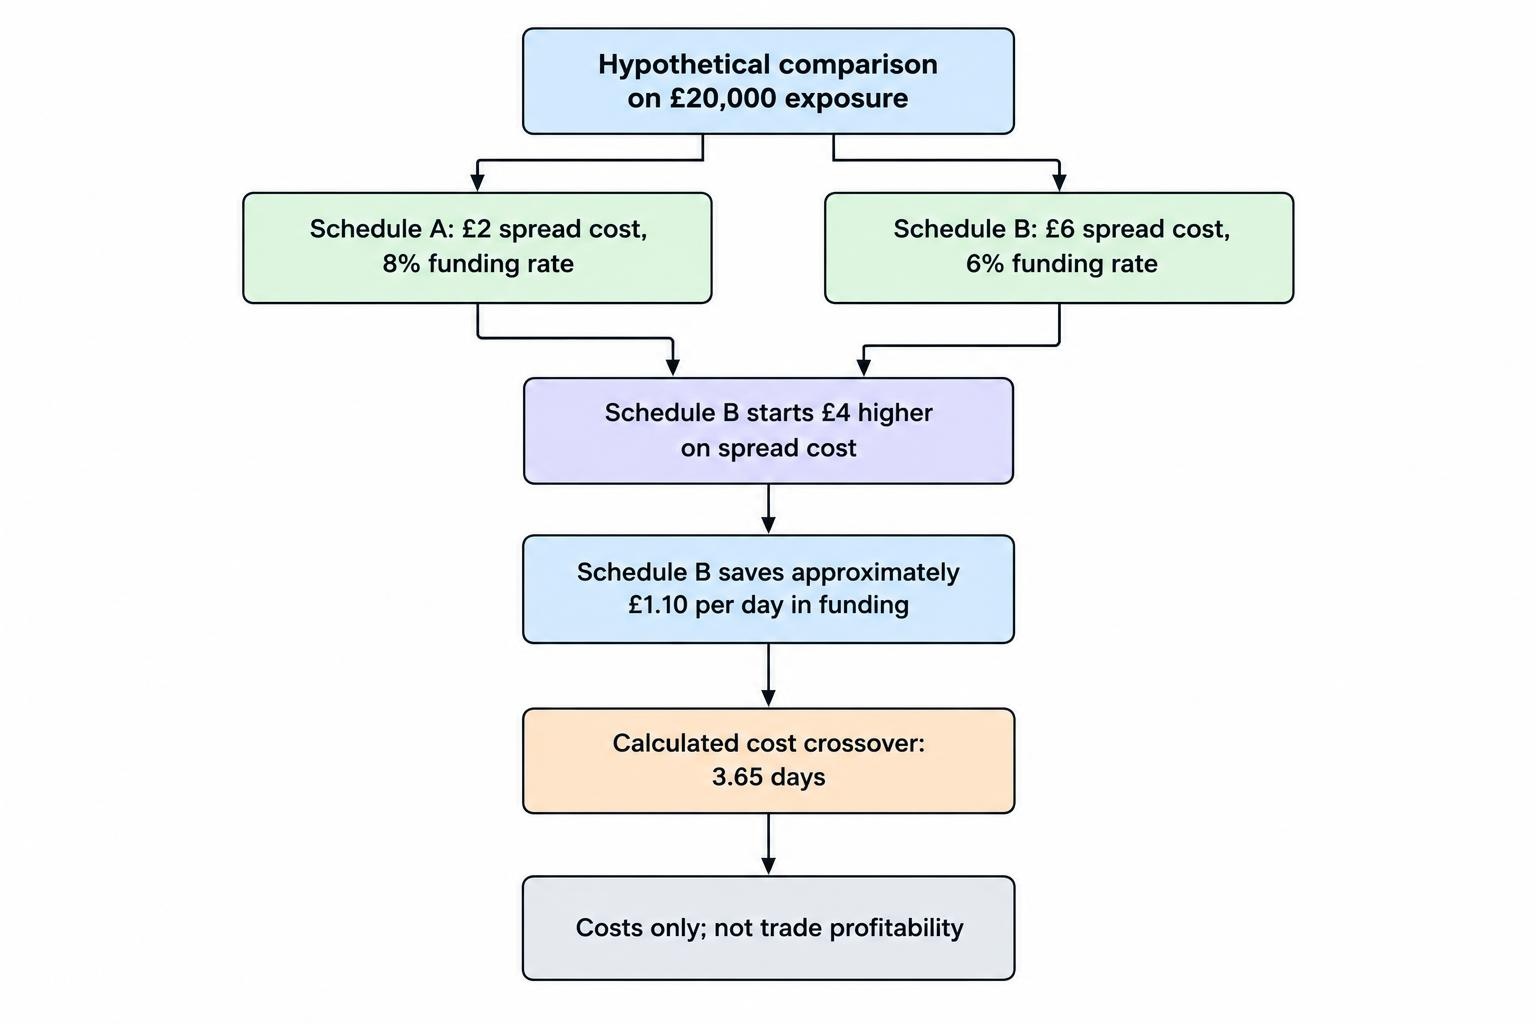
This is a cost crossover, not the point at which the trade becomes profitable. It also assumes identical exposure, execution and other charges. Real comparisons need the full holding period and fee structure, as covered in comparing total spread betting costs.
The calculation exposes a weakness in ranking providers by minimum spread alone. A spread measure answers a dealing cost question. It does not answer a month long holding cost question.
Daily Funded Positions Versus Futures and Forwards
A position with no separate overnight debit should not automatically receive a zero financing cost in a study. The economic cost may be reflected in the contract price rather than posted as a daily account entry.
For equity index futures, theoretical fair value incorporates the cash index, interest rates, expected dividends and time to expiry. The CME Group equity index fair value calculation shows that relationship. It also distinguishes theoretical fair value from the price at which a contract actually trades.
That distinction prevents a misleading comparison: daily funded contract with a visible £100 charge versus dated contract with no visible funding entry, therefore a £100 saving. The second contract may carry financing through its price and the change in its relationship with the cash market.
Compare the same economic exposure over the same intended period. Allow for dealing spreads, changes in the relationship between cash and futures prices, dividend treatment and any rollover transactions. Do not add an estimated embedded financing amount to a realised contract result if that would count the same effect twice.
The detailed comparison of daily funded bets and futures addresses the product choice. Here, the research point is that statement visibility and economic cost are different measurements.
A dated contract also introduces a boundary to the holding period. If the planned trade extends beyond it, the study must specify whether the position closes, settles or rolls. Those mechanics belong in the assumptions before the cost comparison begins.
Check the relevant spread betting expiry dates rather than assuming a dated position can be held indefinitely on unchanged terms.
Where the Simple Model Needs Adjustment
Foreign exchange positions
A single sterling benchmark plus adjustment is not a suitable universal model for currency pairs. FX forward pricing involves the two currencies’ interest rates, and market pricing can depart from a simple interest differential. The BIS analysis of FX swaps and forward pricing sets out that relationship and the role of the currency basis.
For an FX funding study, record the pair, direction, point size, quoted rollover amount, accrual days and currency conversion method. A monetary charge per day or per point may be more faithful to the contract than forcing the result into the cash index formula.
Long and short positions must be captured separately. One side’s rate cannot safely be obtained by reversing the sign of the other. The guide to how forex spread betting works provides the market mechanics outside this study’s scope.
Share positions
A share funding comparison should keep financing, dividend adjustments and any separately quoted borrowing charges in different fields. Combining them into one net account movement makes it difficult to identify what changed.
The share price also needs consistent units. A stake defined per penny cannot be multiplied by a price expressed in pounds without conversion. The wider share spread betting cost guide covers costs beyond overnight funding.
Commodity pricing and account currency
Exclude a commodity contract from the simple benchmark model if its terms use a different adjustment method. Where a schedule distinguishes a futures related price adjustment from an administration charge, preserve that distinction. Treating the entire adjustment as a provider fee can misstate the comparison.
Also distinguish the currency of the quoted charge from the account currency. If conversion is required, record the exchange rate and any conversion charge separately. Otherwise, currency movement can look like a funding rate change.
The guide to currency conversion costs covers that additional expense. The central sterling model avoids it rather than assuming it is always zero.
Short Positions and Matched Trades
A short position does not automatically earn the long funding charge in reverse. To illustrate the difference, assume a symmetrical pricing arrangement with a 4% reference rate and a 2.5 percentage point provider adjustment.
Under that invented arrangement, the long position pays 6.5%. The short position receives 1.5%, calculated as the reference rate less the adjustment. On £20,000 over 30 days, that produces a £106.85 long debit and a £24.66 short credit.
If both positions remain open at equal size, their combined funding cost is £82.19 despite offsetting directional exposure. The reference rate cancels in this model; the two provider adjustments do not. Spreads and other charges are excluded.
A lower assumed reference rate can change the short credit into a debit. With a 1% reference and the same 2.5 percentage point adjustment, the short side would pay 1.5% under this arrangement. These are mathematical examples, not descriptions of a particular provider.
The FCA’s 15 October 2026 feedback on CFD firms’ pricing practices reported continuing concerns about overnight charges, their disclosure and charges on matched long and short positions. Its scope expressly includes spread bets. The feedback also noted considerable variation between firms and assets, reinforcing the need to inspect both sides of a funding schedule.
The practical distinction is between reducing market exposure and eliminating carrying costs. Keeping two offsetting contracts open can do the former without doing the latter. That matters when assessing hedging with spread bets, although not every hedge consists of matched contracts on the same asset.
A comparison should therefore report gross open exposure as well as net exposure. A net figure of zero can conceal two positions that still generate charges.
How to Reconcile an Actual Funding Charge
A statement reconciliation should start with the contract and the accrual period, then work back to the amount. Starting with an assumed annual percentage and searching for a matching debit is less reliable.
Keep the following information for each calculation:
- Contract identity: market, cash or dated version, direction and stake.
- Funding base: the price or notional amount required by the contract’s calculation method.
- Applicable rate: benchmark, provider adjustment, effective date and any daily quoted equivalent.
- Accrual period: cutoff, time zone, calendar days covered and weekend or holiday treatment.
- Posted result: debit or credit, currency, rounding and any separate adjustment.
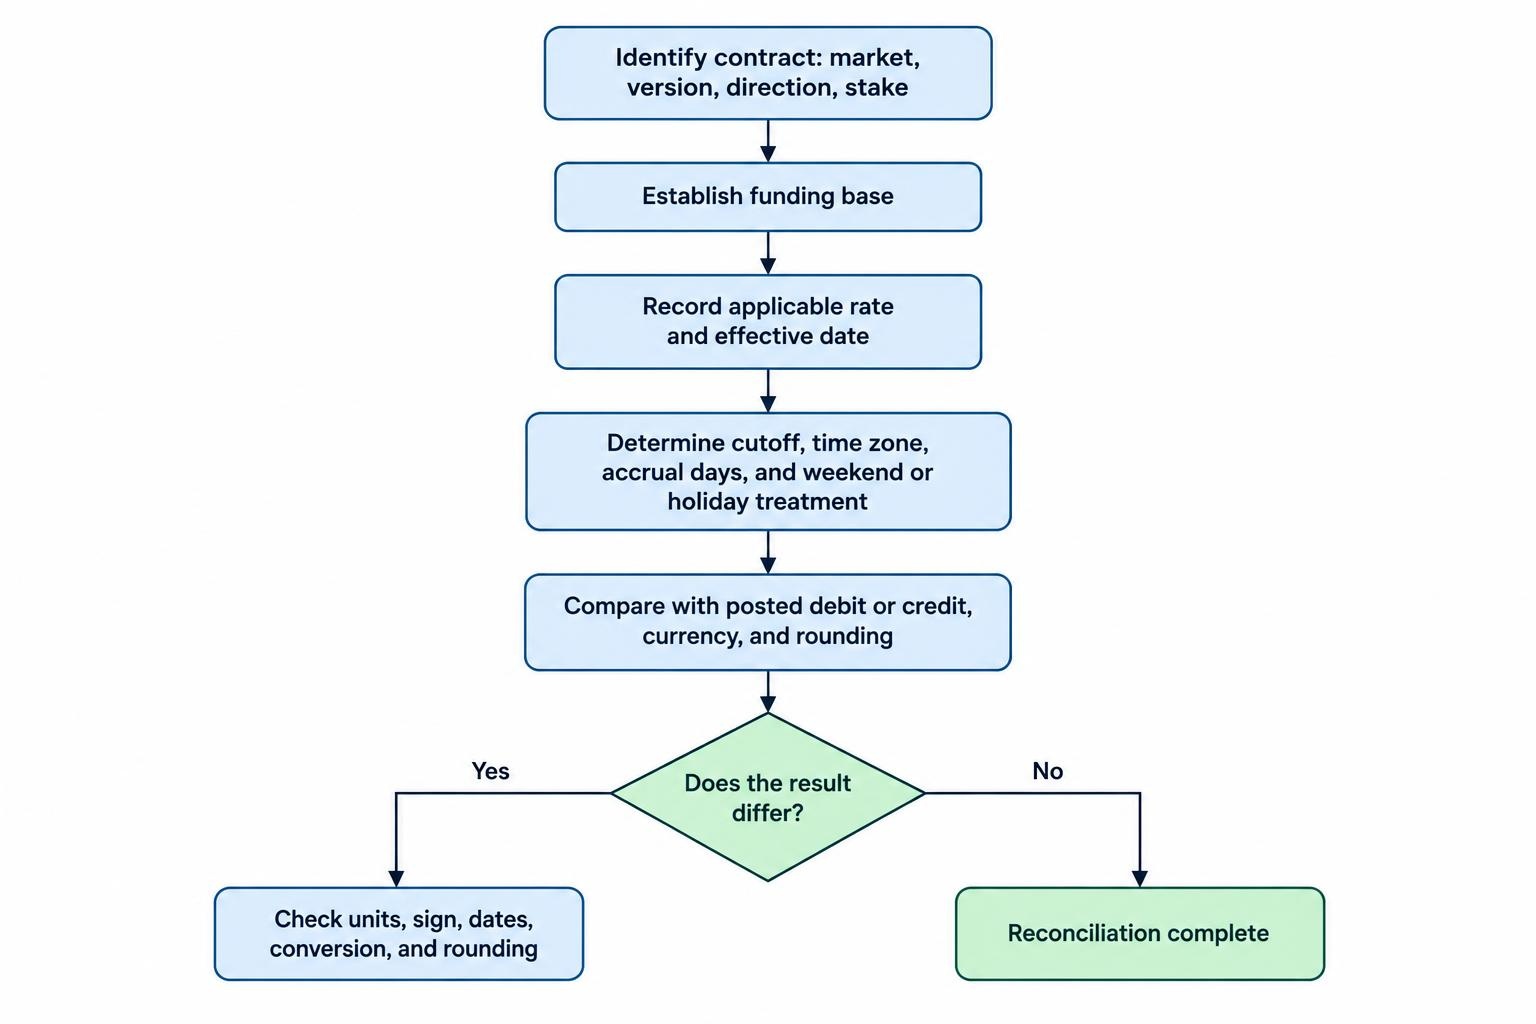
The guide to spread betting account statements covers the surrounding account entries. For funding research, retain the charge’s own description rather than grouping every overnight adjustment together.
Calculate an implied annual rate
Where the simple notional model applies, an observed charge can be converted into an annualised equivalent:
Implied annual rate = charge × annual day count ÷ (notional exposure × accrual days)
A £10.68 debit covering three days on constant £20,000 exposure gives:
£10.68 × 365 ÷ (£20,000 × 3) = 6.497%
The small difference from 6.5% comes from using a charge rounded to pennies. It is not evidence of an undisclosed fee.
Where exposure or rates change, calculate each period separately before adding the results. For a constant rate with changing exposure, an implied rate can use the sum of each exposure amount multiplied by its applicable accrual days.
If the reconstruction still differs, check units, sign conventions, dates, conversion and rounding before drawing a pricing judgment. If the terms do not identify the charging basis clearly enough to reproduce the amount, record that uncertainty rather than inventing a missing input.
What Funding Does to a Trading Budget
Funding changes the price move needed to leave a net profit. It should therefore enter the trade plan before the position opens, not appear later as an unexplained reduction in account equity.
Return to the £2 per point central scenario. Assume a favourable 100 point midpoint move, worth £200 before costs, and a two point combined spread cost of £4. After £106.85 of funding over 30 chargeable days, the remaining profit is £89.15.
With only a 40 point favourable move, the gross gain is £80. Deducting the same spread and funding costs leaves a £30.85 loss. A correct directional view is not the same as a profitable trade.
The central funding charge requires approximately 53.42 points of favourable movement. Adding the assumed two point spread raises the total hurdle to approximately 55.42 points, before other charges.
A cash budget can also translate into a maximum modelled accrual period. With a £50 funding allowance and an unrounded daily charge of about £3.56, the allowance covers approximately 14.04 days. Fourteen full funding days remain within that budget; fifteen exceed it.
This is a planning threshold, not an automatic instruction to close a position. A decision still needs to consider the trade’s remaining case, execution costs and market risk. Nor does a funding allowance replace a loss limit.
Funding also reduces the cash available to support an open position in this model. Its interaction with account headroom belongs in the assessment of margin risk, especially where positions remain open through several charging periods.
The useful question is not simply whether the daily fee looks small. It is whether the expected trade outcome still makes sense after allowing for the intended holding period and a reasonable extension if the move takes longer than planned.
Using the Results Without Overstating Them
The calculations establish a consistent pattern: under unchanged terms, financing rises with exposure, the annual rate and chargeable time. They also show how a cheaper spread can lose its advantage over a longer holding period. Those are results of the stated assumptions, not measurements of provider performance.
A broker ranking would require a separate dated dataset covering comparable contracts, directions, rates, charging schedules and account terms. It would need to distinguish published estimates from charges reconstructed from actual statements. This study supplies neither dataset and makes no such ranking.
For a practical comparison, replace the assumed inputs with the contract’s documented terms, calculate the intended holding period and test a longer one. Keep daily funded and dated contracts economically comparable, and show both debit and credit schedules where relevant.
The wider spread betting research collection separates funding analysis from spreads, execution and other costs. For an individual position, the useful output is a reproducible cash estimate: the exposure being financed, the days being charged and the amount that must be earned before the trade moves into profit.