Broker execution quality is the difference between the trade you requested and the trade you actually received. For a spread bettor, that means assessing the fill price, the time taken to confirm the order, whether it was accepted, and how the broker handled changing prices.
A narrow advertised spread tells only part of that story. A broker can quote tightly but deliver worse results through adverse slippage or repeated rejections. Another can appear more expensive on the deal ticket yet provide more consistent fills. The comparison needs to cover both price and reliability, without confusing normal market movement with a broker fault.
This article sets out a practical research method for evaluating spread betting execution. It does not present live broker test results or rank providers using an unpublished dataset. All numerical comparisons below are hypothetical. Within our spread betting research, execution should be assessed separately from funding charges, market coverage and other account features.
What broker execution quality actually measures
Execution quality measures how effectively a broker turns an instruction into the intended position, subject to the order’s conditions. The best assessment follows the whole process: the quote available before submission, the instruction sent, the broker’s response and the resulting account position.
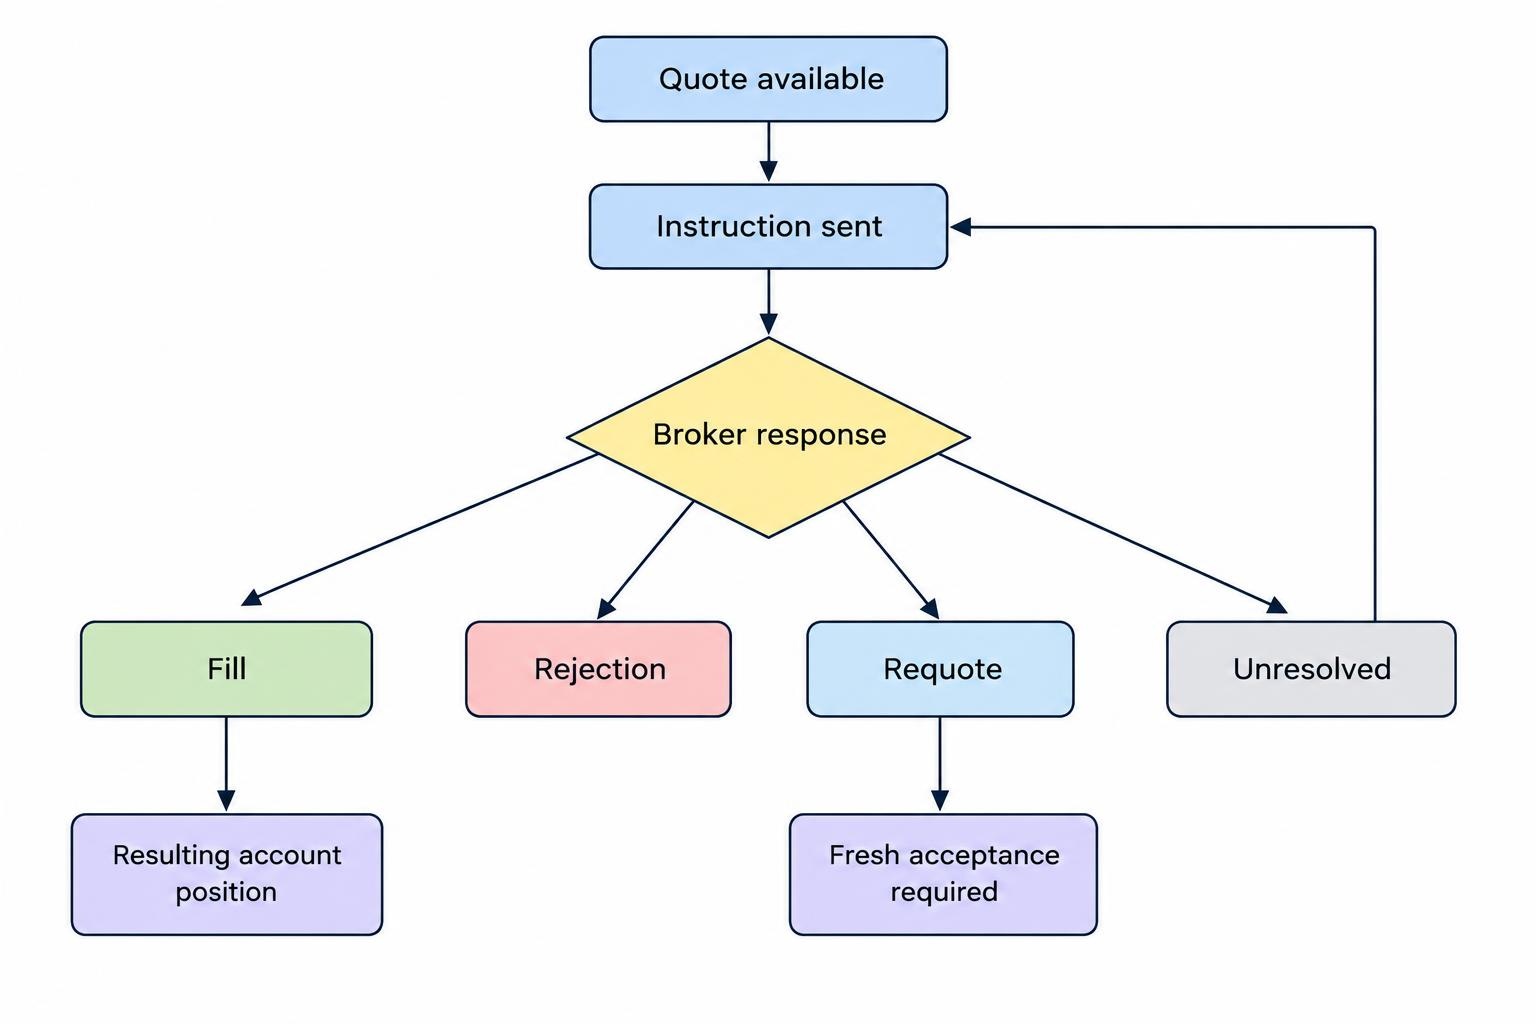
Financial spread betting involves a contract with the provider rather than direct ownership of the underlying asset. The provider’s quote and contract terms therefore matter when evaluating a fill. A price on an exchange or another platform can help check the result, but it is not automatically a price at which your spread bet was executable. The distinction follows from how spread betting contracts work.
For UK business within scope, the FCA’s best execution rules require firms to take all sufficient steps to obtain the best possible result, considering price, costs, speed, likelihood of execution and settlement, size and the nature of the order. Retail results are assessed by total consideration: price plus execution costs. The rules also require checks on the fairness of OTC prices; dealing as principal does not itself remove best execution obligations. These requirements sit in FCA Handbook COBS 11.2A on best execution.
That is not a promise that every transaction will receive the best price visible anywhere. A practical assessment asks whether the broker’s arrangements and actual outcomes stand up to scrutiny. One awkward fill deserves investigation. It does not, by itself, establish a pattern or prove misconduct.
The execution measures worth collecting
Do not reduce execution quality to a single speed figure or a percentage of orders filled at the requested price. Each measure answers a different question, and some can look better simply because the broker accepts fewer difficult orders.
| Measure | What to record | What it helps assess |
|---|---|---|
| Fill price | The completed price against a defined, relevant reference quote. | Whether execution improved or worsened the requested dealing price. |
| Slippage | Favourable, unchanged and adverse outcomes, including their size. | The frequency and financial effect of price differences. |
| Execution time | Elapsed time between clearly identified submission and response events. | Typical delays and unusually slow responses. |
| Acceptance and rejection | Every submitted attempt, its outcome and the stated reason. | Whether the broker accepts valid instructions consistently. |
| Requotes | Replacement prices requiring a fresh acceptance. | How often the initial dealing request cannot proceed as submitted. |
| Order handling | Trigger, amendment, cancellation and fill records. | Whether each order followed its stated conditions. |
| Operational reliability | Disconnects, stale displays, unresolved requests and recovery steps. | Whether the account remains usable when action is needed. |
Keep both price and money measures. A fraction of a point may look harmless until multiplied by the stake and repeated across entries and exits. Conversely, a large monetary loss on a large position does not necessarily mean execution was poor. Position size and execution quality are separate questions.
Report the market, product, stake, order type and session beside these measures. “Average slippage across all trades” is a weak comparison if one account contains quiet daytime index trades and another contains orders placed around economic announcements.
Choose the right price benchmark
Compare buys with offers and sells with bids
The reference price must match the instruction. A buy should normally be compared with the relevant offer, while a sell should be compared with the relevant bid. Comparing a buy fill with a midpoint builds part of the spread into the apparent slippage.
Suppose a market is quoted at 7,999.4–8,000.6. The midpoint is 8,000 and the spread is 1.2 points. A buy filled at 8,000.6 has received the displayed offer. It has not suffered 0.6 points of slippage just because the chart shows the midpoint. This is a measurement issue, not a trading mystery; the bid and offer mechanics of spread betting determine the starting comparison.
Record both sides of the quote even when reviewing only one side. That allows you to distinguish a change in the market’s centre from a change in its spread. Without both prices, an apparent price deterioration can be difficult to explain.
Separate the displayed quote from the quote at receipt
A quote captured when you click and a quote recorded when the broker receives the instruction answer different questions. The first measures the result against what you saw. The second helps examine what happened after the request reached the broker.
Neither should silently replace the other. Label them clearly. If only a screen recording is available, describe the result as a comparison with the displayed quote, not a forensic reconstruction of the broker’s server activity.
An independent market feed provides another check, but its timestamps, delay, price type and product must be known. A cash index, a futures contract and a broker’s out-of-hours index quote are not interchangeable benchmarks. Similar names do not make them the same instrument.
Match the trading session and contract
Check whether the underlying market was open, in an auction, halted or outside its main session. A comparison made during normal underlying trading hours should not be pooled without explanation with one made overnight. Our guide to spread betting trading hours covers the distinction between provider availability and underlying market hours.
Also record whether the spread bet is daily funded or expiry dated. Financing, dividends and contract basis can affect price relationships. Before treating a difference as an execution problem, confirm that the reference describes the same economic exposure at the same time.
Measure slippage in both directions
Slippage is the difference between the chosen reference price and the fill price. It can favour the client or work against them. An execution review should preserve both outcomes rather than reporting only the trades that hurt.
Use a consistent sign convention. One practical approach makes adverse slippage positive and favourable slippage negative:
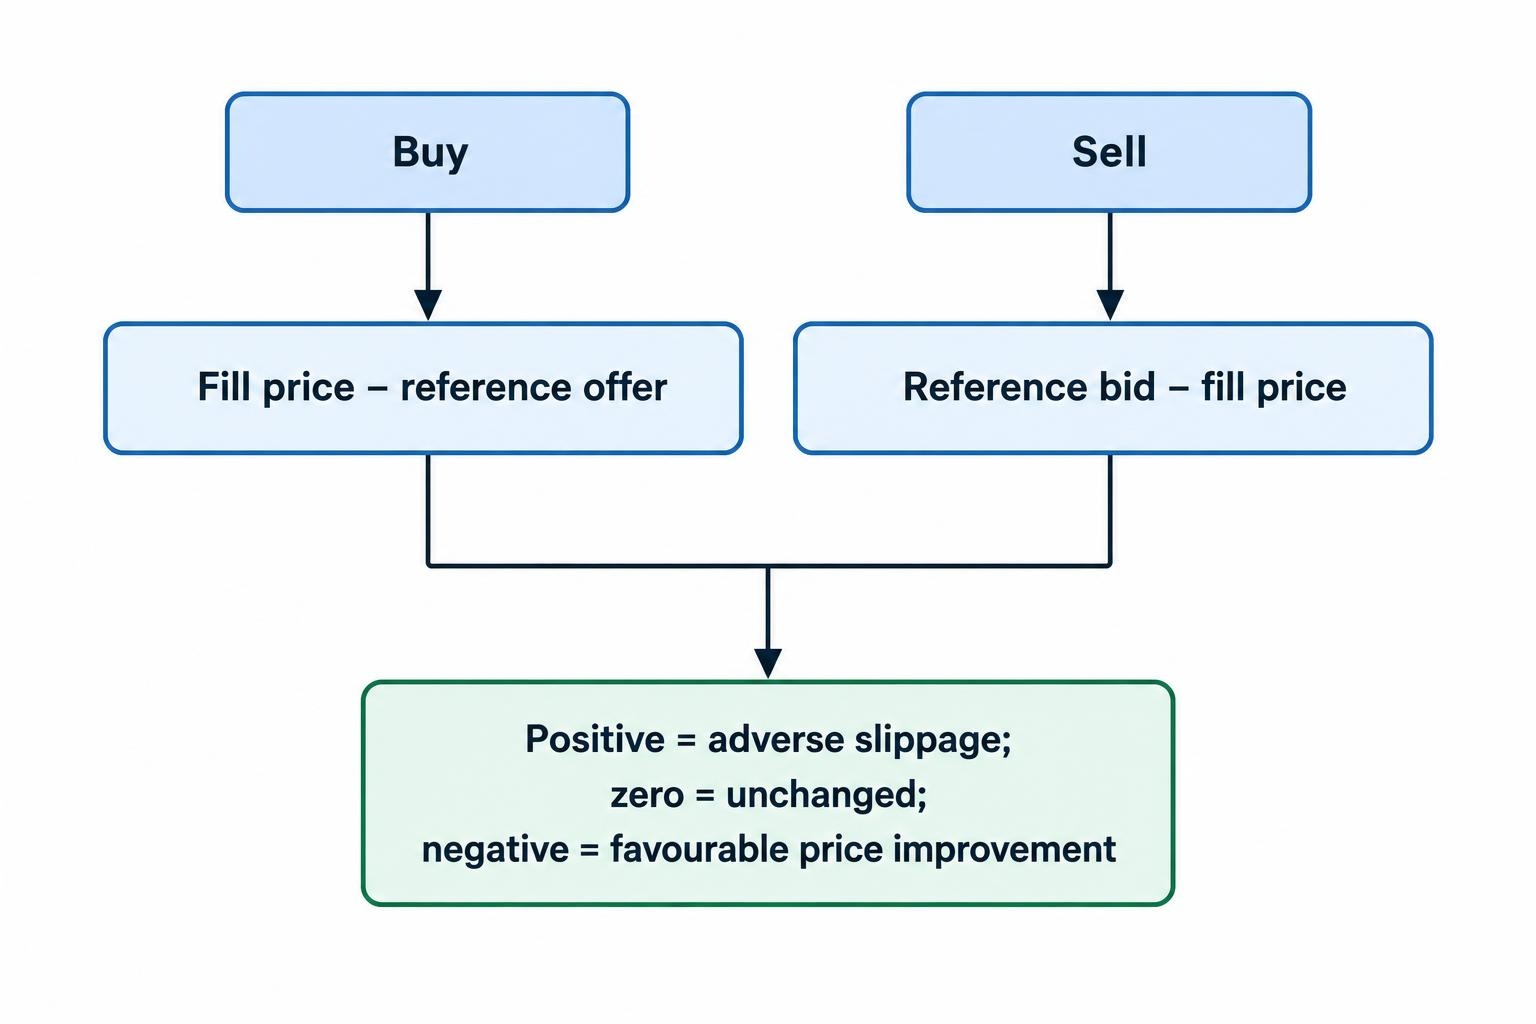
Buy slippage = fill price − reference offer
Sell slippage = reference bid − fill price
If the reference offer is 8,000.6 and a buy fills at 8,000.9, adverse slippage is 0.3 points. If the reference bid is 7,999.4 and a sell fills at 7,999.1, adverse slippage is also 0.3 points. At £10 per point, either difference costs £3 relative to its reference.
A buy filled below its reference offer produces a negative result under this convention: price improvement. State the convention prominently because some platforms and reports use “positive slippage” to mean a favourable outcome. The terminology should not reverse halfway through a spreadsheet. Our explanation of slippage covers the underlying mechanics.
Calculate the proportion of favourable, unchanged and adverse fills, then report the average size within each group. A broker with frequent tiny improvements and occasional large adverse fills can look attractive on a frequency statistic while still delivering a net execution cost.
Asymmetric slippage is a separate concern: adverse movements reach the client while favourable movements are retained by the firm. This practice was identified as a risk in the IOSCO report on retail OTC leveraged products, archived by the CSRC. That report is an international regulatory toolkit, not a standalone statement of current UK rules.
Unequal favourable and adverse fill counts do not establish that practice. Order selection can create an imbalance: stop orders, breakout entries and orders sent into fast moves differ from passive limit orders. Investigate matched conditions before drawing a finding about the broker’s treatment.
For the financial assessment, multiply each price difference by its actual stake. Keep this monetary result alongside the points measure, as set out in our guide to the cost of slippage.
Execution speed needs a defined clock
“Executed in milliseconds” is incomplete without a start event and an end event. A broker may measure processing from server receipt to fill. A trader may measure from pressing the dealing button to seeing confirmation. Both can be legitimate measurements, but they cover different parts of the process.
For a client-side review, record the time the instruction was sent and the time a definite outcome appeared. Where available, retain separate acknowledgement and fill timestamps. An acknowledgement confirms receipt; it does not necessarily confirm execution.
Do not compare one broker’s server processing figure with another broker’s full client response time. The latter includes additional stages. Even within a personal log, a change of device or network can make a before-and-after comparison misleading.
Report the median response time, a slower percentile such as the 95th percentile, and the longest observed delay. The median describes a typical request. The slower percentile helps reveal whether a minority of requests take much longer. With a small sample, those tail measures are unstable, so publish the number of observations beside them.
Keep the measurement precision honest. A screen recording with coarse timestamps does not justify a result quoted to the nearest millisecond. More decimal places cannot rescue a blunt measuring tool.
Assess delay beside price and acceptance. A fast rejection is not a fast fill, and a quick confirmation at an unexpectedly poor price is not automatically good execution. A useful report shows how these outcomes interact rather than awarding speed a trophy of its own.
Count rejected orders, requotes and unresolved requests
Execution research should begin with submitted instructions, not just completed trades. A history export containing only fills can hide the requests that were rejected or never reached a clear outcome.
For a defined group of eligible requests:
Rejection rate = rejected requests ÷ submitted requests × 100
Define “eligible” before examining the results. A rejection caused by insufficient margin is not the same as a valid market order rejected during ordinary dealing. Keep both in the raw log, but classify the reasons rather than combining them into an unexplained failure rate.
Useful categories include price unavailable, market closed, stake outside permitted size, insufficient funds, invalid order distance and technical error. Preserve the broker’s original message alongside your classification. Do not turn an unexplained error into a confident diagnosis.
A requote also differs from a rejection. It presents a replacement price that needs acceptance. Record whether the new price was accepted, declined or expired, and whether it improved or worsened the original request.
Track retries in two ways. An attempt-level measure counts each submitted request. A parent-instruction measure follows the trader’s original intention through any retries. Without that distinction, five failed attempts followed by one fill can appear either as a heavily disrupted instruction or simply as one successful trade.
Unresolved status deserves its own category. If the screen freezes after submission, establish whether an order exists before sending it again. Otherwise, an execution investigation can turn into a duplicate-position problem.
Missed trades also need careful treatment. A rejected entry that would later have made money does not create a directly observed execution loss of that amount. Any estimate of the missed opportunity depends on assumptions about entry, exit and subsequent decisions. Keep it separate from actual fill-price costs.
Assess each order type on its own terms
Market orders, limits, stops and guaranteed stops impose different conditions. A fair review cannot score them all against the same “requested price” test. Start with the instruction’s purpose and the broker’s documented handling rules. The broader spread betting order types guide provides the supporting mechanics.
Market orders
A market order prioritises dealing rather than fixing a maximum purchase price or minimum sale price. Review the available quote, submission time, accepted size, fill and response delay. Do not assume the displayed price was contractually guaranteed unless the order terms actually provided that protection.
Separate entry market orders from urgent exits. Pooling them can conceal a problem affecting only one part of the trading process. Also distinguish an ordinary market instruction from a platform feature that imposes a price tolerance.
Limit orders
A limit order sets a price boundary, but non-execution is not automatically a failure. The relevant dealing side may not have reached the limit, or the order may not have been active when the apparent touch occurred. A chart’s midpoint touching a buy limit does not establish that the offer reached it.
Record when the order became active, its expiry, any amendments and the trigger or execution conditions. Review how limit orders work before treating an unfilled order as a poor fill.
Ordinary stop losses
For an ordinary stop, distinguish the trigger level from the eventual execution price. A stop can trigger at its stated level and execute beyond it. The investigation needs the relevant bid or offer history, the trigger timestamp and the fill timestamp, not just a chart screenshot.
A price gap is a different situation from continuous trading through a stop. Assess the available dealing prices and the order terms rather than assuming the stop level was an available exit. Our guide to stop-loss orders addresses this trigger-versus-fill distinction.
Guaranteed stops
Assess an accepted guaranteed stop against its contractual protection, including its level and applicable conditions. Keep any premium separate from slippage. A premium pays for a different execution promise, so combining guaranteed and ordinary stops in one average obscures rather than improves the comparison.
Check whether the guarantee remained attached after amendments and whether the account record confirms acceptance. The relevant details are covered in our guide to guaranteed stop-loss orders.
Build a comparison that another reader could reproduce
A useful execution review needs a written protocol before it needs a score. Decide what will be measured, which requests belong in the sample and how exceptions will be handled. Otherwise, the method can drift to favour whichever result looks most convincing.
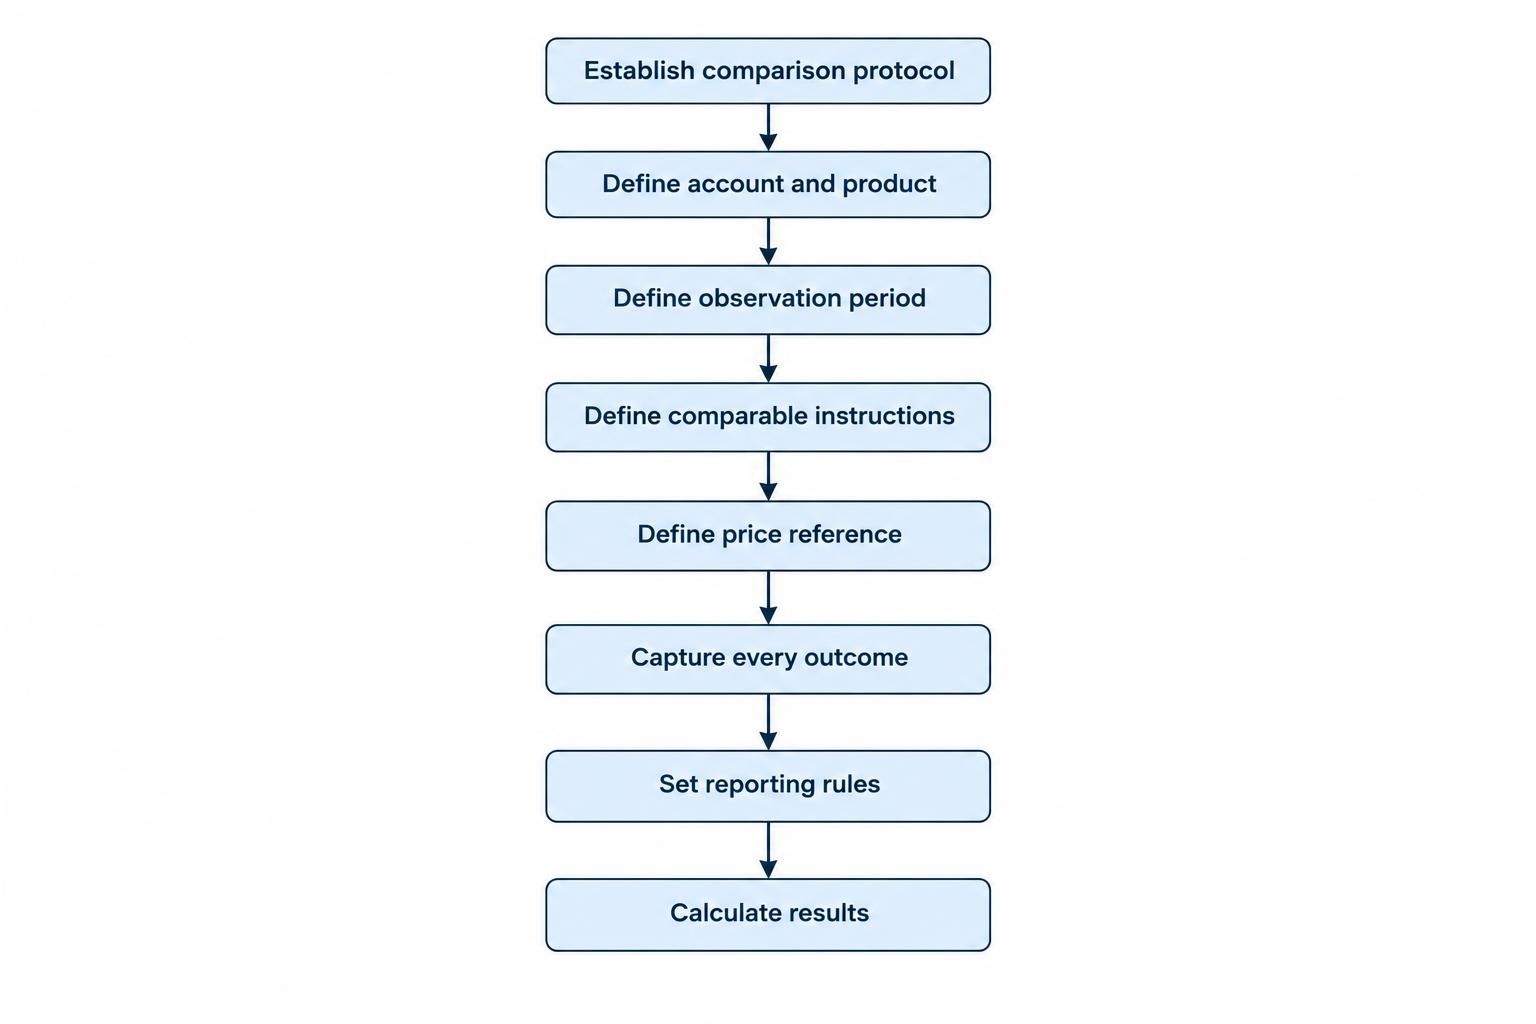
- Define the account and product. Record the contracting entity, client classification, platform, exact market name, contract type and point value.
- Define the observation period. State dates, sessions and whether scheduled announcements or underlying market openings are included.
- Define comparable instructions. Separate order types, directions, entry and exit requests, and stake bands.
- Define the reference. Identify the quote source, bid or offer side, timestamp convention and known data delays.
- Capture every outcome. Include fills, rejections, requotes, cancellations and unresolved requests, with original records retained.
- Set the reporting rules. Decide how missing data, retries, outliers and exclusions will appear before calculating results.
Use representative observations, not manufactured activity
Do not place unnecessary leveraged trades simply to build a larger sample. Start with existing transaction records, documented broker disclosures and observations from trading that would otherwise have taken place. If evidence is insufficient, the honest finding is that the comparison remains incomplete.
Execution research does not justify increasing stake size. The amount at risk must remain a separate decision, using a defensible position sizing method. A cleaner dataset is not worth an avoidable account loss.
Match the sample to the intended use. An assessment based on small index stakes during the main session should not be presented as evidence about large single-share orders or overnight exits. State what the observations cover and what they do not.
Separate demo and live evidence
A demo account can help check the interface, identify available order settings and practise collecting records. It does not establish how a live account will execute. Treat demo observations as a separate evidence category, even if the screens look identical.
Our guide to spread betting demo accounts covers their role in platform assessment. In execution research, their most useful contribution is preparation, not proof of live fill quality.
Acknowledge the timing problem between brokers
Two manually submitted orders at different brokers will not arrive at precisely the same instant. If the market moves between requests, the second fill may differ for reasons unrelated to broker performance.
Measure each result against its own contemporaneous quote and record the submission sequence. Where an existing observation programme permits, alternate which provider is checked first. Do not claim that this removes timing bias; it only avoids always placing the same broker second.
Opening offsetting positions at two providers is not a cost-free testing shortcut. Both contracts can incur dealing costs, margin requirements and account-level risks. A research method should disclose these complications, not encourage extra trading to create the appearance of a controlled experiment.
Keep an audit trail, not just a spreadsheet
A spreadsheet summarises evidence. It should not be the only evidence. Retain original confirmations, order identifiers, available platform logs and screenshots showing the dealing context. Preserve the version of the execution policy and contract terms relevant to the observation period.
Use a consistent timezone, preferably one explicitly recorded in every export. Document daylight-saving treatment. If a platform displays local time while a market feed uses UTC, convert deliberately and retain the original values.
Record missing fields rather than filling them with guesses. If the platform supplies only whole-second timestamps, mark that precision. If the bid and offer were not captured before submission, do not reconstruct them from a later chart and label the result as observed.
Reconcile completed fills with the account history. Partial closures, amended orders and multiple fills can otherwise become duplicate or missing rows. Our guide to spread betting account statements helps identify which records represent orders, transactions and account adjustments.
Maintain an exclusion log. Remove a corrupted record from a calculation if necessary, but retain its identifier and the reason. If missing observations cluster around volatile periods or technical failures, the omissions themselves matter to the interpretation.
Report distributions rather than one flattering average
An average can hide both the normal experience and the worst disruptions. Report the median, mean and a slower or worse-outcome percentile where the sample supports it. Show the number of observations behind each figure.
For slippage, publish favourable and adverse results separately before presenting the signed net average. That makes it possible to see whether a low net figure reflects consistently close fills or large gains and losses cancelling each other out.
Use both equal-weight and stake-weighted views. An equal-weight average gives each fill the same importance. A monetary total reflects the effect on the sampled account. Neither replaces the other: one large order can dominate the cash result without representing the usual experience.
Break results into sensible groups, such as market, session, order type and stake band. Avoid slicing a small dataset into so many categories that each contains only a handful of requests. Apparent precision can become a formatting exercise.
There is no universal number of trades that turns a personal log into a reliable broker ranking. A large collection from one quiet session still says little about other conditions. Publish the dates, coverage and uncertainty instead of treating sample size as a quality stamp.
Also examine changes over time. A pooled average may hide a deterioration after a platform update or a change in the markets being traded. Mark known changes in the record and avoid attributing every difference to the broker without checking the sample composition.
Keep spread observations distinct from execution outcomes. Research into broker spreads answers what was quoted; execution research answers what happened to the submitted instruction. The two datasets become more useful when joined by matching timestamps and product definitions.
A worked comparison of execution cost
The following example is entirely hypothetical. It illustrates how a tighter quote can still produce only a modest cost advantage once fills are considered. It is not a finding about any named provider.
Assume comparable completed round trips on the same index, each at £5 per point. For each round trip, the spread contribution combines the entry-side distance from the midpoint and the exit-side distance from the midpoint. Slippage is then measured against the relevant dealing quote at each submission. This avoids counting the spread twice.
| Cost component | Broker A | Broker B |
|---|---|---|
| Spread contribution | 1.00 point | 1.40 points |
| Net adverse entry slippage | 0.25 points | 0.05 points |
| Net adverse exit slippage | 0.15 points | 0.05 points |
| Total execution cost | 1.40 points | 1.50 points |
| Cash cost at £5 per point | £7.00 | £7.50 |
Broker A’s spread contribution is 0.40 points lower, but its extra slippage uses up 0.30 points of that advantage. Its remaining saving is 0.10 points, or 50p per completed round trip at this stake.
That result alone would not settle the broker choice. The table assumes completed trades and says nothing about rejected requests, delayed exits, unusually poor fills or the availability of the intended market. Those outcomes need their own reporting.
Nor does the table describe strategy profitability. Execution cost is measured relative to the selected price references, not the market movement between entry and exit. Financing, premiums and other charges are excluded here to keep the execution calculation readable.
A proper comparison should show those exclusions beside the numbers. Otherwise, a useful cost illustration can be mistaken for a complete account-cost estimate.
Read execution claims and policies critically
Marketing descriptions such as “instant execution”, “institutional liquidity” or “no dealing desk” are not measurements. Treat them as prompts for questions, not substitutes for observed outcomes.
Ask what “instant” measures, which orders are included, whether the figure covers live accounts and what happens during volatile periods. A statistic excluding rejected orders may describe processing among successful fills, not the experience of all submitted requests.
For published slippage figures, look for the reference price, the sign convention, the observation period and the denominator. Check whether the report separates order types and whether price improvement is measured on the same basis as adverse slippage.
Read the execution policy for practical answers: how the quote is formed, when an instruction becomes accepted, what can cause a rejection, how stops trigger and whether a price tolerance changes the treatment of an order. Vague wording should leave a question open rather than earn an assumption in the broker’s favour.
Check the contracting entity rather than relying on the brand name. Keep any execution evidence tied to that entity, account type and platform. Our research on broker legal entities provides the framework for making that distinction.
Execution evidence also does not replace basic authorisation checks. Use the separate process for checking a broker on the FCA Register before treating a UK-facing brand as the appropriate contracting firm.
Include platform reliability without misdiagnosing the cause
Execution depends on more than the dealing engine. A frozen ticket, stale quote display or missing confirmation can prevent the trader from acting confidently even when the account itself remains active.
Log the symptom before assigning blame. Record the time, device, app or browser version, connection type and whether other parts of the platform worked. If available, retain the broker’s service-status notice and incident response.
A client-side recording can show that the screen stopped updating. It cannot, on its own, establish whether the cause was the device, network, data feed, platform or broker infrastructure. That distinction matters when comparing providers.
Assess recovery as well as disruption. Could the trader establish whether the order had executed? Was there a clear account record after reconnection? Could an existing position be managed through a documented alternative channel?
Do not score an incident solely by whether the affected trade later won or lost. The operational question is whether the platform provided reliable status and control. A lucky market move does not make an unresolved instruction acceptable research evidence.
Investigating a disputed fill
Build the enquiry around one identifiable instruction. Supply the order number, exact product, direction, stake, order type, relevant price, timestamp and observed outcome. Include the timezone and explain where your reference quote came from.
Ask the broker to distinguish receipt, trigger, execution and confirmation events. For a stop dispute, request clarification of the triggering price side and the applicable order conditions. For an apparent quote discrepancy, ask which product and price basis should be used for comparison.
Keep the questions neutral. “The buy filled 0.8 points above the offer captured at submission; please explain the intervening events” is more useful than an accusation unsupported by timestamps. It gives the firm a defined result to address.
Review the explanation against the original evidence and policy. If the response relies on market movement, check whether it identifies the relevant time interval rather than offering volatility as a catch-all answer. If records conflict, preserve both versions.
Where the issue remains unresolved, keep the execution evidence separate from assumptions about the profit the trade might have made. The guide to spread betting complaints and the Financial Ombudsman covers the wider complaint route. This execution review is about assembling a clear record, not predicting the outcome of a claim.
Use execution evidence alongside total cost and risk
Execution quality can distinguish two otherwise similar accounts, but it should not become a reason to ignore other charges. Good fills do not make expensive financing disappear, and a cheap entry does not compensate for an account that lacks the order controls the trading approach requires.
The FCA’s 15 October 2026 review of CFD firms’ good and poor practice, which includes spread betting providers, reported broader consideration of account costs while retaining concerns about overnight charges and their disclosure. An execution comparison should therefore remain one part of the value assessment, not stand in for the whole account.
Keep the calculations separate before combining them. Measure spread and slippage around dealing events. Then add the relevant holding-period charges, premiums and account fees using the approach in comparing total spread betting costs. This prevents both omissions and double counting.
The final decision should reflect the intended trading pattern. A frequent short-term trader may place greater weight on ordinary fills, rejections and response delays. Someone holding positions for several sessions must also give holding costs proper attention. Neither should assume that evidence from another market or stake size transfers unchanged.
A defensible execution assessment ends with a bounded finding: what was observed, under which conditions, against which reference and with what uncertainty. Prefer that to a sweeping “best execution” badge. Better execution can reduce trading friction; it cannot turn an unprofitable strategy into a sound one or remove the risk of leveraged losses.