Technical analysis for financial spread betting studies price action, chart geometry and quantitative market metrics to define repeatable, rules-based trading decisions. Rather than attempting to predict the future, systematic traders use support and resistance zones, dynamic moving averages, momentum oscillators and volatility bands to identify structural market setups, validate execution triggers and enforce explicit invalidation points. A chart pattern in isolation is incomplete: dealing spreads, live bid-ask quotes, stake-per-point sizing, stop-loss mechanics and overnight funding costs govern the true commercial viability of a spread bet. This guide breaks down the core technical tools, operational advantages, structural limitations and practical execution math required for an auditable spread betting plan.
Technical indicators do not eliminate market risk or turn leveraged derivatives into guaranteed profit generators. The Financial Conduct Authority (FCA) supervises spread betting under its retail CFD regime, classifying these leveraged products as complex and high-risk. Indicators merely summarize past price data; their real-world expectancy depends on mathematical edge, liquidity conditions and execution costs. The worked examples below illustrate trade arithmetic and risk management under realistic broker pricing rather than idealized mid-market assumptions.
Technical Analysis in Spread Betting at a Glance
-
1
Risk Definition, Not Prediction: Indicators do not forecast the future; they define objective entry triggers, structural invalidation points, and dynamic stop distances.
-
2
Stake Sizing Derived from Stops: Calculate stake per point directly: Planned Cash Risk (£) ÷ Stop Distance in Points. Never trade arbitrary, fixed stakes across different asset classes.
-
3
Indicator Specialization: Avoid multi-indicator redundancy (e.g., RSI + Stochastics + MACD). Use one tool for trend direction, one for volatility scaling, and price structure for the trigger.
-
4
Real-World Execution Friction: Account for bid-ask spreads, overnight funding drag (SOFR/SONIA debits on DFBs), and execution slippage—unhedged stops do not guarantee fill prices during market gaps.
-
5
Statutory UK Protections & Tax: Retail spread bets feature 50% margin close-outs and tax exemption under HMRC BIM22015, but trading losses cannot be offset against capital gains or income.
What Is Technical Analysis?
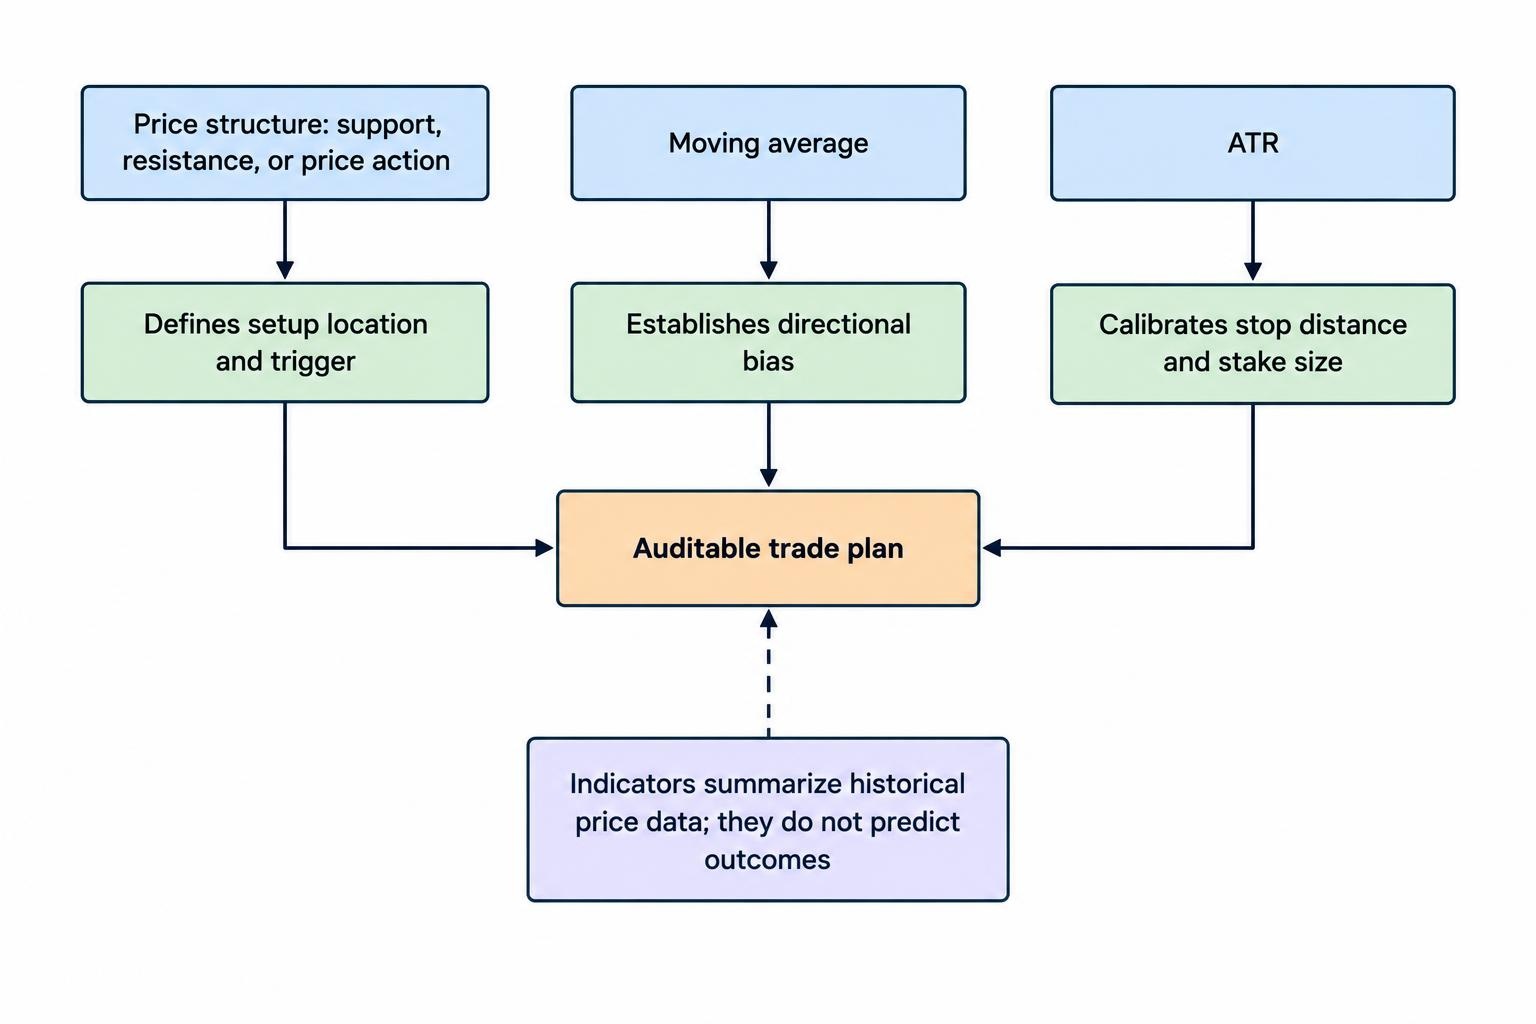
Technical analysis evaluates historical trading behavior across three core dimensions: price, time and volume. A trader might analyze whether a series of higher highs and higher lows defines an intact uptrend, whether price is oscillating between defined horizontal boundaries, or whether structural volatility is expanding. Technical indicators mathematically transform that underlying price data: moving averages smooth directional noise, whereas momentum oscillators measure the velocity of gains versus losses. These tools provide objective execution criteria, but they possess zero predictive power in isolation—their practical value lies entirely in establishing an auditable framework that generates positive expectancy after real-world dealing friction.
Technical Analysis Compared With Fundamental Analysis
Fundamental analysis evaluates intrinsic value—tracking corporate balance sheets, earnings growth, central bank interest rate policies and macroeconomic data. In contrast, technical analysis focuses on price discovery and market behavior. The two frameworks perform complementary roles in a professional spread betting strategy: fundamentals determine what asset to trade based on macro divergence, while technical analysis dictates where to enter, size stakes and position protective stop losses. A moving average crossover cannot validate an economic growth surprise, just as strong earnings cannot prevent a technical distribution breakdown. Risk parameters must always govern live execution regardless of the fundamental thesis.
| Analytical Question | What Technical Analysis Contributes | What It Cannot Establish Alone |
|---|---|---|
| What is the market doing? | A consistent, rule-based description of trend, range, momentum, or volatility | Why every individual price movement or structural shift occurred |
| Where might a trade begin? | A predefined price level, chart structure, or quantitative indicator trigger | That a live order will execute at the chart price without spread or slippage |
| Where is the idea invalidated? | An objective price boundary that directly contradicts the trade thesis | A guaranteed maximum cash loss when using an ordinary (non-guaranteed) stop |
| How volatile is the market? | A historical measure of recent price variation and average range dispersion | The timing or magnitude of the next market gap, liquidity freeze, or tail risk |
| Does the method work? | A verifiable set of deterministic rules that can be tested against historical data | Future profitability without accounting for live execution friction and sample bias |
*Technical analysis defines structural setups and invalidation points; execution quality, broker bid-ask spreads, and unexpected liquidity shocks govern realized trading performance.
Understanding the Chart Before Adding Indicators
A charting platform displays a specific underlying data feed, which rarely matches the broker’s proprietary dealing ticket exactly. You must verify whether a chart displays cash spot prices, active futures contracts, mid-market rates or executable bid/ask feeds. In spread betting, long positions open at the ask and close at the bid, while short positions open at the bid and close at the ask. Charting only mid-market prices creates dangerous discrepancies around narrow profit limits, breakout entries and stop-loss triggers.
Standard candlesticks display the open, high, low and close (OHLC) for a chosen timeframe. However, an hourly candle cannot reveal the chronological order of its high and low extremes—a critical detail when backtesting whether a profit target or a stop loss was hit first. Furthermore, an active candle in progress can change shape entirely before its completion. Rule-based strategies must require a verified candle close to confirm a signal, with execution priced at the subsequent bar’s available quote.
Recognising Trends, Ranges and Changing Volatility
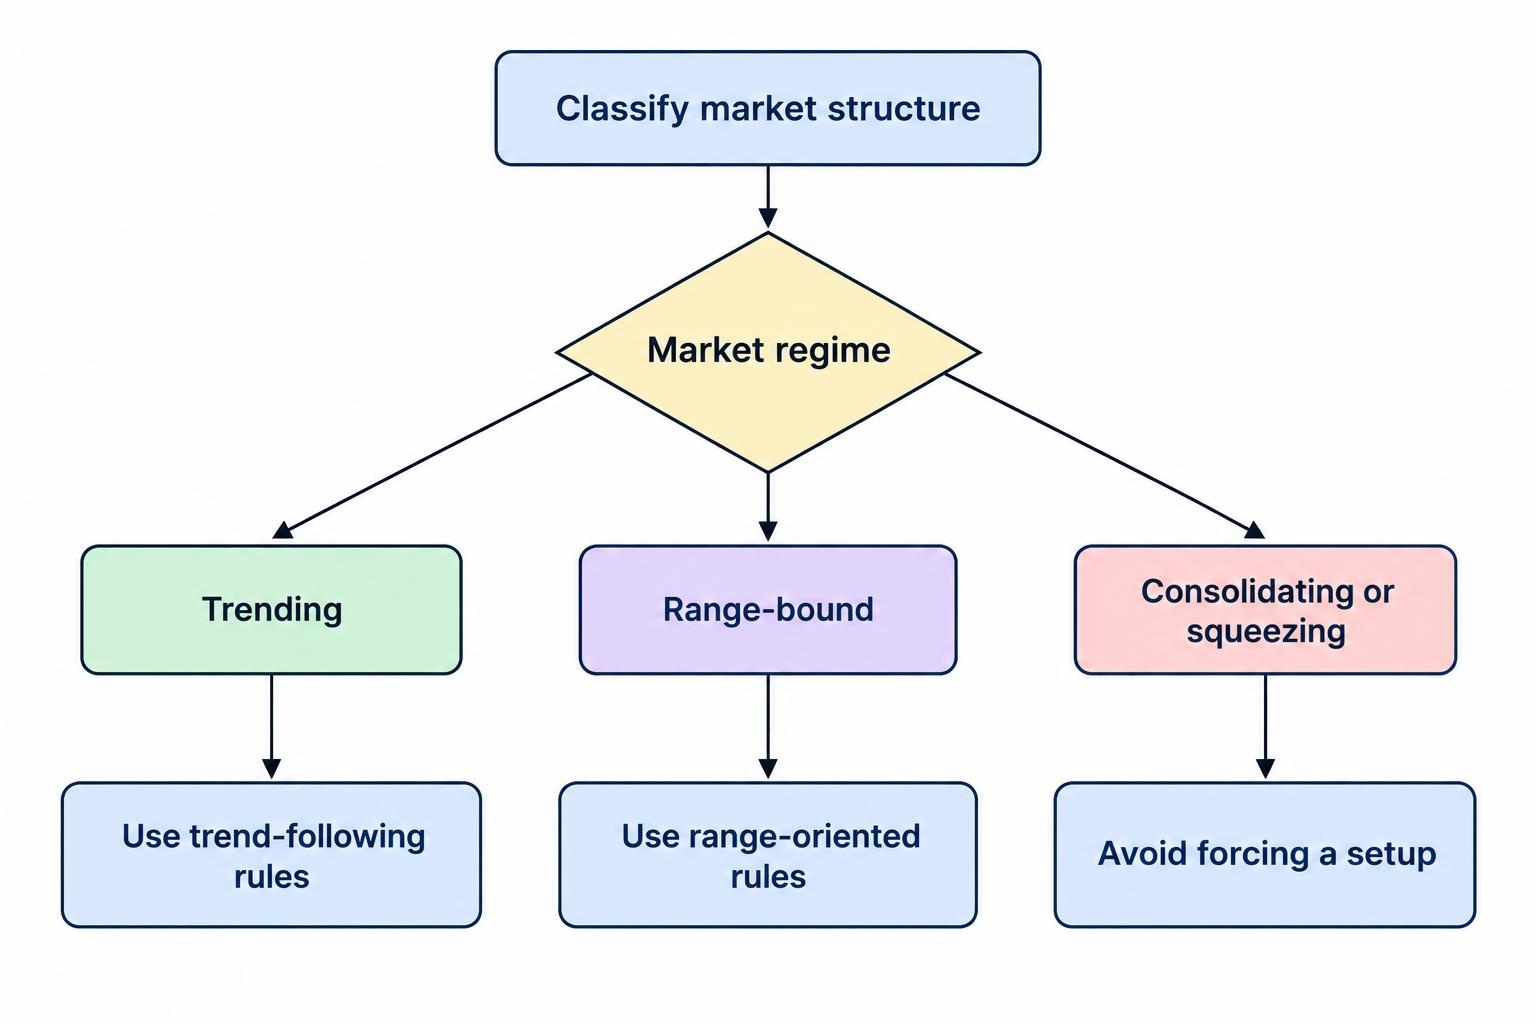
Every technical trading plan starts by classifying market structure into one of three regimes: trending, range-bound or consolidating (squeezing). An uptrend is defined by consecutive higher swing highs and higher swing lows, while a downtrend prints lower swing highs and lower swing lows. Horizontal support and resistance boundaries define range-bound chop. Strategy rules must match the regime: attempting to buy dips with mean-reversion tools during a runaway trend causes severe drawdowns, while trend-following strategies get chopped up during range consolidation. Defining when a market is unstructured and standing aside in cash is an active risk-management discipline.
Who Might Technical Analysis Suit?
Technical analysis suits structured, disciplined traders who value objective execution criteria, auditable trade logging and systematic risk controls. It can be applied effectively across day trading, swing trading and multi-week position horizons. However, traders must treat signals as conditional mathematical probabilities rather than certainty. Mastering two or three robust tools thoroughly produces far better long-term expectancy than cluttering charts with dozens of overlapping, uncalibrated indicators.
The technical approach fails when a trader seeks predictive certainty, lacks the patience to wait for verified setups, or constantly moves stops to avoid taking losses. Drawing support lines after a price has already bounced is easy in hindsight; trading those levels live requires managing execution spreads and risk parameters. An apparently clean technical pattern is useless if the point value is miscalculated, the spread consumes the profit margin, or position sizing exceeds account capacity.
Advantages and Limitations of Technical Analysis
The primary advantage of technical analysis is transforming subjective market commentary into concrete, measurable rules. Traders can define exact entry triggers, mathematical stop distances based on market structure, and reward-to-risk targets. It provides a consistent framework across multiple asset classes—including forex, stock indices, shares and commodities. However, indicators only process historical prices; they cannot predict unexpected macroeconomic events, flash crashes or sudden liquidity vacuums.
| Potential Advantage | Corresponding Operational Limitation |
|---|---|
| Defines repeatable entry and exit conditions | Poor rules remain poor even when followed consistently |
| Helps describe trend direction and prevailing volatility | Market conditions can change abruptly after the signal appears |
| Can be applied across multiple timeframes | Indicator settings, spread friction, and costs do not transfer automatically |
| Provides an objective structure for historical testing | Historical testing can easily be distorted by hindsight and curve-fitting |
| Supports measurable, formulaic risk calculations | Ordinary stops remain vulnerable to execution slippage and market gaps |
| Can complement fundamental and economic research | Multiple indicators frequently repeat the exact same underlying price data |
*Systematic trading rules provide an objective framework for execution, but they do not eliminate market risk, spread friction, or model decay.
The main hazard in technical analysis is curve-fitting (data-snooping bias) and indicator redundancy. Stacking an RSI, a Stochastic oscillator and a MACD on one screen does not provide three confirmations; it merely displays the same momentum calculation in three visual formats. Discretionary analysis introduces subjective bias, where two traders draw completely different trendlines on the identical chart. A viable technical system requires clear invalidation criteria and must remain resilient across out-of-sample market environments.
The Main Technical Analysis Tools
Each technical tool in a trading plan must perform an independent operational function: support and resistance define setup location; moving averages establish trend bias; RSI and MACD measure momentum; Bollinger Bands and ATR calibrate volatility; and candlestick patterns confirm local order flow. Avoid adding indicators simply because they are popular. Select only tools that answer a specific operational question within your rules.
| Tool | Main Use in a Trading Plan | Common Operational Mistake |
|---|---|---|
| Support and Resistance | Identify structural areas relevant to entries, targets, and invalidation levels | Assuming a historical level must hold simply because it held previously |
| Moving Averages (SMA / EMA) | Establish directional trend bias and smooth out high-frequency price variation | Treating an indicator crossover as definitive proof of a new, sustained trend |
| Relative Strength Index (RSI) | Assess the momentum balance between recent upward and downward price changes | Automatically selling when above 70 or buying when below 30 in strong trends |
| MACD | Examine convergence and divergence between faster and slower moving averages | Confusing decelerating price momentum with an immediate, confirmed reversal |
| Bollinger Bands | Frame price relative to a dynamic average and recent statistical dispersion | Treating every outer band touch or pierce as an automatic mean-reversion signal |
| Average True Range (ATR) | Estimate recent true-range volatility to scale stop buffers and position size | Using ATR to predict market direction or treat it as a hard cap on maximum moves |
| Candlestick Patterns | Describe the structure and rejection dynamics of individual or grouped price bars | Ignoring market structure, location, and the broker’s executable bid-ask quote |
*Technical tools are analytical filters, not standalone trading systems. In spread betting, every indicator signal must be bounded by explicit point stops and stake sizing.
Support and Resistance
Support and resistance represent structural zones where aggressive buying or selling previously entered the market. They are most reliably treated as horizontal price bands rather than exact lines, allowing for spread variance and brief order spikes. A break of structural support indicates a potential regime change, but false breaks (“liquidity grabs”) occur frequently around key market opens. Traders must specify what constitutes a verified breakout (e.g., a full candle body close beyond the zone) and which quote side (bid or ask) must reach the level to trigger an execution.
Moving Averages
Moving averages calculate the average price over a specified number of periods, smoothing out market noise. A Simple Moving Average (SMA) weights all periods equally, whereas an Exponential Moving Average (EMA) gives greater mathematical weighting to recent price action, reducing indicator lag. Traders use moving averages to define trend direction (e.g., price trading above the 200 EMA) or act as dynamic support on pullbacks (e.g., 20 or 50 EMA). Crossovers signal shifting momentum, but they produce painful whipsaws during sideways, range-bound markets.
Relative Strength Index: RSI
The Relative Strength Index (RSI) measures momentum velocity on an oscillator scale from 0 to 100, tracking the magnitude of recent gains against recent losses over a standard 14-period lookback. While readings above 70 are labeled “overbought” and below 30 “oversold”, these extremes do not mandate an immediate reversal. In powerful directional trends, RSI can remain pinned above 70 for extended periods while price advances hundreds of points. RSI is most effective when identifying momentum divergences (price prints a higher high while RSI prints a lower high) near key structural levels.
Moving Average Convergence Divergence: MACD
MACD tracks the relationship between two exponential moving averages, typically subtracting the 26-period EMA from the 12-period EMA to create the MACD line, then plotting a 9-period EMA signal line alongside a histogram. The histogram displays the mathematical distance between the MACD line and the signal line. A decelerating histogram indicates that trend momentum is slowing, but momentum deceleration is not a confirmed price reversal. Rules must distinguish between zero-line crosses (broad trend shifts) and signal-line crosses (short-term momentum triggers).
Bollinger Bands
Bollinger Bands place dynamic statistical volatility envelopes around a central 20-period moving average, set at two standard deviations above and below. Band contraction (“the squeeze”) indicates low volatility that frequently precedes explosive directional breakouts. Crucially, as emphasized in official rules, an outer band touch is not a standalone sell or buy signal. During powerful trends, price can “walk the bands” for multiple sessions, causing heavy losses for contrarian mean-reversion traders who lack protective stops.
Average True Range: ATR
Average True Range (ATR) quantifies absolute price volatility across a specified lookback (typically 14 periods) by measuring the greatest of the current high-low range, previous close to current high, and previous close to current low. ATR provides zero directional bias—it measures market movement magnitude alone. Professional spread bettors use ATR to calibrate dynamic stop-loss buffers (e.g., setting a stop at 1.5 × ATR below entry) and scale stake sizes: higher ATR readings require wider stops and smaller stakes per point to maintain identical cash risk.
Candlestick Patterns
Candlestick formations visualize localized buyer and seller battles within a single or multi-bar period. Patterns like hammers, shooting stars and bullish/bearish engulfing bars indicate price rejection at specific levels. However, a candlestick pattern has zero statistical edge in isolation; its validity depends entirely on location within the macro market structure. An engulfing candle formed at a verified daily support level carries technical weight, whereas the same formation in the middle of an unstructured consolidation range is merely market noise.
Volume and the Quality of Market Data
Volume data provides insight into institutional participation, but its reliability depends directly on the asset class. Centralized exchange equities and futures offer true volume metrics, whereas decentralized OTC forex markets provide only “tick volume” (the frequency of price quote updates). A tick volume spike indicates volatility expansion, but does not reflect total monetary order flow. Traders must confirm what their charting platform displays before building volume-weighted strategies.
Choosing a Timeframe Without Changing the Rules Mid-Trade
Execution timeframes must match your trading style, available screen time and holding capacity. Intraday timeframes (1-minute to 15-minute charts) provide frequent trading opportunities, but carry elevated spread friction relative to target size. Higher timeframes (4-hour and daily charts) filter out noise and reduce spread drag, but require wider stop-loss buffers and carry overnight financing costs. Traders frequently use a dual-timeframe model: higher timeframes establish structural trend direction, while lower timeframes pinpoint precise execution triggers. Crucially, never switch to a higher timeframe to justify holding a trade that hits its stop—that emotional mistake turns a planned short-term loss into an unmanaged disaster.
Why Several Indicators Can Give the Same Information
Displaying a 20 EMA, a 50 EMA, an RSI, a Stochastic and a MACD simultaneously creates the illusion of multi-layered confirmation. In reality, all five indicators perform mathematical transformations of the identical closing price series. When the market trends upward, all five indicators will simultaneously flash bullish readings. A robust technical blueprint assigns distinct, non-overlapping functions: one indicator for trend filter, one for volatility calibration, and price action for trigger timing.
Turning a Chart Observation Into a Trade
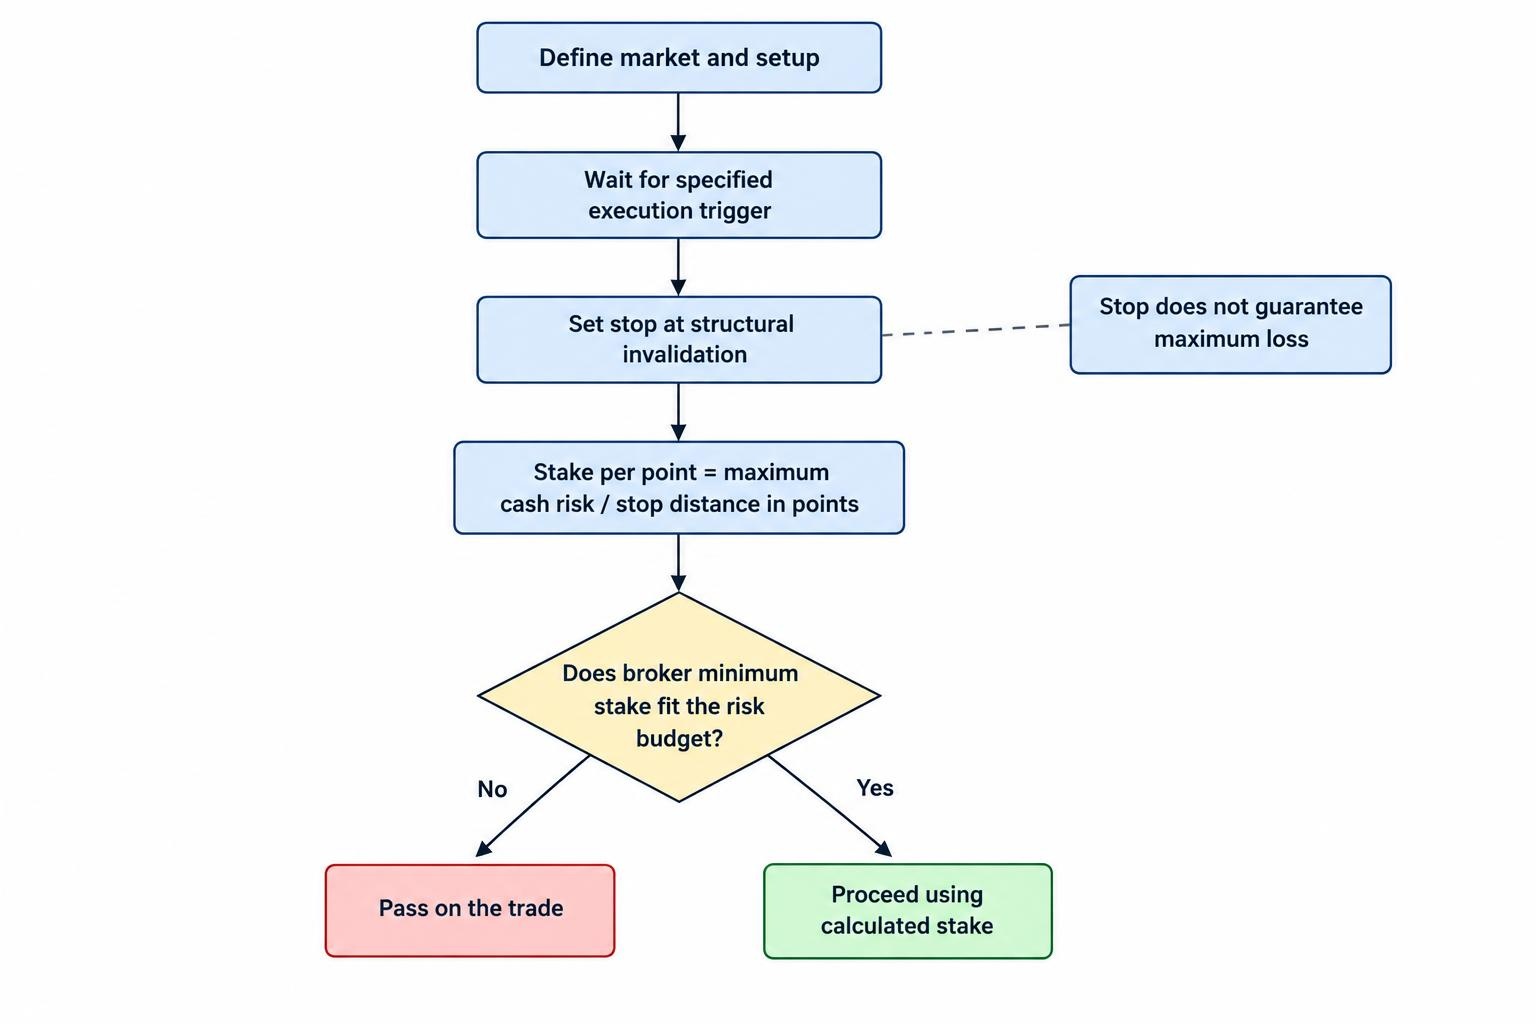
Translating an abstract chart pattern into an executable spread bet requires an auditable operational checklist: market selection, timeframe, setup condition, execution trigger, stop-loss invalidation level, profit target and time stop. Vague rules fail under live market conditions. The trading plan must specify whether orders are executed via market orders (guaranteeing fill, risking slippage) or limit orders (guaranteeing price, risking missed entries), and account for broker bid-ask spreads upfront.
Calculate your spread betting stake size directly from your stop distance rather than using an arbitrary stake. If the structural invalidation point requires a 40-point stop and your maximum acceptable risk is £20, your stake is exactly £0.50 per point (£20 ÷ 40 points). If a broker’s minimum stake on that market is £1 per point, taking the trade would force you to double your risk budget. When commercial contract minimums conflict with risk rules, pass on the trade.
Practical Example: A Long Index Trade After a Breakout
To see how technical rules translate into real spread betting arithmetic, consider an illustrative breakout trade on a cash stock index:
The index trades below resistance at 8,500. The setup requires a confirmed 1-hour candle close above resistance. Once closed, the broker quotes 8,512 / 8,514. The trader goes long at the ask of 8,514 at £0.50 per point. An ordinary stop is set at the bid of 8,474 (40 points risk = £20), and a profit target is set at 8,594 (80 points gain = £40), targeting a 2:1 reward-to-risk ratio. The position is held overnight, incurring a £2 overnight funding charge. The table below examines the net financial results across five alternative execution outcomes:
| Alternative Outcome | Closing Sell Price | Price Profit / Loss | Funding Cost | Net Result |
|---|---|---|---|---|
| Breakout Follows Through to the Target | 8,594 | +£40 | £2 | +£38 |
| Small Rise Followed by Planned Time Exit | 8,524 | +£5 | £2 | +£3 |
| Closed at Original Opening Buy Price (Scratch) | 8,514 | £0 | £2 | −£2 |
| Ordinary Stop Fills at Requested Trigger | 8,474 | −£20 | £2 | −£22 |
| Adverse Gap; Ordinary Stop Fills at 8,444 | 8,444 | −£35 | £2 | −£37 |
*Illustrative long trade entered at 8,514 with a £0.50 per point stake held across an overnight funding cut-off. Demonstrates how carrying fees and execution slippage alter net expectancy.
Notice how dealing costs impact realized results: closing at the entry price of 8,514 yields a £2 net loss due to overnight financing. More critically, when an adverse morning gap causes the ordinary stop to slip to 8,444, the loss expands to £37—nearly double the intended £20 risk budget. Ordinary stops offer zero gap protection; where absolute capital preservation across overnight sessions is required, traders must utilize Guaranteed Stop-Loss Orders (GSLOs).
Practical Example: A Short Forex Trade Near Resistance
Consider an intraday short trade on EUR/USD using resistance rejection. The pair tests structural resistance at 1.0950, and a 15-minute shooting star candle confirms rejection. The broker quotes 1.0944 / 1.0946. The trader sells short at the bid of 1.0944 at £1 per point (0.0001 pip = £1). The stop loss is placed at the ask of 1.0974 (30 pips risk = £30), and the target is placed at 1.0884 (60 pips target = £60 gross gain). Reaching the target after a £3 overnight financing debit produces a £57 net profit.
If unexpected central bank commentary sparks a sudden short squeeze, slipping the stop fill to 1.0994, the loss jumps to £53 (£50 price loss + £3 funding). Alternatively, a time-based liquidation at 1.0940 yields £4 gross profit, but nets only £1 after funding charges. These calculations prove why an abstract risk-to-reward ratio on a chart does not equal real-world trading edge: slippage and financing continuously distort gross theoretical expectancy.
Position Sizing, Stops and Margin
Professional spread betting position sizing operates on a strict mathematical formula:
Stake per Point (£/pt) = Maximum Cash Risk Budget (£) ÷ Technical Stop Distance (Points)
Margin collateral must never be confused with risk budget. Under FCA retail rules (COBS 22.5), spread betting brokers enforce statutory initial margin minimums (e.g., 5% on major indices, 3.33% on major FX, 20% on individual shares). A £4,257 index exposure at £0.50/pt requires £212.85 in initial collateral. However, this margin requirement merely enables the trade—it does not cap your loss. Furthermore, the FCA mandates an automated 50% account margin close-out rule: if total account equity drops below 50% of required margin, open positions are liquidated automatically by the platform.
Costs Can Change Whether a Technical Setup Is Worth Trading
Trading costs determine whether a technically sound pattern generates positive net expectancy. On short timeframes, bid-ask spreads and slippage create massive drag. On multi-day swings, overnight financing charges (SOFR/SONIA interbank rates plus broker markups) erode capital daily. The FCA’s review of CFD pricing and value revealed substantial discrepancies in broker financing formulas. Always evaluate backtested performance against realistic bid/ask execution data rather than theoretical mid-prices.
Applying Technical Analysis Across Different Markets
Technical patterns cannot be applied uniformly across different underlying assets without adjusting for market structure. Individual equities carry idiosyncratic earnings gap risks and dividend adjustments; forex pairs trade 24 hours with shifting session liquidity across London, New York and Tokyo; stock indices reflect constituent earnings cycles; and commodities are bound to physical delivery curves and futures contract rollovers. A breakout model optimized on EUR/USD will frequently fail on single shares due to unhedged overnight gap risk.
How to Get Started With Technical Analysis
Beginners should follow a progressive, three-stage implementation roadmap:
- System Definition: Select one liquid benchmark (such as the FTSE 100 or EUR/USD) and build a single setup using no more than two indicators (e.g., 200 EMA for trend filter, horizontal support/resistance for entry).
- Regulatory & Platform Due Diligence: Verify broker authorization on the FCA Financial Services Register. Verify minimum stake sizes (£0.10 to £1/pt) and execution latency on a demo account.
- Micro-Stakes Live Validation: Transition from demo to a live micro-stakes account (£0.10 to £0.50/pt) to experience live market slippage, spread expansion and psychological risk before scaling capital.
Testing Technical Rules Without Hindsight
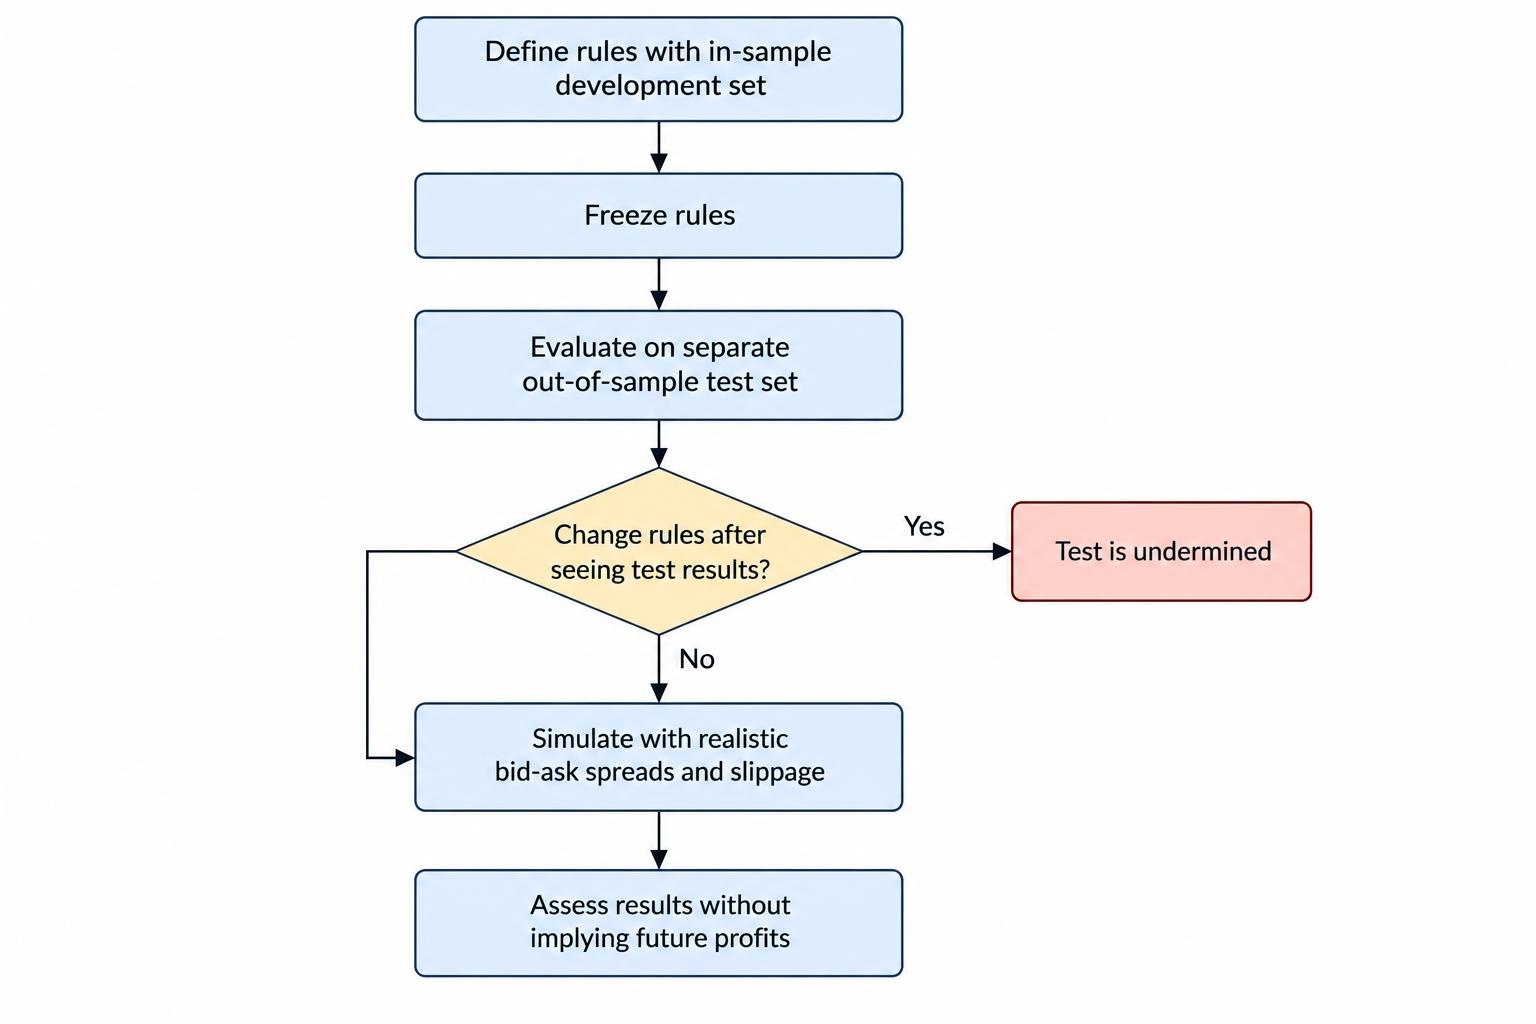
Manual chart backtesting is notoriously prone to hindsight bias and curve-fitting. When reviewing past charts, the human eye naturally spots clean winning patterns while ignoring ambiguous losing setups. In quantitative research, Bailey, Borwein, López de Prado and Zhu examine the probability of backtest overfitting, proving that repeatedly tuning indicator parameters on historical data virtually guarantees out-of-sample trading failure.
To produce auditable backtests, strictly separate data into in-sample (development) and out-of-sample (testing) sets. Never adjust rules after observing test-period performance. Always model worst-case execution assumptions by adding spread markups and artificial execution slippage to your simulation.
Win Rate, Risk–Reward and Expectancy
A high win rate is meaningless without factoring in reward-to-risk ratios. A system winning 80% of trades will lose money if its average loss is five times larger than its average gain. Performance must be judged via mathematical expectancy:
Expectancy = (Win Rate × Average Win) − (Loss Rate × Average Loss) − Average Friction Costs
Consider a system winning 45% of trades with an average win of £40, an average loss of £20, and average dealing costs of £2 per trade. The net expectancy is +£5.00 per trade [(0.45 × £40) − (0.55 × £20) − £2]. Evaluating strategies through expectancy keeps traders grounded through inevitable losing streaks and prevents the dangerous temptation to widen stops or double down after losses.
Common Technical Analysis Mistakes
The most frequent technical trading mistakes include treating lagging indicators as predictive crystal balls, moving stops away from approaching prices, and adding redundant indicators to justify an emotional bias. Another critical error is evaluating setups from sanitized chart screenshots without verifying the broker’s live bid-ask spread and session liquidity. When a setup fails, log the trade objectively in a trading journal: understanding whether a loss resulted from execution failure or normal probabilistic variance is essential for long-term survival.
UK Tax Treatment of Technically Driven Spread Bets
Executing trades based on technical indicators does not alter the statutory UK tax classification of spread betting. Under HMRC Business Income Manual BIM22015, spread betting is legally classified as betting, meaning profits are entirely exempt from Capital Gains Tax (CGT) and Stamp Duty. However, trading losses cannot be offset against other taxable income or capital gains.
Under HMRC guidance BIM22020, exceptions exist where spread betting forms part of a commercial trade or corporate business entity. Tax laws remain subject to individual residency and statutory change. While tax-free profits enhance net returns on a winning system, they cannot rescue an unprofitable trading model with negative mathematical expectancy.
Building a Technical Approach That Can Be Evaluated
A workable technical strategy provides complete transparency: identifying structural regime, defining execution triggers, locking in invalidation levels and accounting for trading friction. Within a comprehensive spread betting strategy framework, technical analysis serves as an objective tool for defining risk. Its long-term edge depends entirely on whether those rules remain disciplined when exposed to real broker spreads, market gaps and changing volatility.