Moving averages are technical indicators that smooth a price series to make its recent direction easier to describe. In financial spread betting, traders use them as trend filters, crossover signals, pullback references and exit conditions. Their appeal is that the calculations can support clear, repeatable rules. Their limitation is that they respond to prices that have already occurred. A moving average does not predict a guaranteed turning point, establish fair value or determine how much a trader should risk. This guide explains the main types, how to interpret them, who they may suit and how to connect a chart condition to an executable spread bet with realistic costs and potential losses.
A moving average becomes useful only as part of a complete trading plan. The Financial Conduct Authority includes spread betting within its CFD product supervision and describes these leveraged products as high risk and unsuitable for some retail consumers. A smooth trend line does not remove gaps, financing costs or the possibility of repeated losing trades. The calculations and examples below are hypothetical educational illustrations rather than recommended settings, current prices or trading instructions. They show both favourable and adverse outcomes. Before using a real contract, check the price series, point value, dealing hours and order terms, then assess the stake and holding period separately from the apparent strength of the indicator.
What Is a Moving Average?
A moving average combines a sequence of price observations into a value that updates as new data become available. Its length defines the calculation’s lookback or smoothing parameter, depending on the type. A 20-period average on a daily chart uses daily observations; the same length on an hourly chart relates to hourly observations. Closing prices are commonly used, but platforms may allow other inputs, such as an average of each bar’s high and low. These choices affect the result. Always identify the type, length, source and timeframe when describing a rule. Saying that price is “above the moving average” is incomplete unless those details are known and can be reproduced.
The indicator is usually plotted in the same units as the underlying price series. An index average at 10,000 is an index-price reference, while an average at 1.2500 on a currency chart uses that pair’s quotation. The plotted line is not an order, a balance of current bids and offers, or a valuation of what the market ought to be worth. It is a calculation from selected observations. Price can remain far above or below it, and the average can move towards price even when price does not return to the earlier average. That distinction matters when a trader is tempted to assume that every stretched move must reverse back to the line.
How a Simple Moving Average Is Calculated
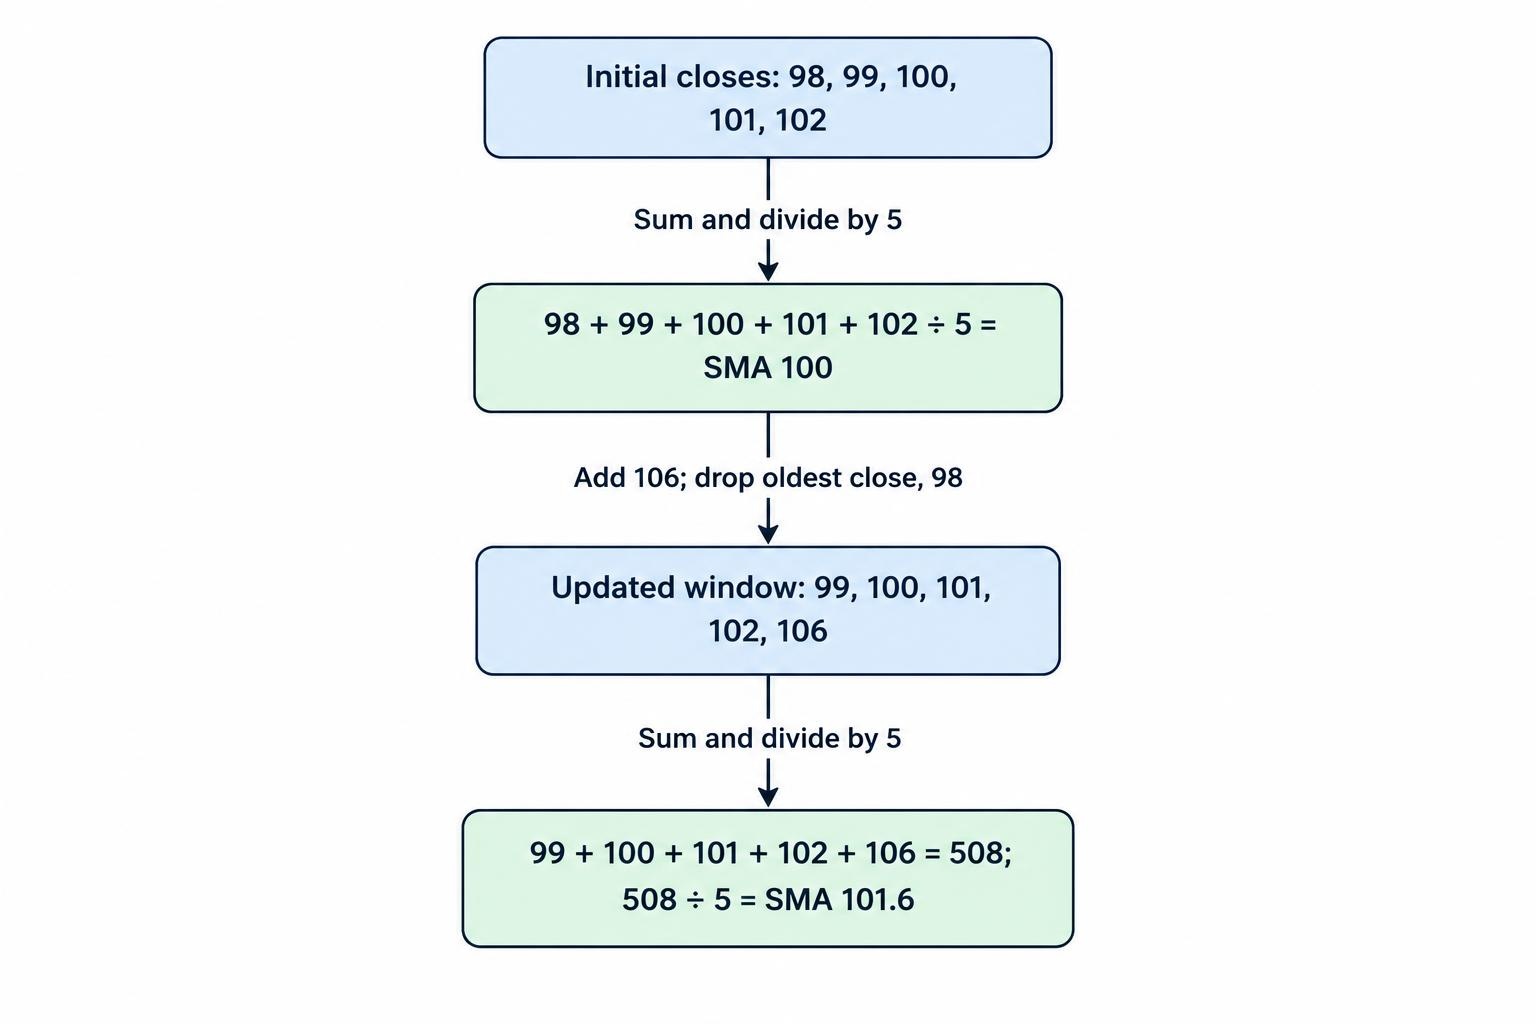
A simple moving average, or SMA, adds the selected observations and divides by their number. Suppose five consecutive closing prices are 98, 99, 100, 101 and 102. Their total is 500, so the five-period SMA is 100. If the next close is 106, the oldest value of 98 leaves the calculation and the new five values total 508. The SMA becomes 101.6. This example shows both smoothing and delay: the latest price has reached 106, but the average still reflects the preceding observations. The calculation is straightforward, yet a trading rule using it still needs to specify whether signals are assessed during a candle or only after it has closed.
The removal of old observations can also affect the line’s slope. Using the same original five closes, suppose the next close is 100 rather than 106. Price has fallen from 102 to 100, but the new SMA rises from 100 to 100.4 because the incoming 100 replaces the older 98. A rising average therefore does not necessarily mean that the most recent candle rose. It describes the change in the selected rolling calculation. This is one reason to distinguish price direction, average slope and a crossover as separate observations. Combining them may form a rule, but they should not be treated as interchangeable descriptions of the same event.
How an Exponential Moving Average Is Calculated
An exponential moving average, or EMA, gives greater weight to recent observations while retaining diminishing influence from earlier data. A common smoothing factor is two divided by the chosen length plus one. The updated EMA equals the previous EMA plus that factor multiplied by the difference between the new price and the previous EMA. TradingView’s moving-average documentation describes this construction. For a five-period EMA, the factor is one-third. If the previous EMA is 100 and the new close is 106, the updated EMA is 102. This is a conditional arithmetic example: an actual EMA’s previous value depends on its earlier data and the method used to initialise the calculation.
An EMA generally reacts more directly to recent price changes than an SMA with the same stated length, but faster reaction is not automatically better. It can identify a change sooner while also responding to fluctuations that do not develop into sustained moves. Initialisation matters too, especially near the start of a dataset: using different starting values or amounts of earlier history can create differences between implementations. The influence of the starting value diminishes as more observations arrive. For testing, allow enough earlier data to initialise the indicator and check that the historical calculation matches the live platform. Otherwise, apparently identical settings can produce signals at different times or prices.
SMA, EMA and Other Moving Averages Compared
The SMA and EMA are sufficient starting points for understanding most basic moving-average methods. A weighted moving average, or WMA, is another variant that assigns specified weights to observations within its window, commonly giving more weight to recent ones. Other constructions change responsiveness or smoothness in different ways, but a more elaborate formula does not establish a stronger trading advantage. Compare indicators by how they change the actual decisions and results under the intended conditions. If a different average merely produces a better-looking historical line after repeated experimentation, that is weaker evidence than a clear improvement in a fixed strategy evaluated on later data and after realistic costs.
| Type | How observations are treated | Practical trade-off |
|---|---|---|
| Simple moving average | Equal weight within the selected window | Easy to reproduce; changes when new data arrive and old data leave |
| Exponential moving average | Greater weight on recent data, with declining influence from older observations | More responsive to recent movement, with sensitivity to short-term fluctuations |
| Weighted moving average | Explicit weights within a defined window | Behaviour depends on the weighting scheme; still responds to historical data |
Who Might Moving Averages Suit?
Moving averages may suit a trader who prefers rules that can be described precisely and evaluated consistently. They can help organise trend trading, provide context for pullbacks or define when a position should be reviewed. Their application can range from intraday charts to longer holding periods, but the monitoring and cost requirements change with the timeframe. The trader needs to accept that a reactive method may enter after part of a move and surrender part of a gain before an exit signal appears. Those features are not automatically defects; they are trade-offs to assess against the full distribution of results, including periods when the market repeatedly changes direction.
They are a poor fit for someone who expects to buy every bottom, sell every top or receive dependable instructions from a line changing colour. They can also become problematic when the trader alters the length whenever the indicator gives an uncomfortable answer. A person unable to monitor a short timeframe may miss entries and exits that a historical chart makes look simple. Beginners can learn the calculations quickly, but understanding the indicator is only one part of learning the product. They must also understand the spread, stake per point, stop execution and account funding. A profitable-looking crossover cannot compensate for a position that is too large or too expensive to maintain.
Advantages and Limitations of Moving Averages
The main advantage is clarity. A rule can specify the calculation, timeframe and exact condition being observed, making it easier to record decisions and compare results. Smoothing can also help a trader avoid treating every small price change as a new trend. Used as a filter, an average may restrict the kinds of trades considered rather than generate entries directly. These benefits concern the structure of the method. They do not mean that popular settings have a universal edge or that price will respect the average as a barrier. The relevant assessment is whether the rule improves the complete strategy for the market, holding period and execution conditions being used.
| Potential advantage | Corresponding limitation |
|---|---|
| Clear calculations and reproducible conditions | A precise rule can still lose money |
| Smoother description of price direction | Signals respond after some movement has occurred |
| Can filter trades by a defined trend condition | A filter can also exclude profitable opportunities |
| Supports several timeframes and markets | Results and costs do not transfer automatically |
| Can provide a systematic exit reference | An indicator exit is not a guaranteed execution price |
| Makes historical testing possible | Repeated parameter selection can fit the past too closely |
The most visible limitation is whipsaw: a sequence of changes that repeatedly reverses the signal before a sustained move develops. Price can cross an average several times in a narrow range, or two averages can alternate above and below each other. Each trade may be small, but dealing costs and repeated losses can accumulate. A smoother setting or additional condition may reduce some signals, yet can delay others and miss useful moves. There is no adjustment that removes this trade-off in every market. A plan should define when the method is used, how losing sequences are managed and what evidence would justify reviewing it without rewriting the rules after every disappointing trade.
Choosing Lengths and Timeframes
Commonly discussed lengths include 10, 20, 50, 100 and 200 periods, but popularity does not establish suitability. A 200-period average on a five-minute chart is not a 200-day trend measure, and a daily chart’s candles depend on the data source and session definition. Choose the timeframe first in relation to the planned holding period and available attention, then consider how much smoothing the method needs. Shorter lengths tend to react more quickly; longer lengths retain more historical influence. The choice should reflect a hypothesis that can be tested, rather than the setting that most neatly touches earlier turning points on a chart already selected for its attractive trend.
| Illustrative length | Possible analytical role | What it does not establish |
|---|---|---|
| 9 or 10 periods | A relatively fast reference for recent movement | That frequent signals will overcome costs |
| 20 or 21 periods | A short-to-intermediate reference within the chosen timeframe | A dependable support or resistance level |
| 50 periods | A slower trend reference or component of a crossover | A universal definition of trend |
| 100 or 200 periods | Broader context using more historical observations | That a major reversal has been confirmed without uncertainty |
Using more than one timeframe can be coherent if each has an assigned role. A trader might assess direction from completed daily observations and seek entries on an hourly chart. The daily condition must use only the information available when the hourly decision is made; the final daily close cannot be known in advance. Similarly, a live higher-timeframe average may change before its candle closes. Define whether the method uses the last completed value or an updating value. Avoid switching to a longer average merely because the original exit has appeared. That changes the holding period and risk after entry, often without considering the additional financing or potential adverse movement.
Using a Moving Average as a Trend Filter
A trend filter determines which opportunities are eligible rather than necessarily telling the trader to enter immediately. For example, a hypothetical method might consider long setups only when the closing price is above a rising 50-period SMA. The rule must define “rising”, perhaps by comparing the current completed value with its value several completed bars earlier. That condition can coexist with many different entry methods, including breakouts or pullbacks. It can also fail when the market changes direction or remains choppy above the line. Record the filter separately from the entry trigger so its contribution can be evaluated. Otherwise, a good entry method and an ineffective filter can become difficult to distinguish in the results.
Being above an average is a state; crossing above it is an event. A strategy that buys every time price is above the line is different from one that buys only on the first qualifying cross. Without that distinction, a rule can accidentally generate repeated entries or add exposure throughout a trend. Define how a crossover is identified, how equality is handled and what resets eligibility after an exit. A completed close above the average also differs from an intrabar touch that disappears before the candle ends. These implementation details matter because they determine actual trade frequency and costs, not merely how the chart looks when viewed after the session has finished.
Trading Crossovers and Understanding Golden Crosses
A two-average crossover occurs when a faster average moves from one side of a slower average to the other. A 50-day average crossing above a 200-day average is commonly called a golden cross, while the opposite is commonly called a death cross. The names do not establish predictive certainty. Both lines are derived from earlier prices, and the signal can appear after a substantial move or reverse quickly in sideways conditions. A crossover method needs the same execution, sizing and exit decisions as any other approach. It should also specify whether an opposite cross closes the existing position, opens a reverse position or merely triggers a review, because those are materially different strategies.
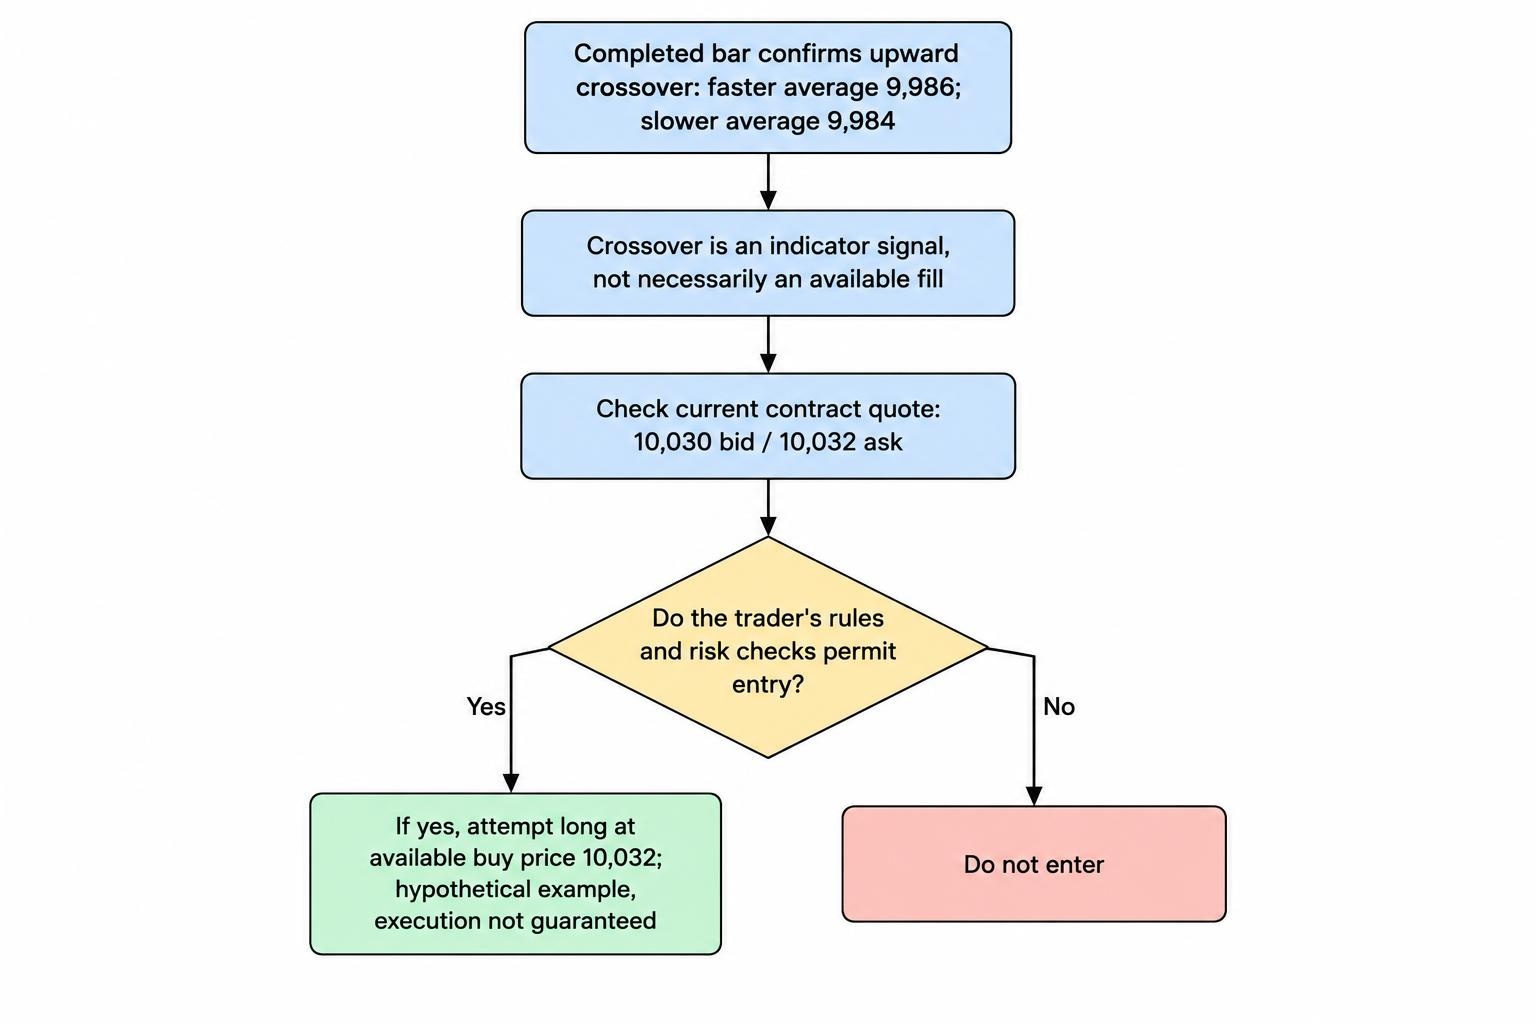
The crossover value is not the price at which the instrument can necessarily be traded. Suppose a completed bar leaves the faster average at 9,986 and the slower at 9,984 after a qualifying upward cross. The current contract might already be quoted at 10,030/10,032. A long entry would use the available buy price, not either moving-average value. If a historical test assumes entry where the lines intersect visually, it can create a price that was never available after the signal became known. Check the order timing and actual quote before assessing reward and risk. An earlier-looking mathematical intersection does not remove the delay between observing a condition and obtaining an executable fill.
Pullbacks Towards a Moving Average
A pullback method uses an existing trend condition, then looks for price to return towards a moving-average area before a possible continuation. The average helps define a location for observation; the entry rule might require a completed recovery candle or another clearly specified condition. Merely touching the line does not establish that buying or selling interest will appear there. Price can pass through it, remain nearby or continue away without offering an entry. This approach often overlaps with support and resistance, but a moving reference and a fixed historical zone are different tools. Define what makes the pullback acceptable and what price behaviour invalidates the continuation idea before the position is opened.
Distance from the average can help describe how far price has moved from its recent reference, but it does not prove overvaluation or an imminent reversal. A trend can remain extended, and the average can catch up during sideways movement. A countertrend method that sells a large extension is therefore different from a trend-following method that buys a pullback. Specify whether distance is measured in points, as a percentage or relative to a volatility measure such as ATR. Those choices are not interchangeable across instruments. A fixed 20-point distance may be substantial in one contract and ordinary fluctuation in another, making the raw number insufficient for comparing opportunities.
Moving Averages as Exit Conditions
A moving average can supply an exit condition without defining a fixed take-profit price. A long method might close after a completed candle finishes below a specified average, while another might use a change in slope or an opposite crossover. The intended benefit is a consistent way to remain in a move while its condition persists, but some gains may be surrendered before the exit appears. An indicator-based exit is also different from a standing protective order. If it requires a candle close and a later market order, the eventual dealing price can be worse than the plotted average. Separate that rule from the emergency or maximum-risk arrangements used while the position remains open.
Automatically moving a stop to the latest average requires particular care. An average can flatten or turn lower during a long trade, so following it mechanically may widen the permitted loss or give back more than the original plan allowed. A trader using a trailing stop might instead define that it can only tighten, subject to the provider’s rules and the strategy’s testing. That creates a different rule from simply exiting on a close below the average. Neither version guarantees an ordinary stop’s execution price during a gap. Document exactly when the stop updates, which price series triggers it and whether the indicator-based exit remains active alongside it, so the two instructions do not create unintended orders or exposure.
Practical Example: A Long Index Pullback Trade
Assume a hypothetical index has a rising 50-period SMA on completed hourly data, while a 20-period EMA is near 10,190. Price pulls back and meets a predefined recovery condition above a recent sell-price low around 10,170. The available quote is 10,200/10,202, and the trader buys at 10,202 for £0.50 per whole index point. An ordinary stop is placed at a sell price of 10,162, creating £20 of intended price risk. The planned target is a sell price of 10,282, offering £40 of price profit. Assume the alternative outcomes below include £3 of funding for the illustrated holding period and no dividend adjustment or other charges.
| Alternative outcome | Closing sell price | Price profit or loss | Funding cost | Net result |
|---|---|---|---|---|
| Trend resumes and reaches the target | 10,282 | +£40 | £3 | +£37 |
| Limited rise followed by a planned exit | 10,212 | +£5 | £3 | +£2 |
| Exit at the original opening buy price | 10,202 | £0 | £3 | −£3 |
| Ordinary stop fills at its requested price | 10,162 | −£20 | £3 | −£23 |
| Adverse gap; ordinary stop fills at 10,122 | 10,122 | −£40 | £3 | −£43 |
The averages provide context and an entry framework; they do not determine the fill or guarantee that the trend resumes. An immediate exit at the unchanged opening sell quote of 10,200 would lose £1 before funding. After the assumed £3 charge, overall break-even requires a closing sell price of 10,208. Spreads are already included through the actual buy and sell prices and should not be deducted again. The gap scenario also shows that a £20 stop-based estimate is not an absolute loss limit. The equal funding amounts isolate the price outcomes here; in live trading, different exit times can produce different holding costs and therefore different net results.
Practical Example: A Short Forex Trade With a Falling Average
Suppose GBP/USD is below a falling 50-period SMA, and a rally towards a shorter EMA ends with a completed rejection under a predefined rule. The trader does not sell merely because the averages look bearish; the entry condition must also occur at a workable quote. Assume that quote is 1.2600/1.2602, and the trader sells at 1.2600 for £0.50 per 0.0001 pip. An ordinary stop at a buy price of 1.2660 gives 60 pips, or £30, of intended price risk. If the trader later buys back at 1.2480, the favourable 120-pip movement produces £60 before an assumed £4 net funding debit, leaving a £56 profit.
If the expected decline fails to develop and a planned time exit occurs at a buy price of 1.2590, the price gain is only £5, or £1 after the same assumed £4 funding charge. If unexpected news instead causes the ordinary stop to fill at 1.2700, the price loss is £50 and the net loss is £54 under that funding assumption. These outcomes are possible even if the moving averages remain downward-sloping for part of the move. A delayed indicator can continue to describe the earlier decline while the current position loses. The trader therefore needs a risk limit that can operate before the average eventually changes direction or produces the desired exit condition.
Price Data, Chart Settings and Executable Quotes
Two charts can show different averages because they use different price feeds, sessions, time zones or source fields. A bid-price chart is not identical to an ask or midpoint chart, and a cash-index series may differ from the spread betting contract outside the cash session. Adjusted share histories and continuous futures series introduce further issues when corporate actions or contract rolls change the relationship to historical dealing prices. Verify that the data used for research are appropriate to the contract. A line drawn accurately on one series cannot automatically be copied into another as an order level. The relevant question is what the chosen condition meant at the prices the trader could actually have bought or sold.
A forming candle can make price cross an average repeatedly before its final close. That is normal updating, but it matters if the strategy was designed around completed observations. Chart offsets can also shift the display without changing when the underlying information became available. A centred average that uses observations from both sides of a historical point cannot be reproduced at that point in real time because some observations were still in the future. Check these settings before testing a method from a screenshot or custom indicator. The visible smoothness of a historical line says little about whether its signals were available without delay when a trader would have needed to act.
Stops, Position Sizing and Account Margin
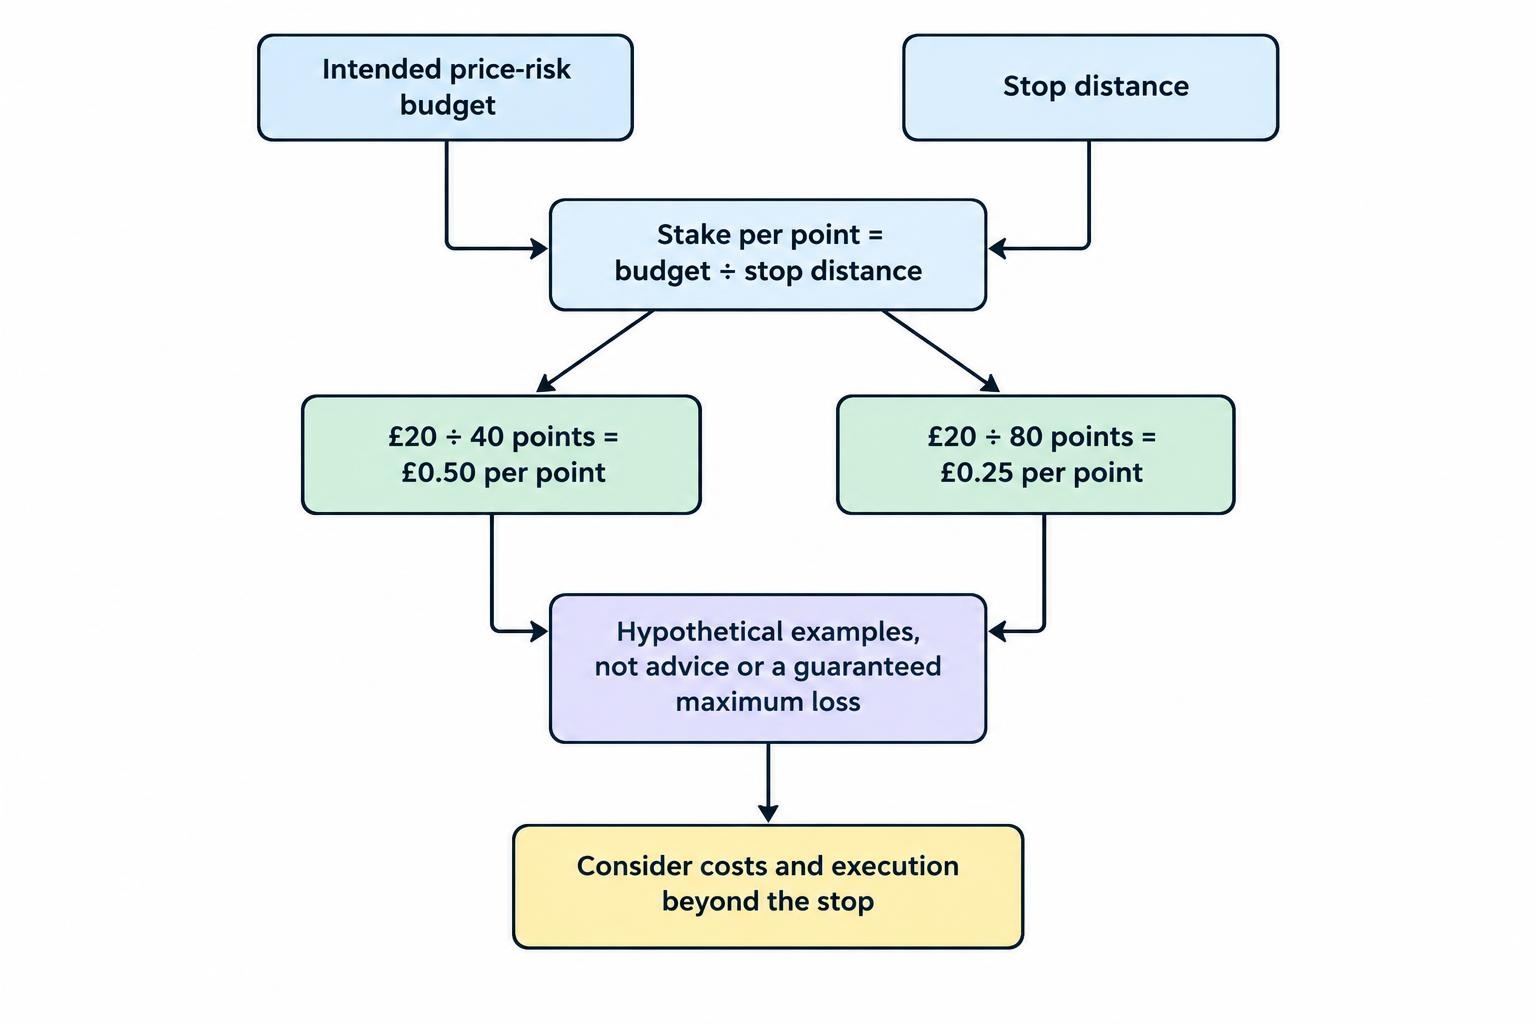
The stake should follow an acceptable risk budget and a defensible exit distance, not the perceived authority of a moving-average signal. In the long index example, £20 divided by the 40-point stop distance gives £0.50 per point. If another valid setup needs an 80-point distance, maintaining that intended price-risk budget implies £0.25 per point, assuming the contract permits it. Costs and execution beyond the stop need separate consideration. Guaranteed stops, where available and valid under the terms, can address the agreed stop price for a premium or other conditions. They do not validate the signal or remove every charge. The position sizing guide develops these calculations in more detail.
Margin is a separate measure. The index example represents approximately £5,101 of exposure, calculated as 10,202 multiplied by £0.50. At an assumed 5% opening margin, the requirement is approximately £255.05. The FCA’s retail rules specify a minimum 5% opening margin for major stock market indices, while firms can require more. They also require closeout as soon as market conditions allow when account net equity falls below 50% of required margin, and limit liability for covered investments to funds in the relevant account. These safeguards do not guarantee an individual ordinary stop or preserve deposited money. Several trades using similar moving-average signals can share exposure and lose together despite appearing on different charts.
Spreads, Funding and the Cost of Repeated Signals
Frequent crossovers can create substantial turnover even when each individual trade appears inexpensive. The spread and slippage matter on every completed trade, while overnight holdings introduce funding and possibly other adjustments. The FCA’s review of CFD pricing and value highlights funding applied to full underlying exposure and differences between firms’ charges, including for short positions. A historical rule tested only on closing or midpoint prices may therefore look more attractive than the actual implementation. Use realistic opening and closing sides and the expected holding duration. If the recorded trade results already include the spread, do not subtract it again when calculating net performance; include only costs not already reflected in those prices.
Combining Moving Averages With Other Analysis
Additional tools should contribute information with a defined purpose. MACD itself uses moving averages, so agreement between a crossover and MACD may reflect overlapping calculations rather than independent evidence. RSI and Bollinger Bands provide other views of related price data, but their presence does not automatically improve a method. A price level, volatility measure or event filter might address a specific missing part of the plan more clearly. Test whether the addition changes decisions usefully after costs. A chart filled with confirming indicators can create confidence without resolving the central questions of entry price, loss exposure and what happens when the market stops trending.
Fundamental analysis and an event calendar can provide context that a historical average does not contain. A company result or policy announcement can abruptly change expectations while the line continues to reflect earlier prices. The method should state whether trades may be opened or held through those events. This does not require forecasting every announcement correctly; it requires making the exposure deliberate. Short-term signals and longer-term averages can both be crossed by a gap, and an eventual return to the earlier line does not reverse a loss already realised through a stop or account closeout. The news trading guide explains the execution risks that become important around such releases.
How to Get Started With a Moving-Average Method
Choose one market, a realistic timeframe and one role for the indicator before selecting a complete strategy. Learn whether the method uses a price cross, a two-average cross, a slope condition or a pullback, and write down the exact calculation and timing. Practise entries, stops and exits in a demonstration account using actual dealing quotes. Before opening a real account, follow the FCA’s guidance on checking authorisation, including permissions and contact details. Regulatory status does not establish that the chosen settings are effective. Minimum stakes, dealing hours and available order types must also fit the plan and the capital available, rather than force the trader into greater exposure than intended.
Keep a record of the completed signal, the quote available afterwards, the actual fill and the reason for exit. Include missed trades, rejected signals and losing sequences, rather than collecting only smooth trends. Compare what the rule required with what was actually done: a method that was not followed consistently cannot be evaluated solely from the resulting account curve. A demonstration account helps check mechanics but may not reproduce every aspect of live slippage, availability or emotional pressure. If considering real trading, the smallest stake still needs to fit the risk budget. Changing the stop distance solely to make a minimum stake appear affordable can invalidate the setup rather than solve the sizing problem.
Testing Moving Averages Without Overfitting
Testing should specify the indicator’s initialisation, price source, observation timing and execution assumption. A crossover confirmed by a closing candle cannot justify a fill earlier in that candle, and a higher-timeframe filter must use information available at the actual decision time. Include spread, slippage, funding and other relevant costs, then assess performance across trending and sideways periods. Check how a protective stop interacts with an indicator exit and how the test handles a bar that touches both a stop and target. Those choices can materially affect results. A clean historical line does not establish that the same trades would have been possible at the assumed prices in the correct sequence.
Choosing the best combination from many moving-average lengths can produce an impressive historical result that depends on chance. The paper The Probability of Backtest Overfitting examines this wider strategy-selection problem. Keep a record of the alternatives tried, separate development from later evaluation and check whether modest changes in settings or costs destroy the apparent advantage. A method that works only at one unusually precise combination deserves more scrutiny than a result that remains broadly similar around nearby choices. Later evaluation is still not a guarantee, especially if its results repeatedly influence further redesign. Historical and demonstration performance should be treated as evidence to assess, not as a promise of future profitability.
Win Rate, Drawdowns and the Shape of Returns
The winning percentage alone does not describe a moving-average strategy. A trend-following approach might experience several small losses before a larger gain, while a different exit rule produces more frequent wins but larger occasional losses. Suppose a hypothetical method wins 40% of trades with an average £70 gain, while losing trades average £30 before £3 of additional average costs. The estimated result is £7 per trade: £28 of weighted gains minus £18 of weighted losses minus £3. These assumptions are illustrative. If the average winner falls to £50, the estimate becomes a £1 loss. Evaluate realised outcomes, drawdowns and the dependence on a few large trends rather than assume an attractive target guarantees a positive average result.
Common Moving-Average Mistakes
Common mistakes include changing lengths after each loss, assuming a golden cross guarantees an uptrend and treating a touch of the line as proof of support. Others involve entering at an average’s plotted value in a test, ignoring the incomplete candle or assuming several related indicators provide independent confirmation. A trader may also keep adding positions because price remains on the preferred side of the average, without defining a total exposure limit. Preserve the original rules and records before making changes. An indicator can continue to describe the market usefully even after a particular trade has failed. There is no need to keep the position open until the line eventually supports the outcome the trader wanted.
UK Tax Treatment of Moving-Average Spread Bets
Using moving averages does not by itself determine a spread bet’s tax treatment. HMRC’s general guidance on betting and gambling explains that betting profits are not normally taxable and losses are not normally relieved. Its specific spread betting guidance says the terms and economic substance matter, including whether activity arises from carrying on a trade. Personal circumstances and residence can be relevant, with separate considerations for companies. A systematic rule, automated calculation or particular indicator does not resolve those questions by itself. Where the position is uncertain or material to the decision, obtain advice on the actual circumstances rather than assume that an expected tax advantage makes an otherwise weak strategy worthwhile.
What Makes a Moving-Average Plan Useful?
A useful plan gives the average a specific role and connects that role to decisions that can be carried out at real prices. It identifies the calculation, signal timing, entry method, risk limit and exit procedure, while allowing for missed moves and false starts. It also recognises that responsiveness, smoothness and trading frequency involve trade-offs rather than a universally best setting. Within technical analysis, moving averages provide a structured way to describe price behaviour and organise a wider spread betting strategy. Their practical value depends on the complete method’s performance after costs and on the trader’s ability to maintain sensible exposure when the market no longer produces the trends that looked straightforward in historical examples.