Volatility changes how far a market can move while a spread bet is open. At the same stake per point, a larger adverse move produces a larger cash loss. It can also make yesterday’s stop distance unsuitable for today’s conditions.
Managing volatility risk means adjusting exposure to the conditions, not predicting every price swing. The practical questions are whether your stop allows for ordinary movement, whether your stake fits that stop, and whether you could withstand a worse exit than planned.
This is one part of spread betting risk management, rather than a replacement for it. A volatility indicator cannot assess your account’s financial resilience or make a weak trading idea profitable.
What Volatility Measures, and What It Misses
Volatility measures the size and variability of price changes over a chosen period. It does not tell you whether buying or selling offers a better trade.
A market can rise sharply, fall sharply, or repeatedly reverse direction while showing high volatility. A quiet market can still produce losses, particularly when the stake is large or trading costs consume much of the available movement.
The measurement matters too. A daily high to low range, the standard deviation of daily returns, and an option implied volatility reading answer different questions. Treating them as interchangeable can lead to poor decisions about stops and exposure.
Volatility is also narrower than trading risk. It does not capture every possible gap, the terms of your order, or your ability to exit during disrupted trading. A low historical reading does not put a ceiling on tomorrow’s loss.
Compare volatility with the same market’s own history and with your intended holding period. A large daily range may matter to a swing trader, while a trader holding for several minutes also needs to examine movement and quoted spreads within that session.
How Volatility Becomes a Cash Risk
For a spread bet, the basic relationship is straightforward:
Cash profit or loss before separate charges = price movement in points × stake per point.
At £3 per point, a 20 point adverse move produces a £60 loss. An 80 point adverse move produces a £240 loss. The same stake creates very different account pressure when the market’s movement changes.
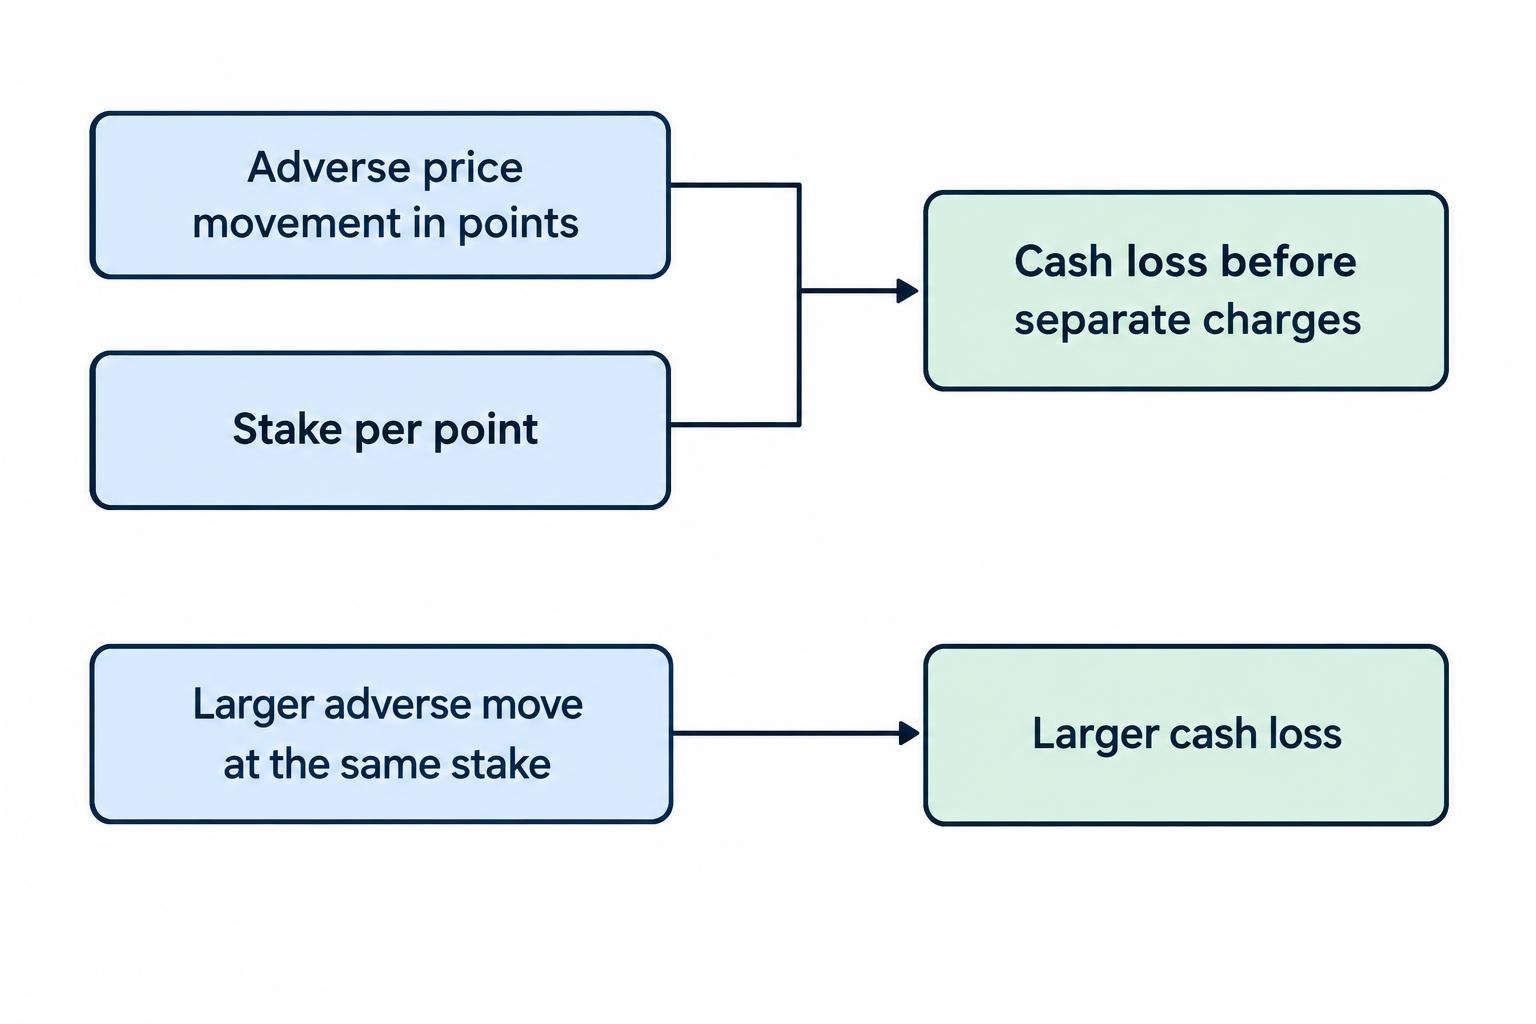
Those figures are hypothetical, but they show why a fixed stake is not a fixed risk policy. Keeping £3 per point unchanged through every market condition leaves the potential cash swings dependent on whatever the market does next.
The role of leverage risk needs care here. Once the stake and point movement are known, their cash effect is already determined. Leverage does not multiply that calculated loss again; it allows exposure that may be large relative to the account funding it.
That distinction helps prevent a common mistake: sizing a trade from the margin available rather than the loss the account can absorb. The platform accepting an order says nothing about whether the resulting exposure is sensible.
Measuring Volatility Before Placing a Trade
Recent Ranges and Average True Range
Start with the price chart. Compare recent bars with earlier bars on the same timeframe. Look at their ranges, the size of reversals, and whether movement has become unusually uneven. This provides context before adding an indicator.
Average True Range, or ATR, summarises recent true ranges. True range takes the largest of the current high to low distance, the distance between the current high and previous close, and the distance between the current low and previous close. The calculation therefore recognises gaps between bars, not just movement within them. The formula is set out in ICE’s Average True Range documentation.
A 14 period ATR uses 14 chart bars. On a daily chart those bars represent days; on a five minute chart they represent five minute intervals. Check the timeframe before interpreting the number.
If daily ATR rises from 40 points to 80 points, recent true ranges have increased. That is a reason to review a 20 point stop, not an instruction to double it automatically. The trade’s entry, invalidation level and intended holding period still matter.
Raw ATR readings also need context across markets. An ATR of 60 points on an index at 8,000 represents 0.75% of its level. An ATR of 180 points on an index at 18,000 represents 1%. Neither figure tells you the cash risk without the stake and the provider’s point definition.
Use ATR in a trading plan as a reference for recent movement. Do not treat it as a maximum range, a directional signal, or a guarantee that a stop placed beyond it will survive.
Historical and Implied Volatility
Historical volatility looks backwards. A common calculation measures the standard deviation of returns over a chosen sample and expresses it as an annualised percentage. Its reading depends on the sample length and observation frequency.
Implied volatility comes from option prices and reflects market pricing of future uncertainty. The VIX, for example, measures expected S&P 500 volatility over the next 30 days using S&P 500 option quotations. It is a volatility measure, not a forecast of whether the index will rise or fall; the construction is detailed in the Cboe VIX methodology.
For a spread bettor, these readings provide context rather than ready made trade instructions. A US equity volatility index does not directly measure the risk of a UK individual share, a currency pair, or a natural gas position.
There is no universal reading at which a market becomes safe or untradeable. Define your own trading conditions using consistent measurements, then check whether your strategy’s results support those boundaries.
Worked Example: Adjusting the Stake as Conditions Change
Consider a hypothetical £10,000 account with a £100 budget for the price loss between entry and the planned stop. That equals 1% of the account, but it is an illustration, not a recommended percentage.
Suppose three different setups require different stop distances after reviewing price structure and recent movement. The stake must change if the planned price loss is to remain £100.
| Setup | Entry to stop distance | Stake per point | Planned price loss |
|---|---|---|---|
| Smaller required stop distance | 20 points | £5.00 | £100 |
| Larger required stop distance | 40 points | £2.50 | £100 |
| Much larger required stop distance | 80 points | £1.25 | £100 |
Stake per point = planned price loss ÷ entry to stop distance.
The distances are assumptions for the example, not automatic outputs from a volatility indicator. Establish where the trade would be invalid before calculating the stake. Do not choose the stake first and squeeze the stop into whatever distance the budget permits.
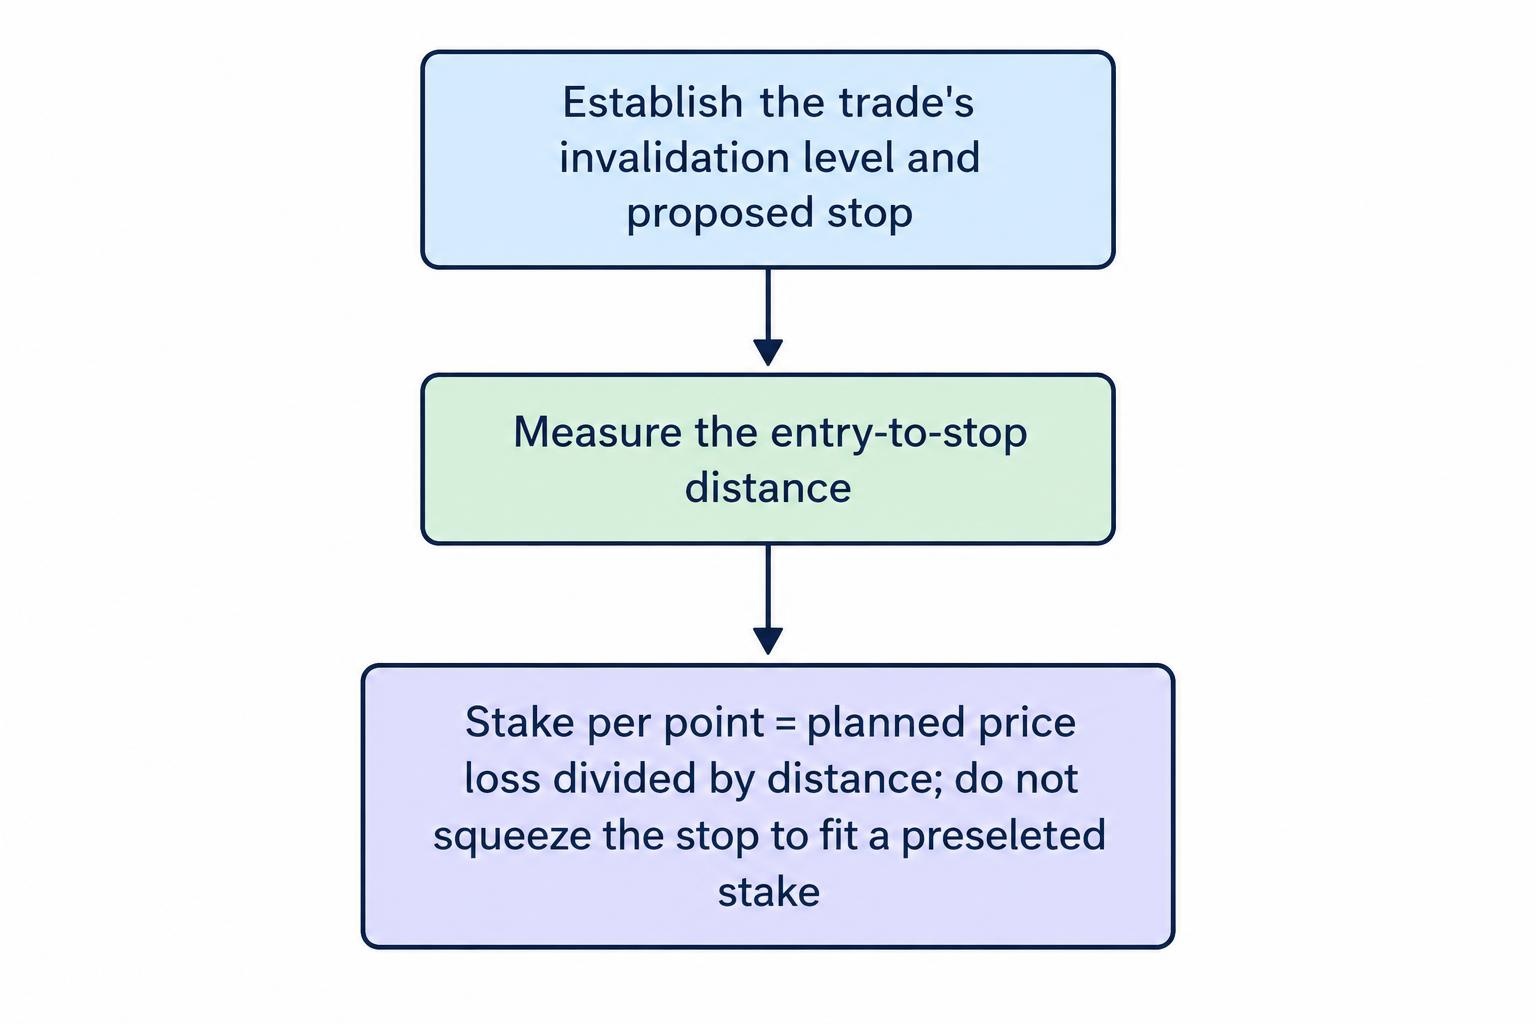
The table excludes separate charges and slippage. Measure the entry to stop distance using the relevant dealing quotes and trigger rules. If the spread is already reflected in those prices, adding it again would double count it.
If £100 is intended to cover the entire planned loss, reserve part of it for applicable charges and an execution allowance. An allowance is still an estimate, not insurance against an extreme move.
Minimum stakes can make a setup impractical. If the smallest available stake were £2 per point, an 80 point stop would represent £160 of planned price risk. The answer is to skip that trade or use a suitable alternative, not pretend the £100 budget still applies. The broader calculation belongs in position sizing for spread betting.
Set Stops for the Trade, Not for Comfort
A stop should reflect where the reason for holding the position no longer applies. Volatility helps assess whether that level is likely to sit inside ordinary price fluctuation, but it cannot decide whether the underlying trade idea is sound.
A very tight stop can be inconsistent with a strategy that expects to tolerate wider swings. Repeatedly paying the spread after small stop outs can turn apparently controlled individual losses into a damaging sequence.
Automatically widening stops creates the opposite problem. Moving an existing stop farther away at an unchanged stake increases the planned cash loss. Calling the change a volatility adjustment does not alter the arithmetic.
Reassess conditions before entry, calculate the stake around the proposed stop, and define any later adjustments in advance. The guide to managing risk with stop losses covers the wider rules for placement and changes.
For an ordinary stop, the trigger level is not necessarily the execution price. Where available, a guaranteed stop provides a contractual exit at the agreed level, subject to the product terms. Availability, minimum distances and premiums need checking before the order is placed.
Using guaranteed stops for risk control may address the exit price risk on that position. It does not prevent repeated planned losses or make excessive exposure affordable.
Volatility Can Change the Cost and Quality of Execution
Liquidity Is Not the Same as Activity
A market moving rapidly is not necessarily easy to trade. Liquidity concerns the ability to transact at available prices and sizes; it is not simply a count of how much the chart has moved.
Market makers take on price risk when providing immediate trading opportunities, and that risk influences the width of their quoted spread. The relationship between immediacy, risk and pricing is covered in CME Group’s explanation of market liquidity. For a spread bettor, the practical response is to inspect the actual dealing quote rather than infer execution quality from a busy chart.
Compare the quoted spread with the movement your strategy expects to capture. A four point spread consumes 40% of a hypothetical ten point gross price opportunity, before any other costs. A larger market range does not automatically mean a better trade after costs.
The mechanics of the bid ask spread matter particularly for short holding periods. Small targets leave less room for execution costs to rise.
Spread Widening, Slippage and Gaps
During volatile conditions, a provider’s spread may widen and an ordinary stop may execute beyond its trigger. The contract and underlying market conditions matter. The Financial Ombudsman’s guidance on spread betting disputes addresses both volatility related spread changes and the absence of guaranteed execution at ordinary stop levels.
Check which quote triggers the stop. A chart displaying a midpoint or another price series may not show the same level as the relevant bid or offer. An apparent discrepancy needs checking against the order terms and quote history, not an immediate assumption that the chart or execution is wrong.
Gaps deserve separate attention. A price can jump between available trading levels, leaving no opportunity to exit at the prices in between. An average of past ranges cannot guarantee how large the next jump might be.
Before holding through a market closure or an announcement, assess market gap risk separately from ordinary bar to bar movement. A smaller stake reduces the cash effect of a given adverse jump, but it does not remove uncertainty about the exit.
Check Account Risk, Not Just the Individual Trade
A trade can fit its own loss budget while leaving the account exposed to several losses at once. Four positions each carrying £100 of planned price risk represent £400 in total if all reach their stops at those levels, before charges or worse execution.
Separate market names do not necessarily mean separate economic exposures. Test scenarios rather than relying on labels: what happens if several equity positions fall together, or if different currency trades all suffer from the same currency move?
Review portfolio correlation and spread betting risk before adding another position. A trade that looks small in isolation may increase an exposure the account already has.
Margin creates another constraint. Under the FCA’s retail rules, a firm must close open positions as soon as market conditions allow when account net equity falls below 50% of the required margin. The rules also restrict liability for covered products to the funds dedicated to trading them in that account. These protections are set out in FCA COBS 22.5 on retail margin and negative balance protection.
Those protections are not a trading plan. They do not preserve a chosen stop level or prevent the loss of trading funds. Leave room between routine account fluctuations and the provider’s close out conditions, and check the applicable margin terms before opening positions.
Treat Scheduled Announcements as a Separate Decision
A scheduled announcement introduces a question that recent historical readings cannot answer on their own: are you willing to hold exposure while new information reaches the market?
Relevant events may include interest rate decisions, inflation releases, employment reports, company results and commodity inventory announcements. Their importance depends on the instrument and the reason for holding it.
Check the calendar, including the stated time zone, before entry. If the plan depends on exiting before a release, verify that the market is scheduled to be open and allow for the possibility that the exit will cost more than expected.
Decide in advance whether to hold, reduce, close or avoid the position. “I will see how it looks” leaves the decision until prices are moving and the cash result is harder to ignore.
A trader may correctly anticipate the eventual direction yet lose money if an initial adverse move closes the position first. Getting the broad story right does not guarantee that the entry, stop and holding period can withstand the route prices take.
There is no universal waiting period after an announcement. Assess whether quoted spreads, price movement and your tested entry conditions have returned to acceptable levels. Strategies built around these events need their own news trading rules, rather than ordinary settings carried over unchanged.
Use a Repeatable Volatility Check
A useful process needs to work before the order is placed. It should produce a decision about exposure, not just another indicator reading.
- Compare current movement with a consistent baseline. Keep the instrument, chart timeframe and measurement method unchanged when making the comparison.
- Assess the proposed stop. Check whether it fits both the trade’s invalidation level and the movement the strategy expects to tolerate.
- Calculate the cash exposure. Include other open positions, applicable charges and the possibility of worse execution.
- Inspect trading conditions. Review the dealing spread, upcoming events, trading availability and margin requirements.
- Trade smaller or do not trade. If the required stake falls below the available minimum, the setup does not fit the budget.
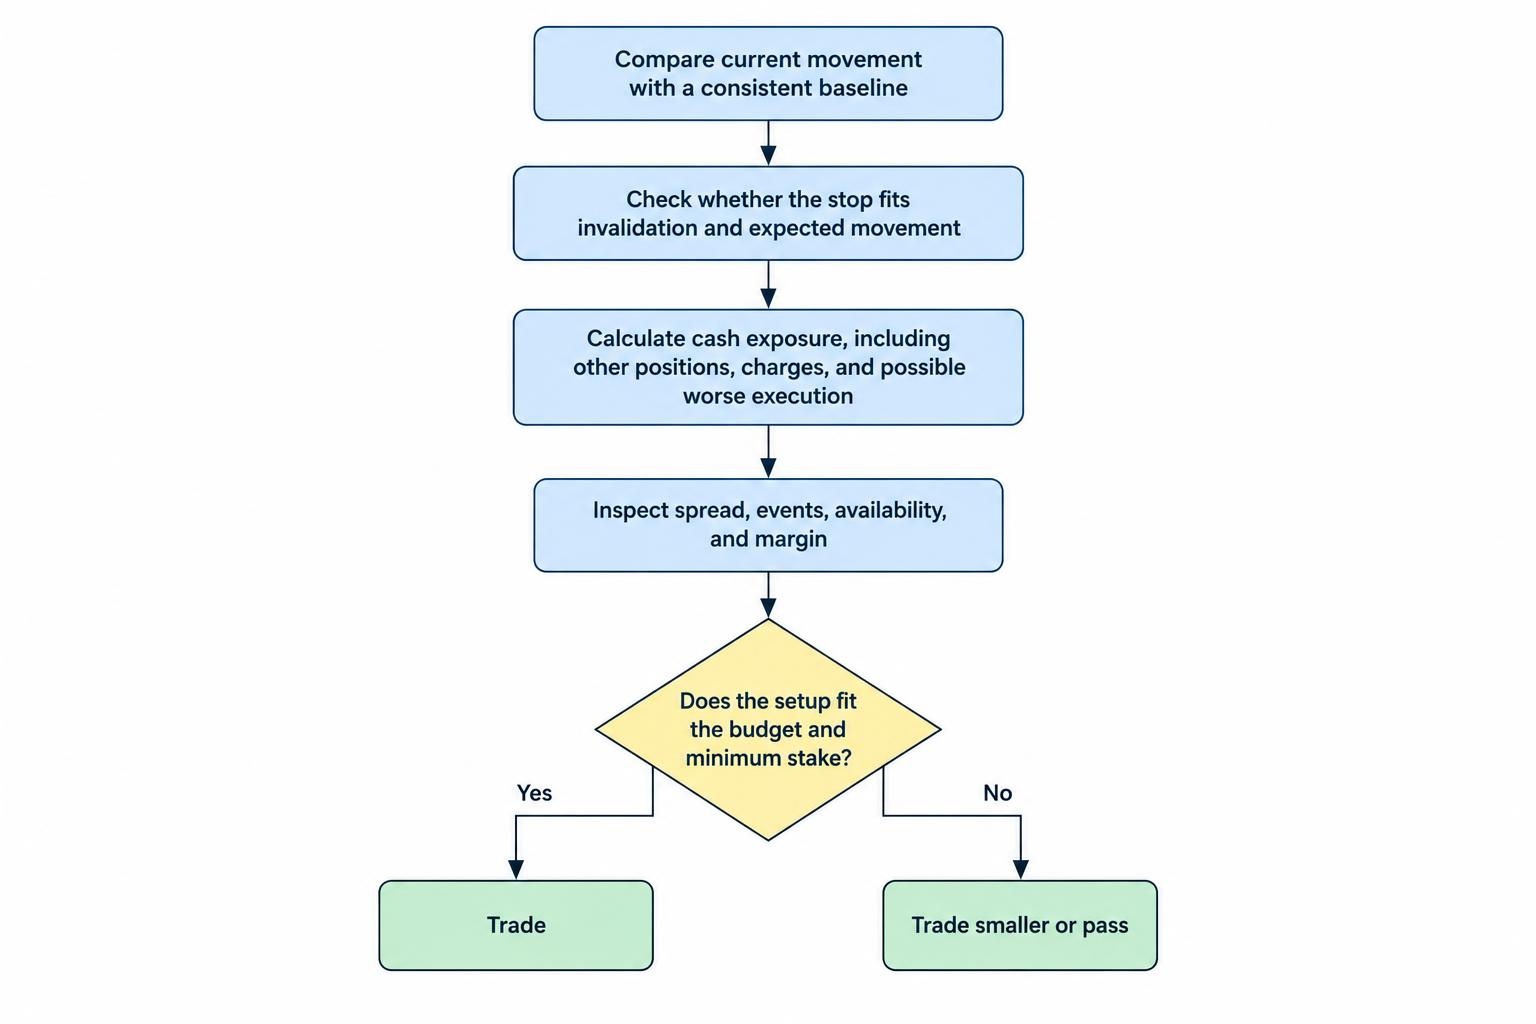
Do not automatically reverse this process when volatility falls. A smaller ATR may permit a larger stake under a formula, but recent quiet trading does not rule out an abrupt move. Consider a separate exposure ceiling so that a shrinking stop does not allow position size to grow without restraint.
Changes should also be consistent. Reducing exposure after a loss but increasing it immediately after a win makes the policy dependent on the latest result rather than the conditions it was designed to address.
Review Results by Volatility Conditions
Record the volatility measurement at entry, its timeframe, the quoted spread, planned stop distance, stake and actual exit. Add whether the position crossed an announcement or market closure.
Then compare results across the conditions in which the strategy operated. Did higher volatility coincide with larger adverse excursions? Did actual losses exceed planned losses more often? Did wider spreads consume the apparent improvement in gross returns?
A small sample cannot settle those questions. Keep definitions consistent and avoid inventing a new threshold after every losing trade. The aim is to identify repeatable weaknesses, not produce a rule that perfectly explains the last chart.
Review the account’s loss sequence as well as individual trades. Even trades that exit exactly as planned can create an unacceptable decline if too many losses occur together. A separate policy for managing trading drawdown helps define when exposure should fall or trading should pause.
The practical objective is to keep market movement and account exposure in proportion. When the required stop, available stake or execution uncertainty no longer fits the loss budget, passing on the trade is a complete decision.