Portfolio correlation measures how closely market returns, or the profits and losses on your positions, move together. In spread betting, it helps answer a practical question: are you holding several separate trades, or making the same bet several times?
A long equity index position, a long technology share and another long index position can share much of the same exposure. Different trade names do not guarantee different risks. If one announcement hurts all three, their losses arrive in the same account.
Correlation analysis belongs alongside position sizing, stop placement and account funding in a spread betting risk management plan. Its purpose is not to produce a reassuring spreadsheet. It is to identify shared exposures before they become a shared loss.
What Portfolio Correlation Actually Measures
The usual measure is Pearson correlation, a coefficient between −1 and +1 that describes a linear relationship between two sets of observations. A value near +1 indicates closely aligned movements; a value near −1 indicates opposing movements. Zero indicates no measured linear relationship, not proof that the variables are independent. These are the distinctions used in the NIST definition of the correlation coefficient.
For trading purposes, the observations might be hourly market returns, daily price changes or the daily cash profit and loss of two positions. The choice matters. A relationship measured using daily returns does not automatically describe what happens during the first few minutes after an economic release.
Correlation also says nothing about the size of a movement. Two markets can have a strong positive correlation while one moves much more sharply than the other. Nor does a coefficient of +0.8 mean they move in the same direction on 80% of occasions. It is a measure of association, not a win rate or a probability of simultaneous losses.
Use it to describe a relationship over a stated sample. Treating it as a permanent property of a market pair gives the number more authority than it deserves.
Trade Direction Changes the Relationship
Market correlation and position correlation are not interchangeable. Your direction changes whether a market movement helps or hurts the account.
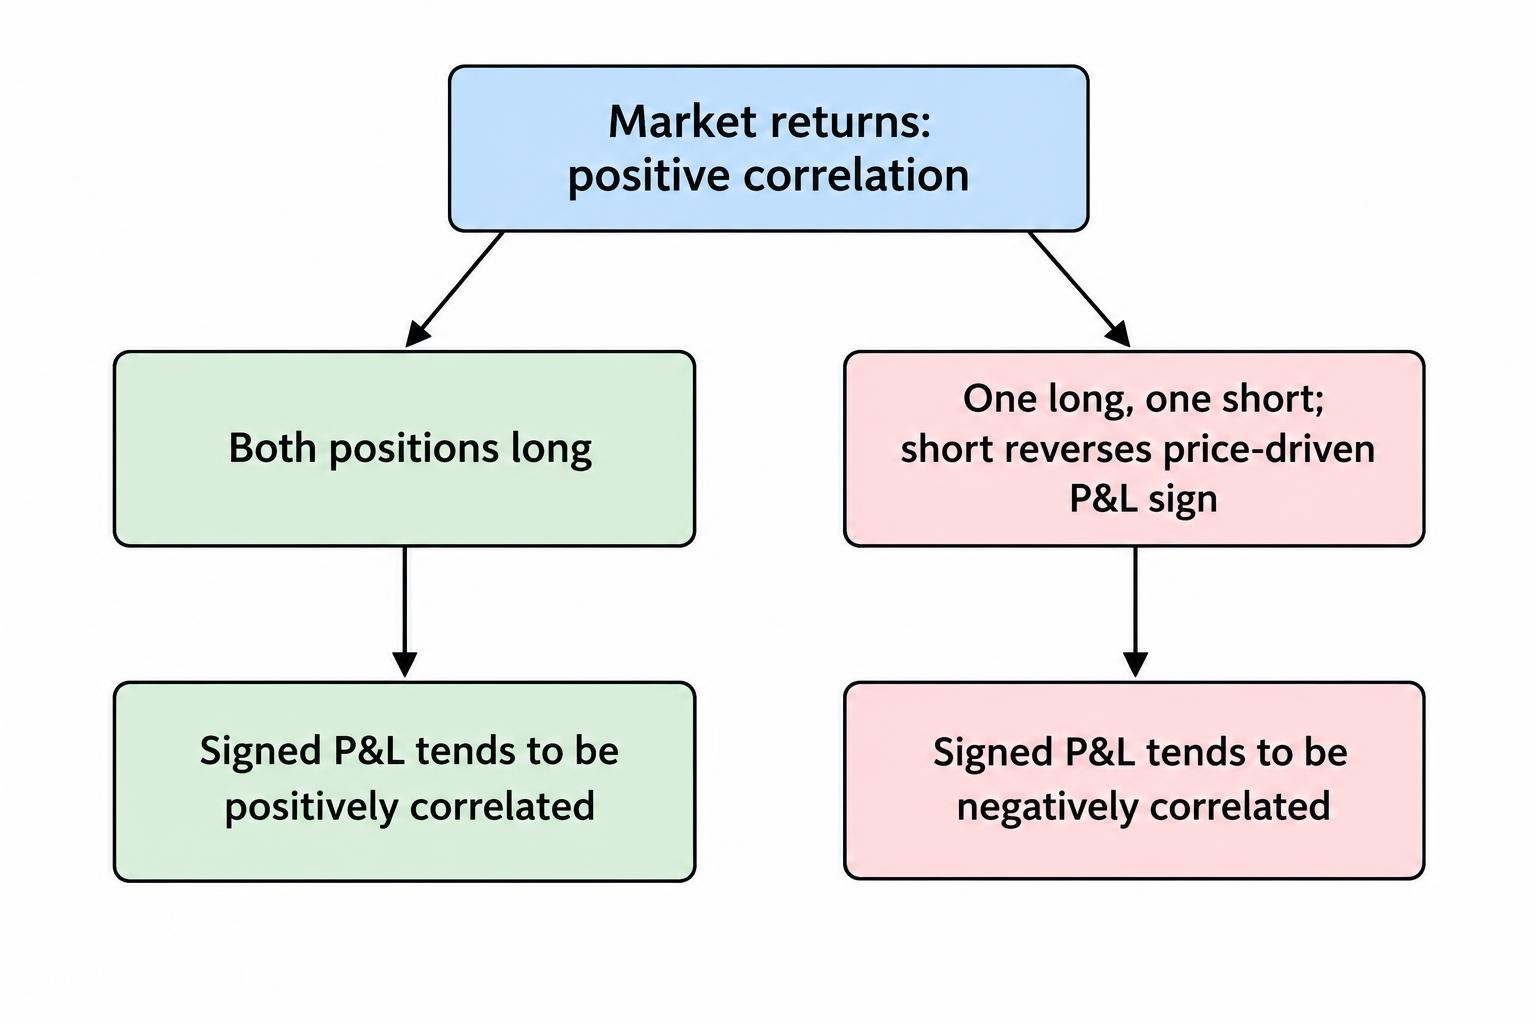
Suppose two markets have a positive return correlation of +0.8. If both positions are long, their profits and losses will also tend to move together. If one position is short, its price driven profit and loss changes sign, turning that relationship negative under a fixed exposure calculation. If both positions are short, the relationship becomes positive again.
This is why a portfolio review must record direction, not just instrument names. The distinction between long and short spread bets becomes particularly important when positions are intended to offset one another.
The reverse applies to negatively correlated markets. Buying one and selling the other can make their position losses move together rather than provide protection. “These markets usually move in opposite directions” is not enough; you must also ask which movements your trades need to make money.
Keep the calculation consistent. Either adjust market correlations for trade direction, or calculate correlations from signed position profit and loss. Do not apply the direction adjustment twice.
Where Hidden Concentration Appears
Equity indices and individual shares
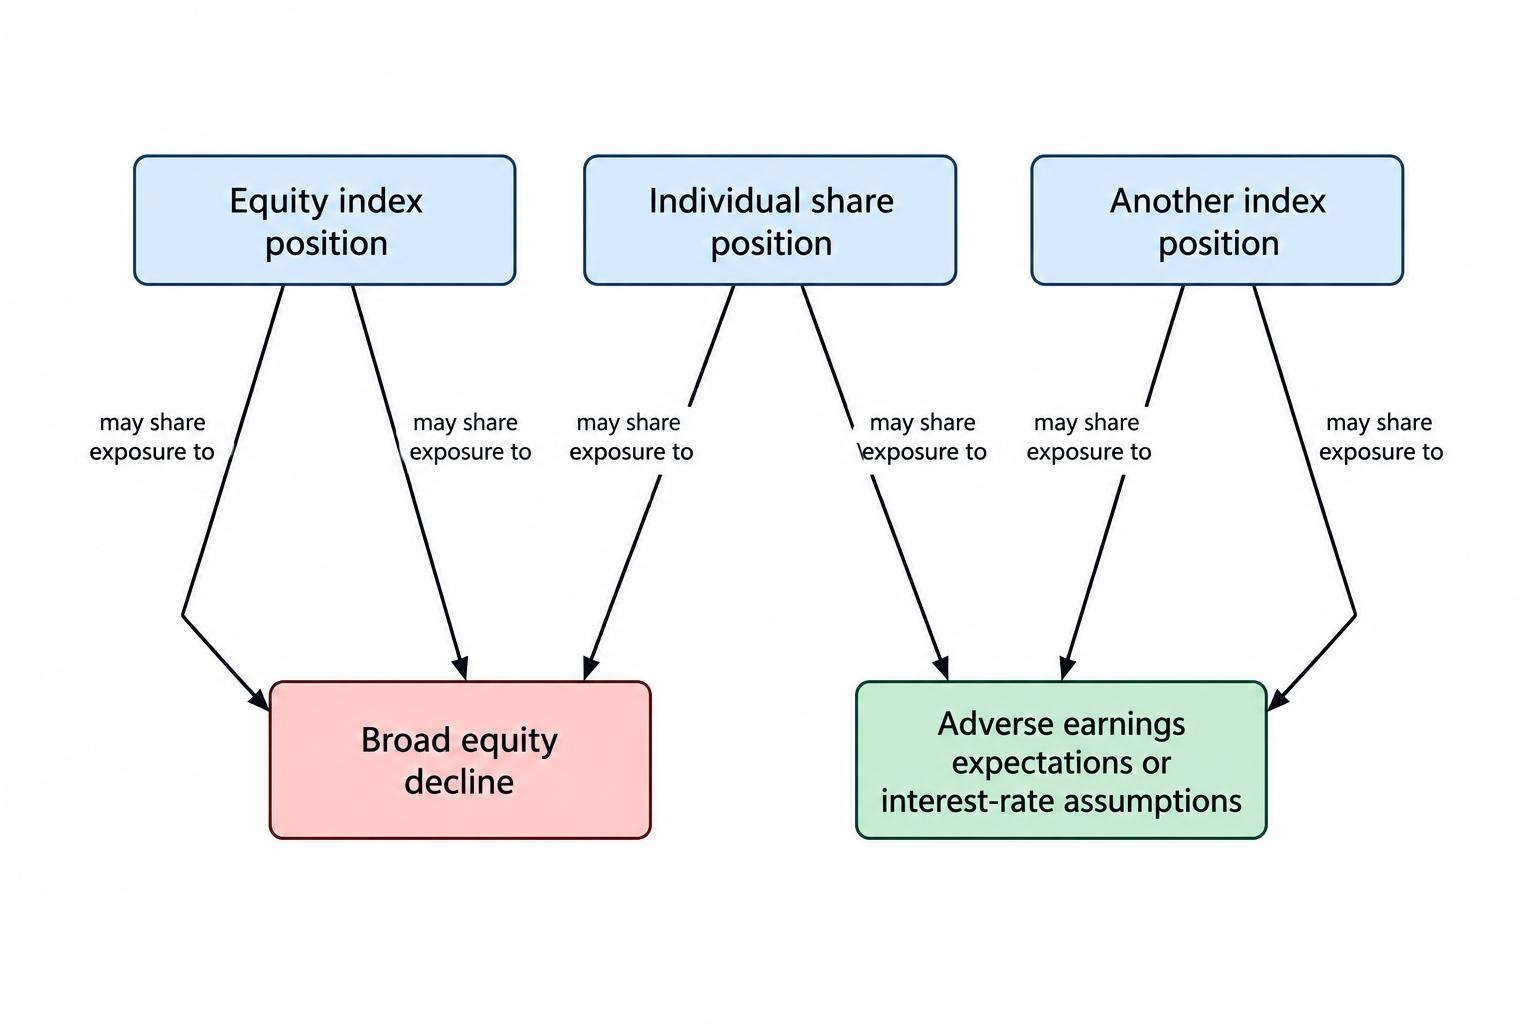
A long individual share position can duplicate part of a long index position if that company belongs to the index. Two index positions can also overlap through shared constituents or exposure to the same businesses and economic conditions.
Before adding another equity index spread bet, check what it adds to the existing book. A different country label does not, by itself, establish a different source of risk. Ask whether both positions depend on rising earnings expectations, falling interest rates or continued appetite for equities.
The useful distinction is between the number of positions and the number of independent reasons those positions could lose. Four tickets may still represent one broad view.
Currency pairs sharing the same currency
Buying EUR/USD expresses a long euro and short US dollar view. Buying GBP/USD adds long sterling and another short dollar exposure. Selling USD/JPY also expresses a short dollar view, this time against the yen.
Those trades have different counterpart currencies, but all can suffer from an adverse dollar move. A forex spread betting portfolio therefore needs a currency exposure review as well as a pair by pair review.
Equal stakes per point do not establish equal dollar exposure. Quote conventions and price levels differ, so compare the cash effect of a defined percentage movement before deciding whether positions balance.
Different asset classes sharing one economic view
Market categories can conceal shared assumptions. A trader might buy an equity index because they expect easier monetary policy, then buy a bond price contract for the same reason. These are different assets, but the trade rationale overlaps.
Write down the event that would invalidate each position. If several answers amount to “interest rates stay higher than expected”, place those trades in the same risk group for that scenario. A correlation matrix is useful, but it should not replace reading your own trade rationale.
How to Measure Correlation for a Spread Betting Account
Use comparable observations
Start with price changes or returns rather than raw price levels. Two rising price series can look closely related even when their period by period returns have a much weaker relationship.
A simple return is the current price divided by the previous price, minus one. Calculate it at matching timestamps for every market. Comparing one index at its local close with another several hours later can mix different information periods.
Check holidays, missing observations and trading sessions. A stale price should not be treated as evidence that a market remained unchanged while another moved. For intraday work, compare periods when both markets have usable prices. For positions held through the close, include the exposure that remains when one underlying market stops trading.
Also check the data series itself. Contract changes, artificial jumps in continuous futures data and corporate action adjustments can distort a calculation. Investigate unusually large observations rather than deleting them because they make the result inconvenient.
Match the sample to the holding period
An intraday strategy needs a different view from a book held for several weeks. Match the observation interval to the risk you are trying to assess, then compare more than one lookback period.
For example, a trader could examine rolling 20, 60 and 120 session estimates. Those are illustrative windows, not approved settings. Short samples react quickly but contain fewer observations; longer samples include more history but may dilute a recent change.
Record the sample dates beside the coefficient. “Correlation: +0.72” is incomplete. “Daily return correlation: +0.72 over these 60 matched sessions” tells you what was measured and makes later reviews meaningful.
Convert market movements into account money
Correlation does not tell you how much money is exposed. For a conventional linear spread bet, a simple scenario calculation is:
Position profit or loss = signed stake per point × price change in contract points.
Use a positive signed stake for a long position and a negative one for a short position. Confirm the contract’s point definition before calculating exposure. The stake per point calculation matters because an index point, a currency point and a share price point need not represent comparable market movements.
Suppose an index is quoted at 8,000, with one index unit equal to one contract point. At £2 per point, a 1% move is 80 points, producing a £160 price driven gain or loss. Another market at £2 per point can produce a very different cash result from a 1% move.
For existing positions, calculate hypothetical cash changes using the stakes you currently hold. Historical account results may reflect earlier stake sizes, closed trades and cash transfers. They do not automatically describe the risk of the present book.
Combining Correlation, Position Size and Volatility
Portfolio variance includes both the variability of individual positions and their covariance: how their gains and losses vary together. This is the basis of the calculations in MIT’s portfolio risk and covariance lecture notes.
For two positions measured in pounds over the same interval:
Portfolio variance = σ12 + σ22 + 2ρσ1σ2
Here, σ1 and σ2 are the standard deviations of each position’s cash profit and loss, and ρ is their profit and loss correlation. Take the square root to obtain portfolio standard deviation in pounds.
Assume two hypothetical positions each have a daily cash standard deviation of £100. With a correlation of +0.8, their combined daily standard deviation is about £190. At zero correlation it is about £141. At −0.8 it is about £63. The stakes and individual variability have not changed; only their relationship has changed.
These figures measure variability, not maximum loss. A £190 daily standard deviation does not cap the next day’s loss at £190. Stops, market gaps, changing exposure and execution costs also sit outside this simplified calculation.
This is where volatility and trading risk connect with correlation. A low correlation is not automatically reassuring if the new position is large enough to dominate the account’s cash movements.
Worked Example: Four Trades, One Equity Risk Group
Consider a hypothetical account with £10,000 of equity and four new long positions. Each has a planned £100 loss if its stop fills at the stated level. The table uses illustrative contract conventions and excludes financing and other fees.
| Position | Stake | Adverse distance to stop | Planned loss |
|---|---|---|---|
| FTSE 100 | £2 per index point | 50 points | £100 |
| S&P 500 | £2 per index point | 50 points | £100 |
| Nasdaq 100 | £1 per index point | 100 points | £100 |
| Technology share, quoted at 1p per point | £2 per point | 50 points | £100 |
Each trade risks 1% of starting account equity under those assumptions. Together, they carry £400 of planned stop loss exposure, or 4%. If one broad equity shock takes every position to its stop, all four losses reach the same account.
The table does not establish how likely that outcome is. It shows why checking “1% per trade” is not enough. Correlation concerns the relationship between outcomes; adding the planned losses shows the amount exposed if they occur together.
Ordinary stops also make the £400 figure conditional on execution. A gap through the stop levels could produce a larger loss. A portfolio calculation must not turn a planned exit into a guaranteed one. The distinction matters when managing trading risk with stop losses.
Suppose the trader had independently chosen a £200 budget for this equity risk group. Keeping all four positions at their original sizes would breach that budget. Possible responses include holding fewer trades or reducing each planned loss to £50, where stake sizes permit.
That £200 budget is an example, not a recommended percentage. The principle is to allocate risk to the shared exposure before dividing it among trade ideas. Opening another ticket should not create another allowance for the same view.
Why Historical Relationships Can Fail
Correlations depend on the period being measured. A useful historical example is the change in the relationship between equities and government bonds around the inflation surge beginning in 2021. US equity and government bond return correlation switched from negative to positive in mid 2021, weakening their diversification benefit. The BIS analysis of equity and bond return correlation links that change to the inflation environment and expected monetary policy responses.
The practical lesson is not that bonds always fail as a hedge. It is that a hedge built around one economic setting may behave differently when the dominant shock changes.
Nor does every correlation move towards +1 during stress. A long and short pair can lose protection if its previously positive market correlation weakens. Two long positions can lose protection if their previously negative relationship becomes positive. What matters is whether the relationship supporting your portfolio survives.
Risk measures can also become too comfortable when they rely only on recent observations. When older stress periods drop out of a sample, risk allowances can loosen together and then tighten during another disturbance. This weakness appears in the Bank of England’s 2024 system wide stress exercise findings.
Keep a separate stress view beside the rolling calculation. Test a broad equity fall, an adverse currency move, an inflation surprise and a breakdown in an intended hedge. Assign price changes, convert them into cash outcomes and inspect the resulting account equity.
Include an execution scenario too: several positions move against you while spreads widen and stops fill beyond their trigger levels. Historical return correlation alone does not measure that combination of market gap risk and execution pressure.
Setting Portfolio Limits That Address Shared Risk
Allocate a budget to each risk group
Group trades by the event or market factor that could hurt them together. Useful labels might include long equities, short US dollar or exposure to falling interest rates. A trade can belong to more than one group.
Then set a cash loss budget for each group alongside the account’s total exposure budget. Keep a separate record of planned stop losses and stress scenario losses. They answer different questions and should not be blended into a single reassuring number.
Use position sizing for spread betting to fit trades within those budgets. Do not widen a stop simply to keep a preferred stake. If the market based exit requires more distance, a smaller stake or no trade may be the consistent response.
Where two ideas share nearly the same exposure, choosing one can be simpler than splitting the allowance across both. More positions mean more exits and more opportunities for an incomplete adjustment.
Check gross exposure as well as offsets
A book with long and short positions may have modest net exposure but substantial gross exposure. Net exposure measures the balance after offsets; gross exposure measures the scale of the positions before those offsets.
A small net number does not remove the risk that the positions stop offsetting. Nor does a low correlation estimate justify expanding every position until the account’s margin is almost fully committed.
Keep a separate ceiling on gearing. Diversification assumptions and risk from leverage should be reviewed together, but neither should substitute for the other. A portfolio can look balanced statistically and still be too large for the available capital.
Maintain room for account level losses
Correlated losses reduce account equity together. A hedge can also require funding while its offset is incomplete or temporarily ineffective. Check the provider’s actual margin treatment rather than assuming an economic hedge receives a matching margin reduction.
For UK retail accounts covered by the rules, the FCA requires providers to close positions as soon as market conditions allow when net equity falls below 50% of the required margin. Negative balance protection limits liability on covered products to the funds in the trading account. These duties appear in the FCA rules on margin close out and negative balance protection.
Those protections do not preserve the account balance or make initial margin a maximum loss for each trade. Leave room between ordinary trading exposure and forced closure conditions. Review that buffer using stressed losses, not just the platform’s opening margin figure; this is a separate part of managing margin risk.
When a Correlated Position Is Intended as a Hedge
A hedge needs an identifiable exposure to offset. Buying an asset with a low historical correlation is not the same as establishing that it will gain when your existing position loses.
Start with a defined scenario. If the original position loses £300 in that scenario and the proposed hedge gains £120, the net loss falls to £180 before costs. That cash comparison is more useful than saying the two markets are negatively correlated.
The hedge ratio must reflect movement size as well as direction. Equal stakes per point rarely establish equal economic exposure across different contracts. Set the hedge against the risk being managed, and distinguish a broad market hedge from one intended to offset a particular event. The wider mechanics belong in a spread betting hedging plan.
A hedge can also leave basis risk: the position being protected and the instrument used for protection may respond differently. That difference is the trade’s residual exposure, not an accounting inconvenience.
Plan both exits. If a stop closes one side while the other remains open, the account can move from a partially offset position to a directional one. Specify whether the remaining side should be reduced, closed or reassessed.
Compare hedging with simply reducing the original trade. Extra positions bring their own spreads, potential financing charges and execution costs. A comparison of total spread betting costs helps establish whether the hedge is buying useful protection or just making the position harder to manage.
A Practical Portfolio Review Routine
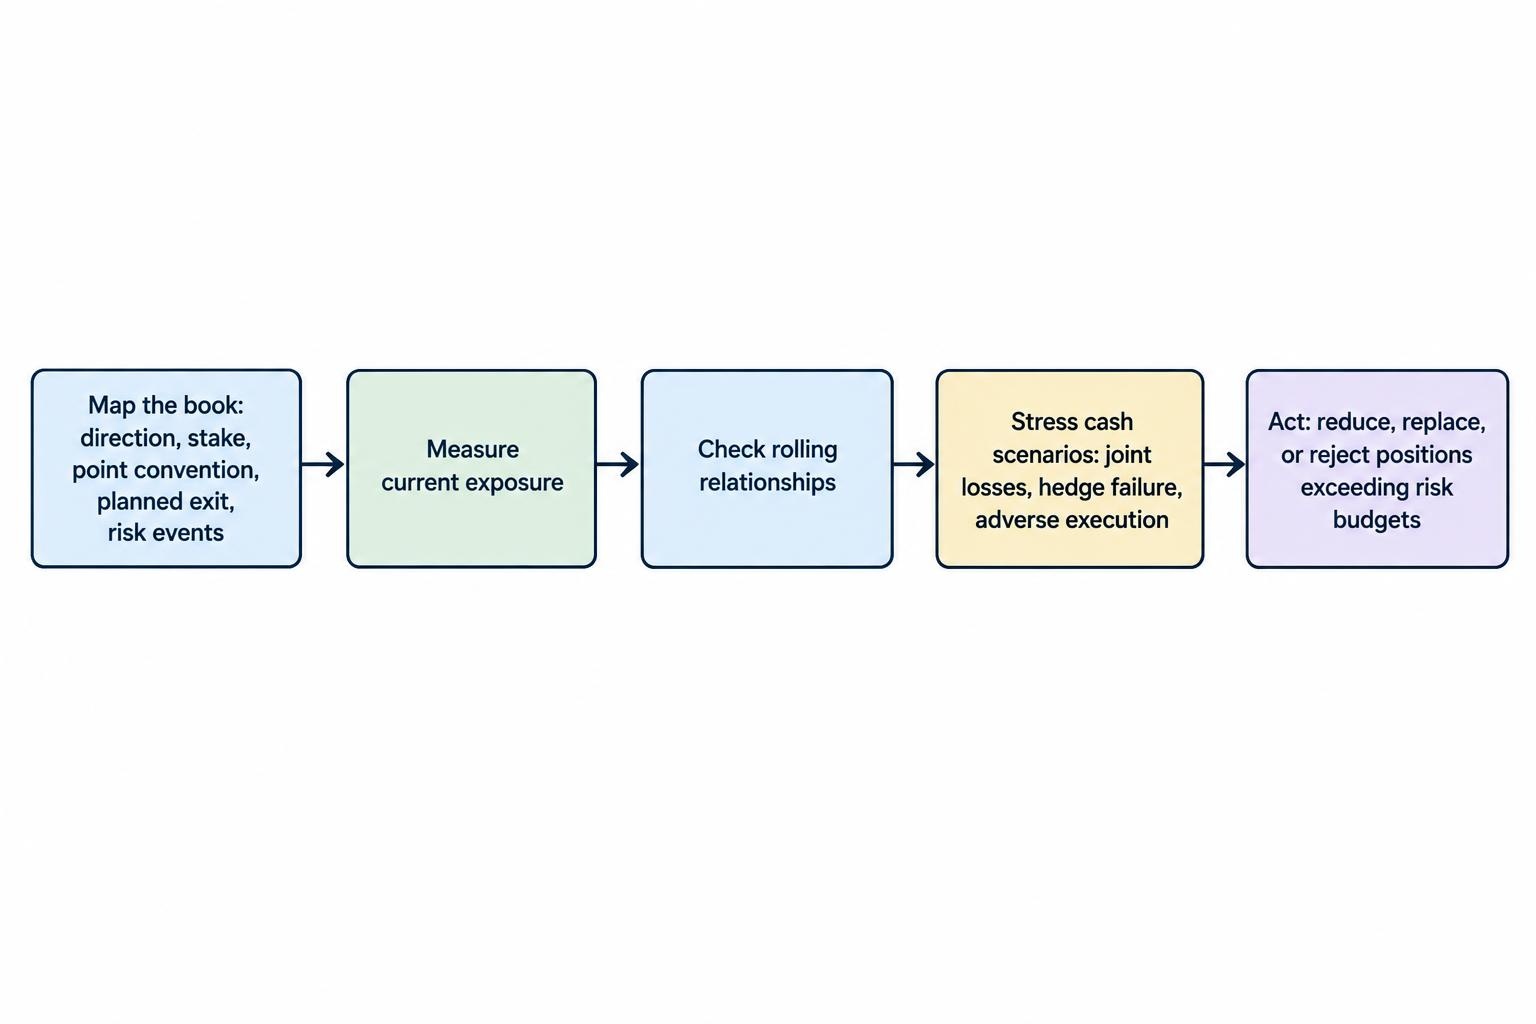
Correlation work is useful only if it changes decisions. Keep a record that makes shared exposure visible before entry, after a major price move and whenever a position is closed or resized.
- Map the book. Record direction, stake, point convention, planned exit and the events that could hurt each trade.
- Measure current exposure. Use matched market observations and today’s position sizes, not an old allocation.
- Check the relationships. Compare rolling estimates and investigate large changes rather than reacting automatically to them.
- Run cash stress scenarios. Include hedge failure, joint losses and adverse execution.
- Act on the result. Reduce, replace or reject trades that exceed the chosen group or account budget.
Record which positions actually lost together. Repeated joint losses can reveal a shared exposure that the original market labels missed. Review this alongside trading drawdown, while recognising that a short run of results does not establish a permanent relationship.
Do not add weak trade ideas just because they improve a correlation matrix. Diversification does not give a trade an expected profit, and an unused risk allowance does not need filling.
The question before adding another position is straightforward: what happens to the whole account if the view behind this trade is wrong? Correlation helps answer it, but cash exposure, stress losses and available capital determine whether the account can afford the answer.