S&P 500 spread betting lets you take a position on the direction of large US shares using a stake in pounds per index point. Buy if you expect the quoted market to rise, or sell if you expect it to fall. Your profit or loss depends on the price movement, your stake and the costs of holding the trade.
The calculation is straightforward. The risk needs more attention: a small margin deposit can support a much larger market exposure, and losses can consume your trading account. Within index spread betting, the S&P 500 also requires care over contract type, US trading hours and the difference between a cash index quote and a futures price.
What Are You Betting On?
The S&P 500 measures the performance of 500 leading US companies. It represents the large company segment of the US equity market, rather than every American listed business. The index covers approximately 80% of available market capitalisation, as set out in the S&P Dow Jones Indices benchmark overview.
The companies do not contribute equally to its movements. The standard index uses float-adjusted market capitalisation, which gives greater weight to companies with a larger value of shares available to public investors. A move in a heavily weighted constituent therefore matters more than the same percentage move in a smaller constituent. The weighting framework appears in the S&P US Indices methodology.
A spread bet does not buy those shares. You enter a contract with a provider whose quote references the index or a related futures market. You do not receive voting rights, and any dividend adjustment is a contractual account adjustment rather than a shareholder dividend.
Platforms may use labels such as “US 500” instead of the full index name. Read beyond the label. A cash contract and a dated contract can reference the same broad market while carrying different prices, funding arrangements and expiry terms.
How S&P 500 Spread Betting Works
You choose a stake for each point the quoted market moves. At £2 per point, a favourable 20-point movement produces £40 before any separate charges. An adverse 20-point movement produces a £40 loss. Doubling the stake doubles both outcomes.
Check what the provider means by one point. For the examples here, a move from 6,000 to 6,001 is one index point. A platform may display fractional price changes, but those decimals do not automatically redefine the unit used for your stake. The trade ticket and contract details should make the monetary value clear.
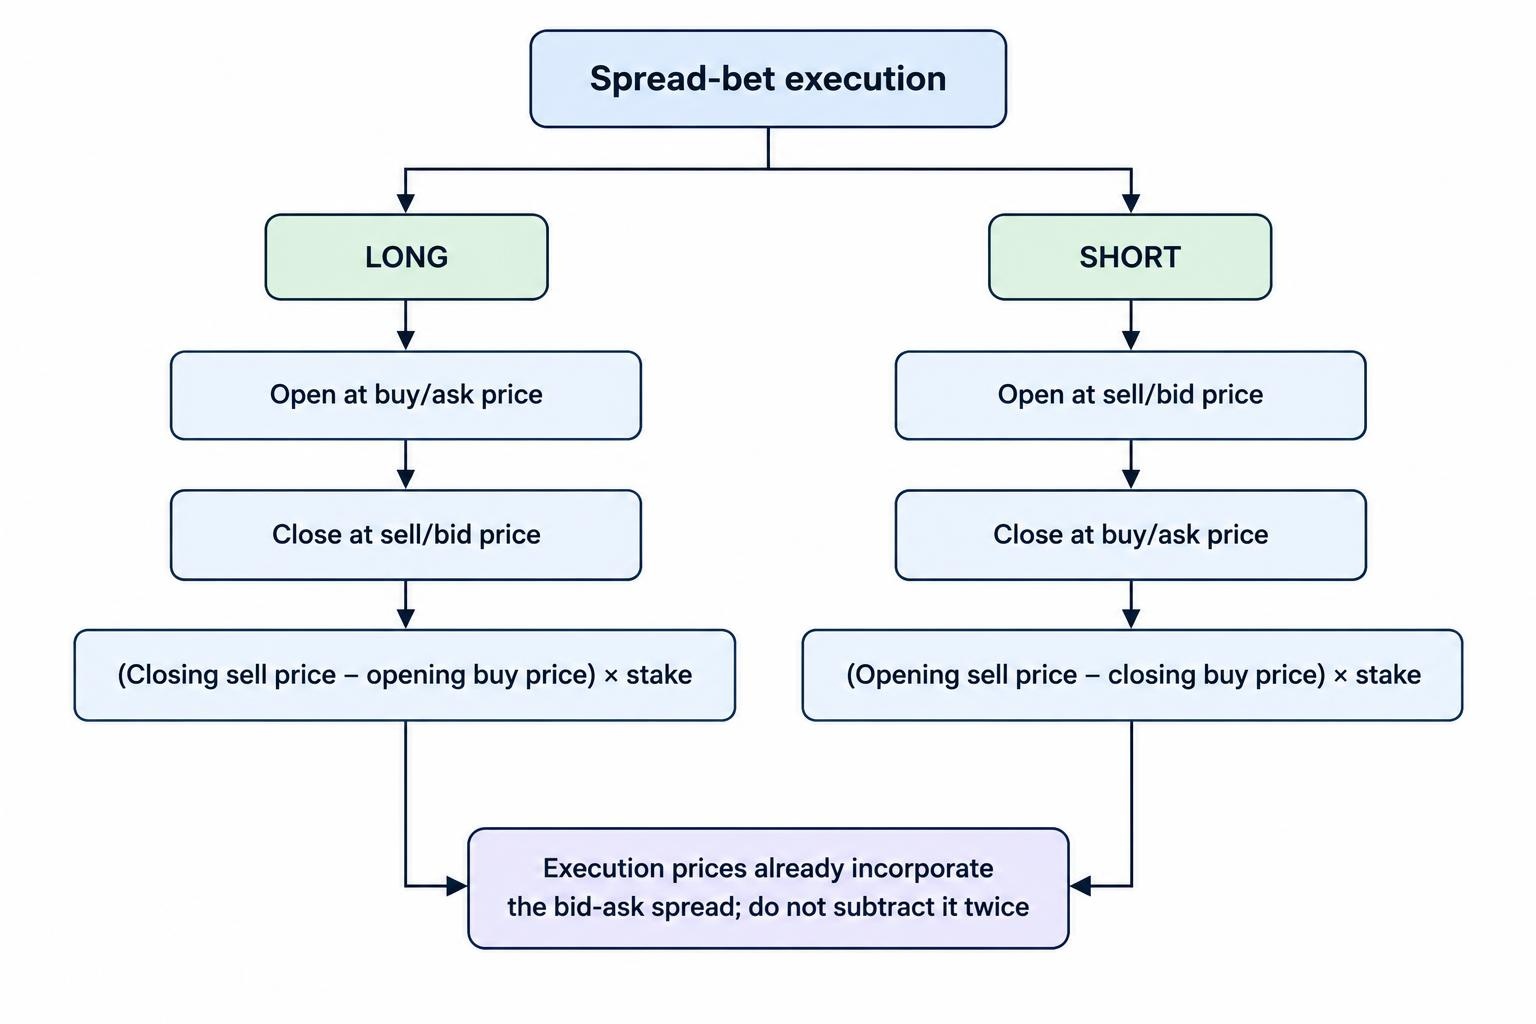
A quote has two sides: the lower sell price, or bid, and the higher buy price, or ask. You open a long position at the buy price and close it at the sell price. You open a short position at the sell price and close it at the buy price.
Suppose the quote is 5,999.5–6,000.5. The spread is one point. Buying and immediately closing at unchanged prices would lose one point multiplied by your stake. The market must move far enough in your favour to cover that opening disadvantage before the trade breaks even.
The index level is not the amount you deposit, and your stake is not your maximum loss. Keep those three figures separate. The stake per point guide covers how the monetary exposure changes as you adjust the trade size.
Does a Sterling Stake Create a Dollar Conversion?
For a contract genuinely denominated in pounds per index point, the basic trading result is calculated in pounds. A 30-point gain at £2 per point is £60; you do not then convert that £60 from dollars. This differs from owning a dollar-priced investment whose sterling value also changes with the exchange rate. Check the account currency and contract denomination rather than assuming every US market trade works identically.
S&P 500 Spread Betting Examples
The following prices are hypothetical, not current market quotes. Each example assumes one full index point is the stake unit. Results include the effect of the quoted entry and exit prices but exclude financing and other separate account adjustments.
| Trade | Stake | Opening execution | Closing execution | Result before separate charges |
|---|---|---|---|---|
| Winning long | £2 per point | Buy at 6,000.5 | Sell at 6,035.5 | 35 points × £2 = £70 profit |
| Losing long | £2 per point | Buy at 6,000.5 | Sell at 5,970.5 | 30 points × £2 = £60 loss |
| Winning short | £3 per point | Sell at 5,999.5 | Buy at 5,974.5 | 25 points × £3 = £75 profit |
| Losing short | £3 per point | Sell at 5,999.5 | Buy at 6,024.5 | 25 points × £3 = £75 loss |
For a long position, subtract the opening buy price from the closing sell price, then multiply by the stake. For a short position, subtract the closing buy price from the opening sell price, then multiply by the stake.
Use executed prices, not the chart’s midpoint or the level where you intended to trade. If an order fills at a different price, that execution determines the result. A target displayed on a chart is not a completed transaction.
Do not subtract the spread twice. When your calculation already uses the opening and closing execution prices, the bid-ask difference is already included. Separate charges still need accounting for; the guide to calculating spread betting profit and loss covers that distinction.
Cash Contracts Versus Dated S&P 500 Bets
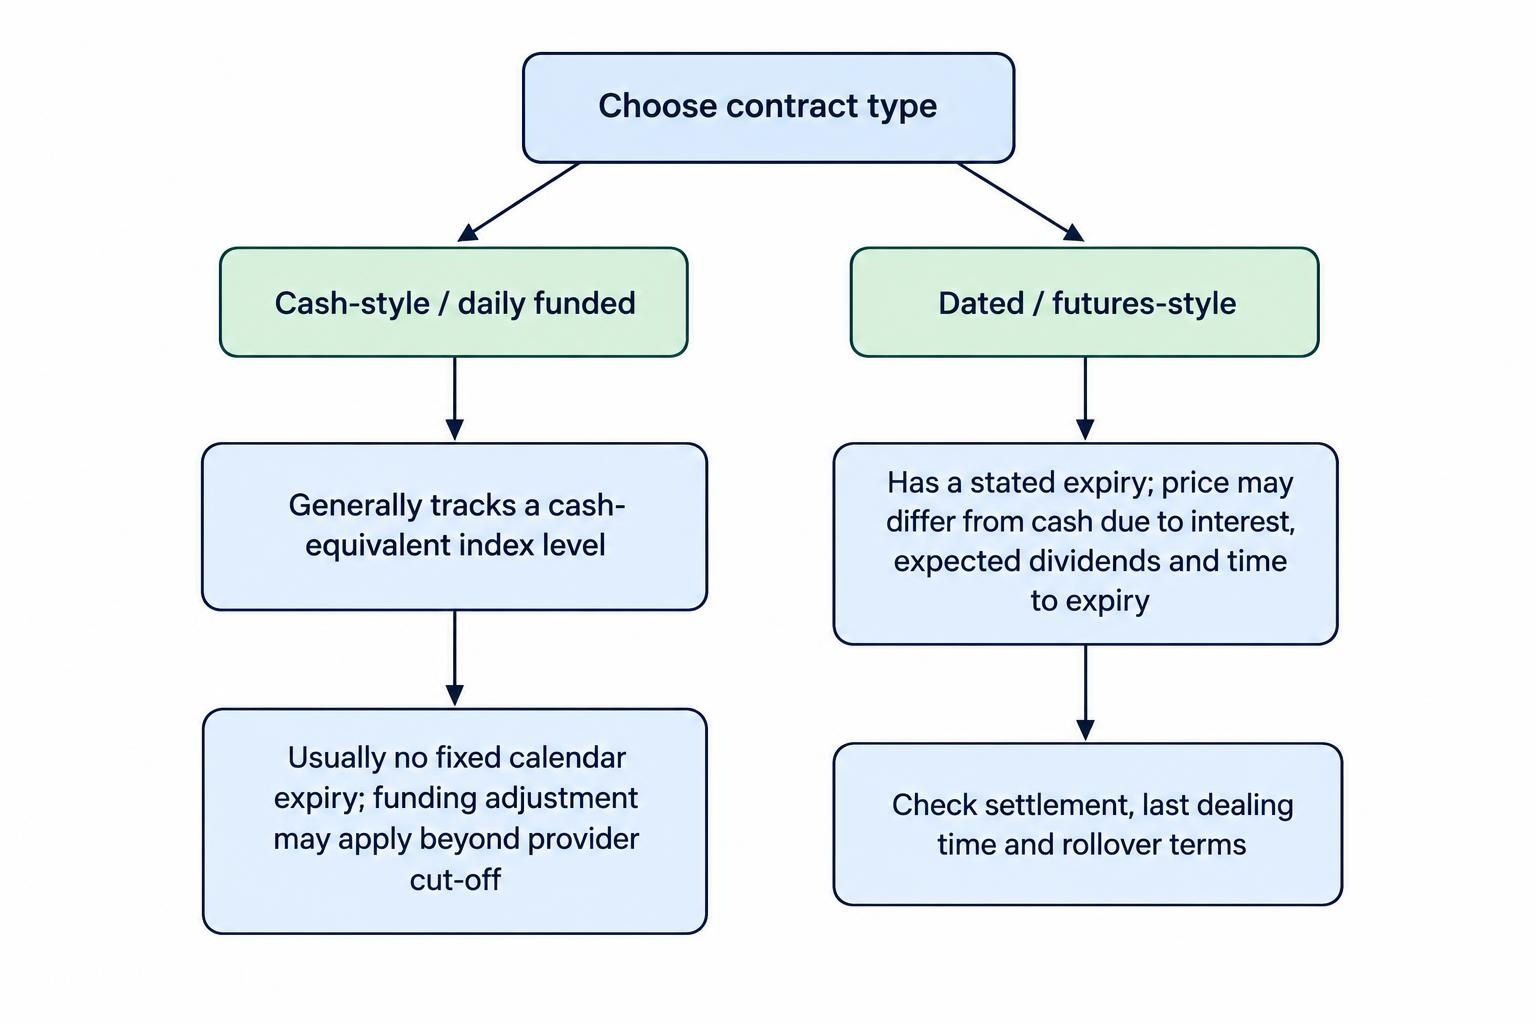
Before comparing prices, establish whether you are looking at a cash-style daily funded bet or a dated futures-style spread bet. These are different contracts, not interchangeable versions of the same quote.
Cash or Daily Funded Contracts
A cash-style contract generally aims to track a cash-equivalent index level. It usually has no fixed calendar expiry, although its continuation remains subject to the provider’s terms. Holding it beyond the stated funding cut-off can generate a financing adjustment.
This structure makes the holding period part of the cost calculation. A position opened and closed before the funding cut-off differs from one held for several nights, even if both capture the same number of index points.
Dated or Futures-Style Contracts
A dated contract references a stated expiry. Its price can differ from the cash index because stock index futures pricing incorporates interest, expected dividends and time remaining until expiry. That relationship is set out in CME Group’s stock index fair value calculation.
A higher futures quote does not, by itself, mean traders expect the cash index to rise by that amount. Part of the difference can reflect the cost of carrying the underlying exposure.
Check the provider’s final settlement method, last dealing time and rollover arrangements. Rolling a position may involve closing one contract and opening another, with costs and a different quoted level. Do not treat the price change between contract months as an ordinary market gain or loss.
The choice depends partly on your intended holding period. Compare the expected spread, funding and rollover costs using the same stake and duration. The daily funded bets versus futures comparison examines that decision without assuming one structure is always cheaper.
S&P 500 Trading Hours for UK Traders
Separate the underlying share market’s core session from the hours during which your provider quotes a spread bet. The regular NYSE session runs from 9:30 am to 4:00 pm Eastern Time, normally equivalent to 2:30 pm–9:00 pm in the UK. Holidays and shortened sessions require a separate check against the NYSE trading hours and calendar.
Those UK equivalents do not hold throughout the year. Britain changes its clocks on the last Sunday in March and the last Sunday in October, under the published UK clock change arrangements.
The US seasonal changes follow different dates. During the intervening periods, the regular US share session runs an hour earlier on the UK clock, at 1:30 pm–8:00 pm. Check the calendar rather than relying on a recurring reminder; the NIST daylight saving rules identify the US schedule.
A provider may quote its S&P 500 contract outside the regular share session, using related market prices and its own pricing arrangements. That does not mean every constituent share is trading normally throughout those hours.
Check daily breaks, holiday restrictions and the spread applicable to the hours you intend to trade. An order placed before a break may remain exposed to a different market when quoting resumes. The broader index trading hours guide covers how exchange sessions and provider dealing hours fit together.
Margin, Leverage and Position Size
The S&P 500 falls within the FCA’s major stock market index category. That classification matters because retail margin requirements depend on the underlying asset category, rather than the trading platform’s marketing label. The index is named in the FCA definition of a major stock market index.
For UK retail business covered by these rules, the minimum opening margin for a major index is 5% of exposure, equivalent to maximum leverage of 20:1. A provider can require more. The rules also require account-level margin close-out when net equity falls below 50% of the required margin, as soon as market conditions allow, and negative balance protection restricting liability to funds in the relevant account. These protections do not prevent you losing the account’s funds. The requirements appear in FCA COBS 22.5 retail trading rules.
A Margin Calculation
Using a hypothetical index level of 6,000 and a £2 stake per full point:
Approximate exposure: 6,000 × £2 = £12,000.
Opening margin at 5%: £12,000 × 0.05 = £600.
A 1% index movement equals 60 points at that level. At £2 per point, that produces a £120 profit or loss before separate costs. The £120 is 20% of the £600 opening margin, despite the index moving only 1%.
The margin is collateral, not a loss cap. Depositing only enough to open the position also leaves little capacity to absorb an adverse movement. Other open positions can affect account equity and the likelihood of forced closure.
Work Backwards From the Planned Loss
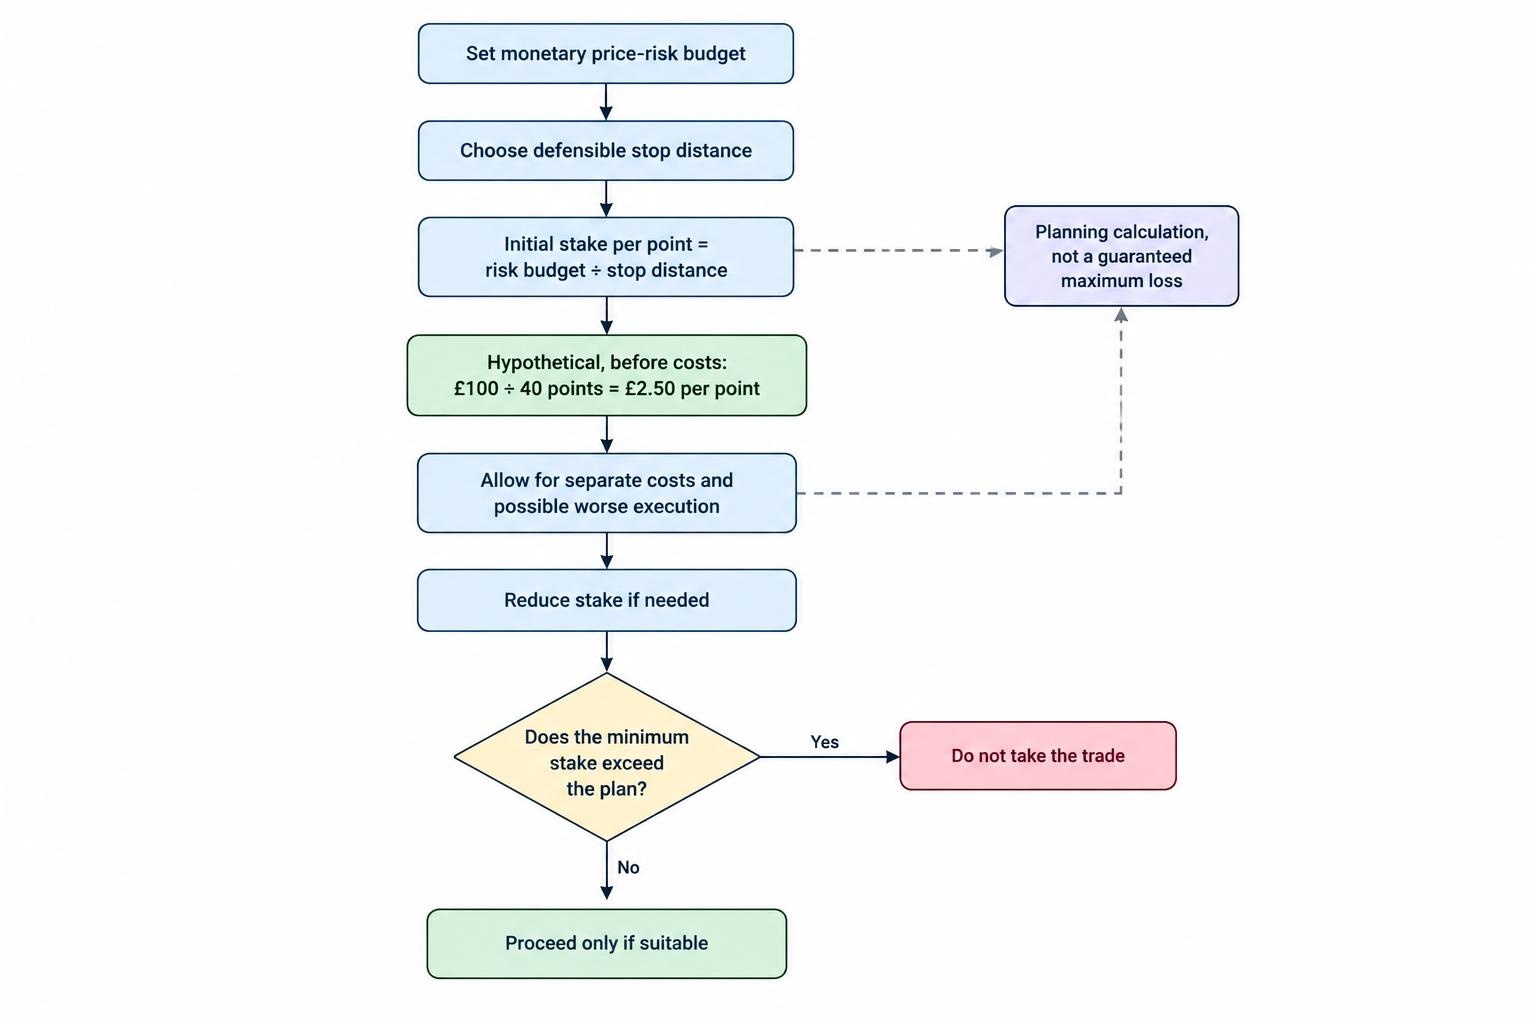
Choose the stake from a monetary risk budget and a defensible exit distance, not from the largest position the account will accept. With a hypothetical £100 price-risk budget and a 40-point stop distance, the initial calculation is £100 ÷ 40 = £2.50 per point.
That calculation assumes execution at the planned stop price and leaves no allowance for separate costs. Reduce the stake where necessary to allow for charges and execution risk. If the minimum permitted stake is too large for the plan, the trade does not fit the account.
The stop distance should reflect where the trade idea becomes invalid. Moving it closer simply to afford a larger position changes the trade itself. The position sizing guide develops this process across different account sizes and stop distances.
What Does an S&P 500 Spread Bet Cost?
The spread is the first cost to assess, but not the only one. A one-point spread costs £2 at £2 per point if you open and immediately close without a price change. A two-point spread doubles that initial price disadvantage.
Compare spreads during the hours you expect to trade. A quoted minimum does not tell you what the spread will be during a data release, an overnight session or an unsettled market. Record the actual bid and ask when assessing a trade.
Overnight Financing
For a daily funded contract, calculate the likely cost across the intended holding period. As a purely illustrative calculation, £12,000 of exposure charged at an annualised 7% on a 365-day basis would cost about £2.30 per day. That is not a current provider rate.
The real calculation depends on the contract’s reference rate, provider adjustment, day-count basis and charging schedule. Do not assume a short position earns interest, or that one evening’s debit always represents one calendar day. The overnight financing cost guide covers the terms to check.
Dividend and Other Adjustments
Cash-style index contracts can receive dividend-related adjustments. Depending on the contract, a long position generally receives a credit and a short position a debit when the relevant adjustment applies. This is intended to account for the dividend effect on the referenced index, not create a free trading profit.
Check the adjustment schedule before interpreting an account credit or debit as trading performance. The guide to spread betting dividend adjustments explains the mechanism. Guaranteed stop premiums, currency conversion where applicable and rollover costs can also affect the final result.
What Moves the S&P 500?
Interest rate expectations matter, but “rates down, shares up” is not a dependable trading rule. Equity prices can respond to changes in bond yields, required returns and expectations about policy. The distinction between an expected decision and a surprise is central to Federal Reserve research on monetary policy and stock returns.
Inflation and employment releases belong on the preparation checklist because they provide information traders use to reassess the economy and potential policy decisions. Confirm release times rather than copying last month’s diary. The Bureau of Labor Statistics release calendar publishes schedules in Eastern Time.
Company results also matter through the index’s weighting structure. When reviewing earnings, ask which constituents carry enough weight to affect the index and what their announcements imply for other businesses. Five hundred companies does not mean five hundred equal voices.
Distinguish the headline from the market’s response. A strong economic number might support expectations for company earnings while also raising concerns about interest rates. Those interpretations can pull in opposite directions. A trading plan needs an observable entry and exit condition, not just a view that the news sounds positive.
Planning Entries and Controlling Execution Risk
A practical S&P 500 trading plan should identify the contract, session, entry condition, invalidation level and intended holding period. “The index looks strong” is an opinion. “Buy only after a defined resistance break, with an exit below a stated level” is at least a plan that can be assessed.
A breakout approach can fail when the price moves through a level and then reverses. Before entering, decide whether the trigger requires a traded price, a candle close or a retest. The breakout trading guide covers the method; no chart pattern removes the need to size the potential loss.
Align chart analysis with the contract you trade. A level drawn on a cash index chart may not match a dated futures quote. Also establish whether your chart displays bid, ask or midpoint prices. A short position’s closing buy price can reach a stop even when a bid-only chart appears not to have touched it.
Ordinary Stops Are Not Guaranteed Prices
An ordinary stop-loss can execute beyond its trigger during a fast move or a gap. A stop 40 points away therefore represents a planned exit distance, not an unconditional promise that the loss will stop at 40 points.
If the provider offers a guaranteed stop for the contract, check the premium, permitted distance and amendment rules. Use the guide to guaranteed stop-loss orders to separate contractual price protection from an ordinary stop instruction.
Account for related positions too. An S&P 500 long, another US equity index long and several US share longs can express much the same market view. Different tickets do not necessarily create different risks. Assess the combined loss scenario using portfolio correlation and spread betting risk, rather than checking each trade in isolation.
Before Placing an S&P 500 Spread Bet
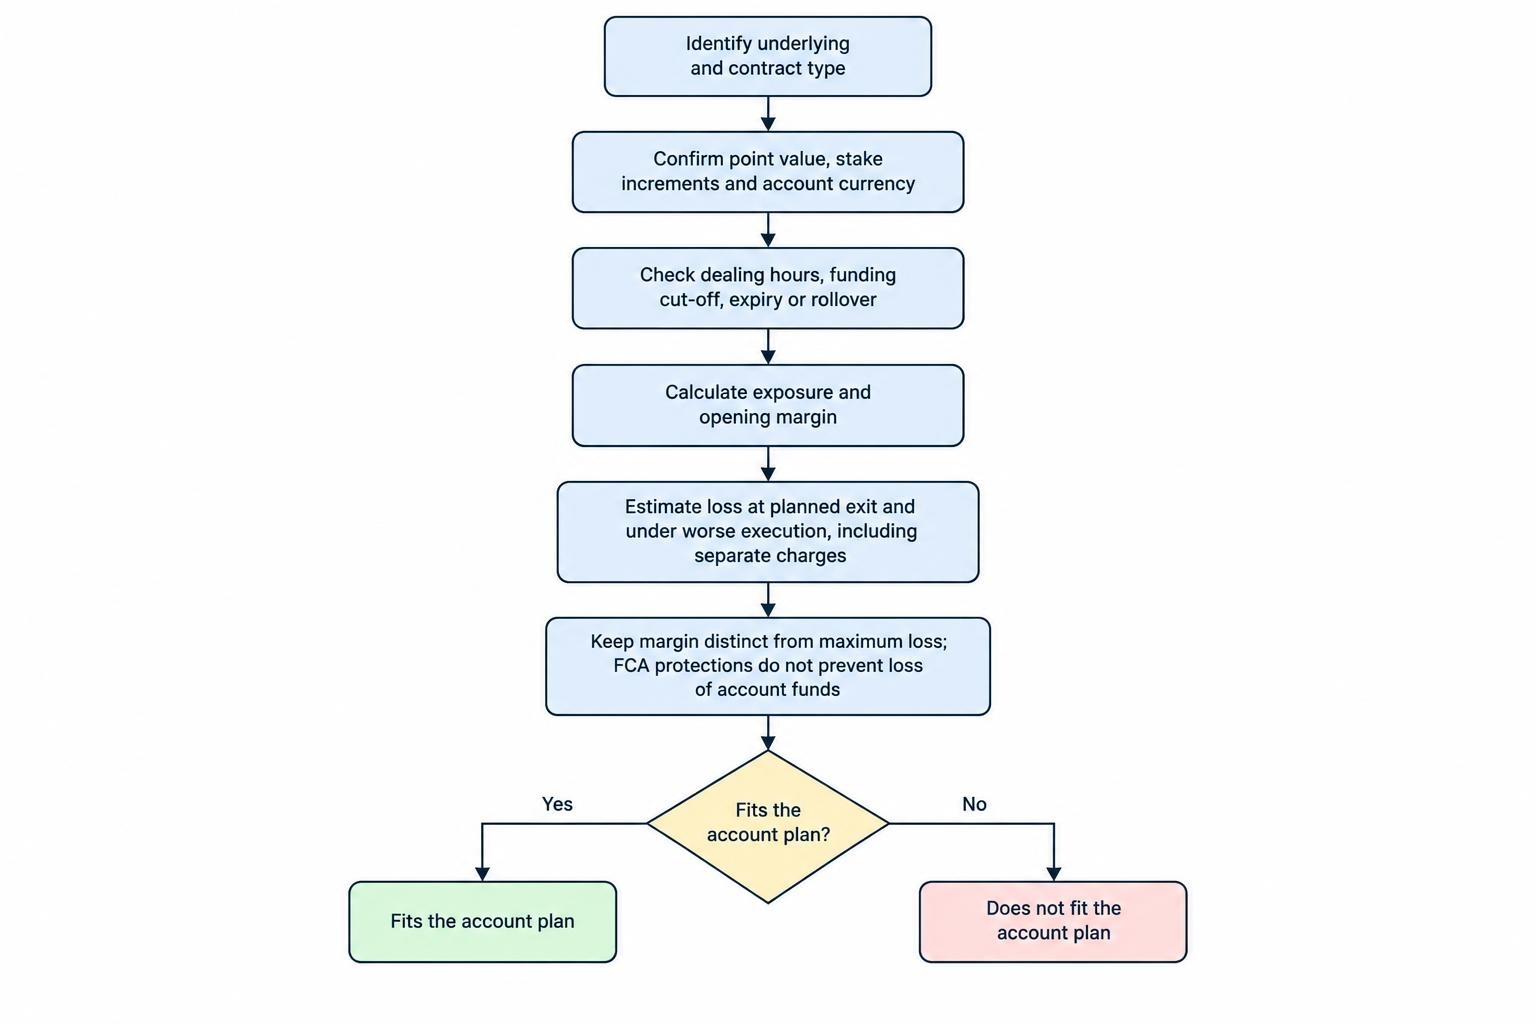
Read the contract details before committing funds. At minimum, confirm:
- The underlying reference and whether the contract is cash-style or dated.
- The value of one point, permitted stake increments and account currency.
- The dealing hours, funding cut-off and any expiry or rollover arrangements.
- The opening margin, stop execution terms and potential separate charges.
- The monetary loss under both the planned exit and a worse execution scenario.
A demo account can help you check the arithmetic, order ticket and contract selection without putting money at risk. It does not establish how a live order will execute during stressed conditions. Use spread betting demo accounts to practise the process, not to assume a profitable simulation proves a trading edge.
If your aim is to accumulate long-term exposure to US shares rather than trade shorter price movements, compare the product structure before opening a leveraged position. The spread betting versus ETFs comparison covers that separate decision.
A workable S&P 500 spread bet starts with a clear contract and an affordable loss scenario. The stake comes after those decisions, not before them.