Sector spread betting lets you take a position on a group of related companies rather than one share or the whole stock market. You might expect banks to rise, energy companies to fall, or healthcare shares to outperform a broader index. The trade expresses that view through a stake per point on an available sector market.
The attraction is more focused exposure. The danger is mistaking a group of companies for a diversified investment. A sector can concentrate the same economic risks across several holdings, and a small number of large companies may dominate its movement.
What Is Sector Spread Betting?
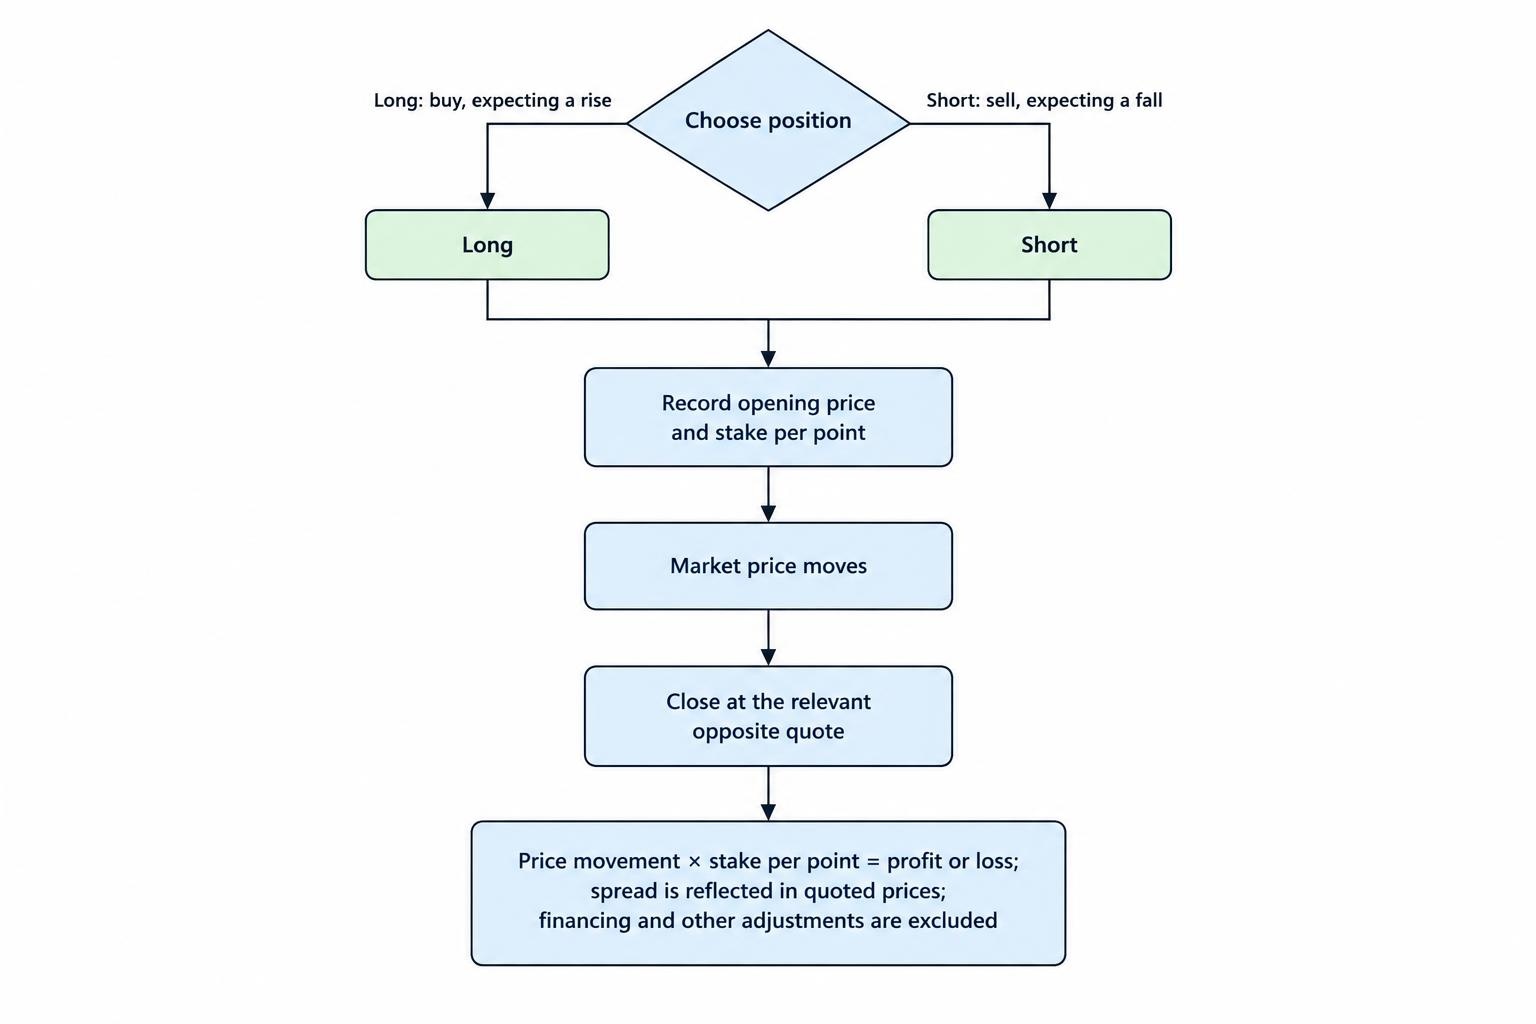
A sector spread bet is a financial bet on the price movement of a market representing companies in a related business area. You buy if you expect the quoted price to rise and sell if you expect it to fall. Your profit or loss depends on the movement between your opening and closing prices, multiplied by your stake per point.
You do not own the constituent shares, receive voting rights or hold units in an investment fund. Where the underlying market is a sector index, the mechanics resemble index spread betting, but the exposure covers a narrower slice of the equity market.
UK sector benchmarks include the FTSE 350 Supersectors Indices, which draw their companies from the FTSE 100 and FTSE 250. The FTSE UK Index Series overview identifies these industry benchmarks alongside the broader UK indices. Their existence does not mean every spread betting provider offers them.
“Sector” also gets used loosely. The Industry Classification Benchmark structure separates industries, supersectors, sectors and subsectors. A broad financials market and a narrower banks market are not interchangeable. Read the full benchmark name rather than relying on the shortened label on a trading screen.
Direct sector markets, ETFs and share baskets
Start by establishing what the contract actually tracks. A direct sector index bet references an index. A bet on a sector exchange traded fund references the fund’s quoted share price. A basket assembled from separate share bets creates another form of exposure, with a separate position and trading costs for each company.
If a direct sector market is unavailable, an ETF might offer another route, provided the relevant fund is available for spread betting. However, ETF spread betting introduces fund selection questions: what it holds, how it weights companies, whether it uses borrowing or derivatives, and how closely it follows its stated benchmark.
A bet on one large oil company is not a substitute for an entire energy sector without qualification. It adds that company’s operating, management and financial risks to the wider industry view.
How a Sector Spread Bet Works
Suppose a hypothetical sector market is quoted at 6,000 to sell and 6,010 to buy. In this example, one betting point equals one full index point. You expect the sector to rise and buy at £2 per point.
Your opening price is 6,010. If the quote later reaches 6,100 to sell and 6,110 to buy, you close by selling at 6,100:
Profit = (6,100 − 6,010) × £2 = £180.
If the quote instead falls to 5,900 to sell and 5,910 to buy, closing the position produces:
Loss = (5,900 − 6,010) × £2 = −£220.
Both results exclude financing and other adjustments. The spread is already reflected in the opening and closing prices, so do not subtract it again. Closing immediately at an unchanged quote would produce a £20 loss: the ten point spread multiplied by £2.
A short position reverses the calculation. Selling at 6,000 and later buying back at 5,910 produces a 90 point gain, or £180 at £2 per point. A rising price creates a loss instead.
Check the contract’s point definition before using these calculations. Displayed decimal places and betting points are not necessarily the same thing. The stake per point calculation must match the provider’s contract specification, not an assumption based on the chart.
Read the Constituents Before Trading the Label
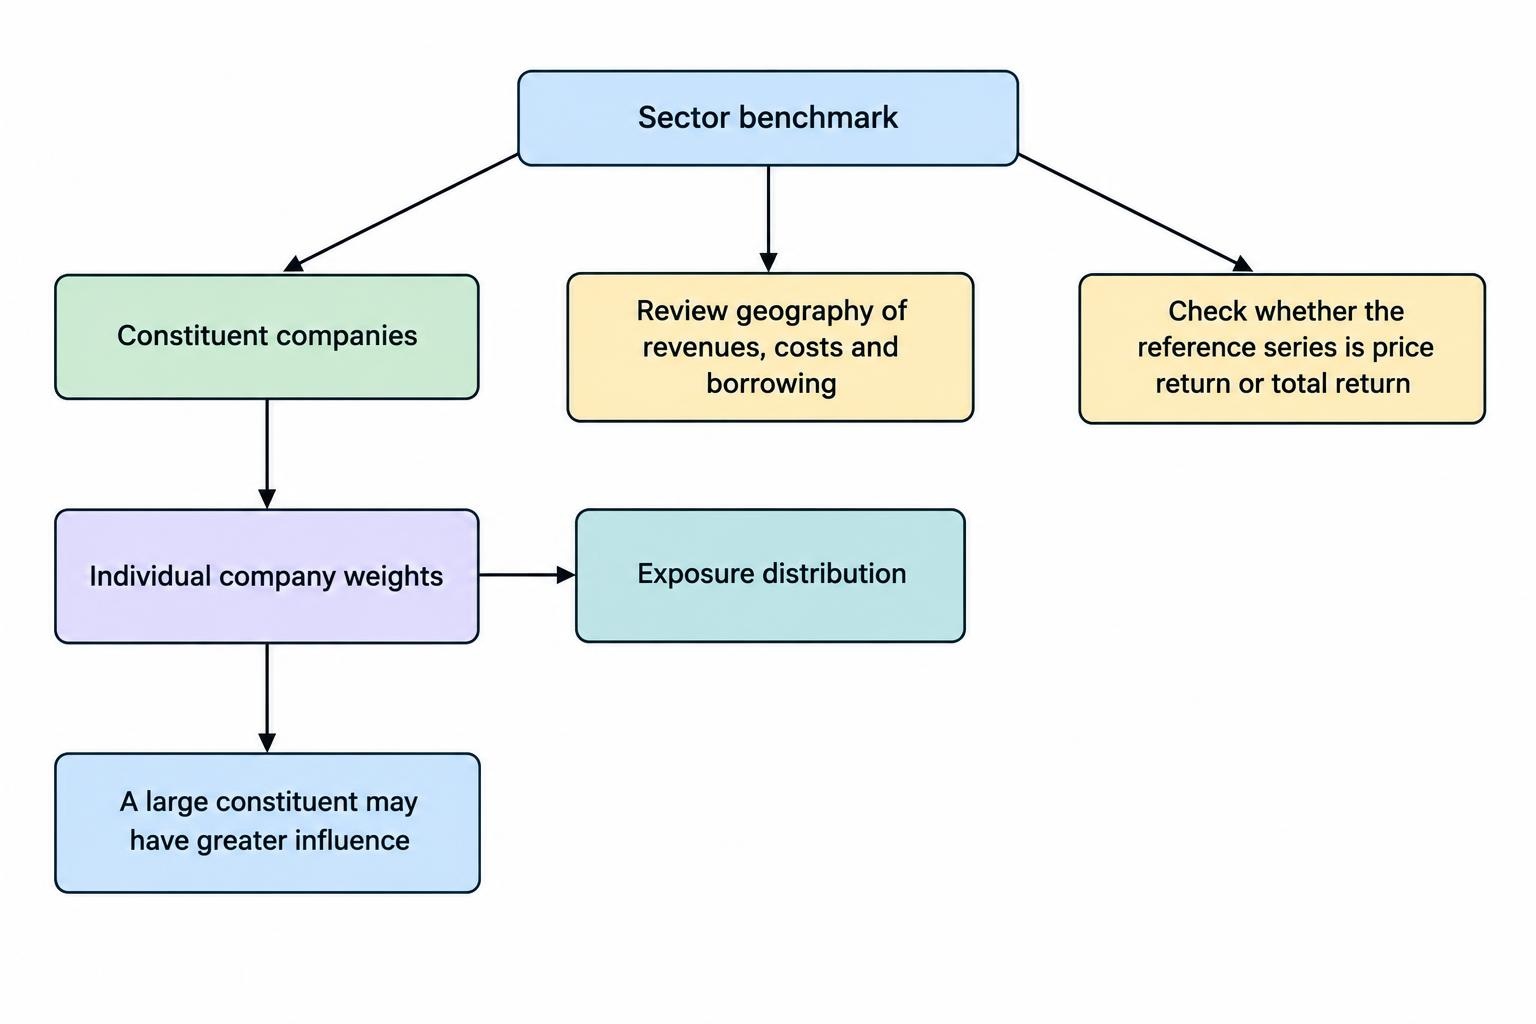
A sector name tells you the general business area. It does not tell you how evenly the exposure is distributed.
Check whether the benchmark uses market capitalisation, equal weights or another method. Look for caps on individual company weights and establish how much of the index sits in its largest constituents. Ten companies do not provide ten equal sources of risk if two dominate the index.
Consider a hypothetical index where one company has a 30% weight. If that company falls 10% while every other constituent stays unchanged, its direct contribution would pull the index down by roughly 3%, ignoring other calculation effects. A sector bet can therefore react sharply to one company’s results.
Geography needs the same attention. Check where the companies earn revenue, incur costs and borrow money. A UK listing does not, by itself, establish that the trade expresses a view on UK domestic demand.
Also check whether the reference chart shows price return or total return. Compare like with like when assessing performance; a series that includes reinvested dividends answers a different question from one that tracks prices alone.
What Moves Sector Prices?
A useful sector thesis connects an event to company earnings, financing conditions or valuations. “Interest rates are changing” is not enough. You need a reason why the change should help or hurt the companies represented in your chosen market.
| Sector exposure | Questions to investigate | Assumption to challenge |
|---|---|---|
| Banks and financial services | How would changing rates affect lending income, deposit costs and borrower defaults? | Higher interest rates must lift bank shares. |
| Energy producers | How do commodity prices interact with production costs, hedging and the business mix? | Energy shares should copy the oil price. |
| Mining and materials | Which commodities matter most, and what could change demand or operating costs? | All mining companies provide the same commodity exposure. |
| Property and utilities | How exposed are the constituents to refinancing, asset valuations and regulatory decisions? | A defensive business necessarily means a stable share price. |
| Retail and consumer businesses | Can companies protect sales volumes and margins if household budgets or input costs change? | Stronger sales automatically mean stronger profits. |
Banks show why simple rules can fail. Higher rates can support lending income while also creating pressure through funding costs, borrower distress and asset valuations. The Bank of England’s December 2025 bank stress analysis examines net interest income alongside credit impairments and valuation losses. A rate forecast needs a second step: identifying which effect matters most to the banks in the index.
Energy exposure needs similar care. Decide whether your thesis concerns producers’ profits or the commodity price itself. If it is only about the price of a barrel, crude oil spread betting addresses a different underlying market from a basket of energy shares.
Separate the business outlook from the entry price too. An improving industry can still produce a losing long trade if the price already reflects a more optimistic outcome. A sector label is not a trading thesis, it is a starting point.
Three Ways to Use Sector Exposure
Take a directional position
A directional trade backs a rise or fall in the sector’s absolute price. You might buy after a sector breaks above a trading range, provided the constituents and business outlook support the same view.
Define what would invalidate the trade. That might be a price level, a change in earnings expectations or an event that removes the original reason for entering. “The sector still looks cheap” is a poor replacement for an exit plan once losses start growing.
Check whether the move is broad or driven by one heavyweight. A breakout supported by several constituents is a different setup from an index rise caused almost entirely by one company.
Trade relative sector performance
A relative trade buys one market and sells another. The intention is to profit from the difference in performance rather than relying entirely on a rising stock market. For example, a trader might expect one sector to hold up better than another during weaker economic conditions.
Equal stakes per point do not create equal exposure. At £1 per point, a market priced at 20,000 has roughly four times the notional exposure of one priced at 5,000, assuming identical point conventions. Equalising notional values still does not equalise volatility or sensitivity to the wider market.
This is a form of pairs trading, not a naturally risk free position. Both legs can lose, and each carries its own spread, financing terms and execution risk.
Hedge an existing holding
A short sector position may offset some losses in a portfolio concentrated in related shares. The match will be imperfect unless the portfolio closely resembles the benchmark in both composition and weights.
A holding in a domestic lender, for example, may behave differently from a benchmark dominated by internationally exposed banks. The shares could fall while the hedge rises, making both positions lose. Set a review date and a reason to remove the hedge; otherwise a temporary defence can become an expensive second portfolio.
Costs That Can Change the Trade
Evaluate the spread against the movement you intend to capture. In the earlier example, a ten point spread costs £20 at £2 per point. That matters far more to a trade targeting 30 points than one targeting 300, although neither target is assured.
Compare spreads in cash terms rather than treating the smallest point figure as automatically cheapest. Different index levels, betting point definitions and stake sizes can make a superficially narrow spread more expensive for equivalent exposure.
For positions held beyond the daily funding cut off, check the financing calculation and the relevant contract terms. Overnight financing costs can change the economics of holding a sector view for weeks rather than hours. A long term business argument does not automatically make a funded spread bet a suitable long term instrument.
Dividend treatment also matters. Establish whether the contract references a cash price index, a total return index or another instrument. Where a contract uses separate spread betting dividend adjustments, assess the price movement and adjustment together. A dividend related price drop is not automatically a free profit for a short position.
Finally, confirm expiry, rollover arrangements, any short borrowing charges and currency terms. A sterling stake establishes your cash movement per betting point; it does not remove currency influences from the underlying companies or benchmark.
Margin Is Not the Amount at Risk
The earlier £2 per point position opened at 6,010 has approximately £12,020 of notional exposure, given the stated point convention. If its quoted initial margin rate were 10%, the opening margin would be about £1,202. This is an illustration, not a quoted requirement for an available sector market.
UK retail rules distinguish major and minor stock market indices, with minimum initial margin requirements of 5% and 10% respectively. Providers can require more. The rules also include account level margin close out and negative balance protection, but neither makes an individual trade’s opening margin its maximum loss. These requirements sit within the FCA rules for CFDs and financial spread bets.
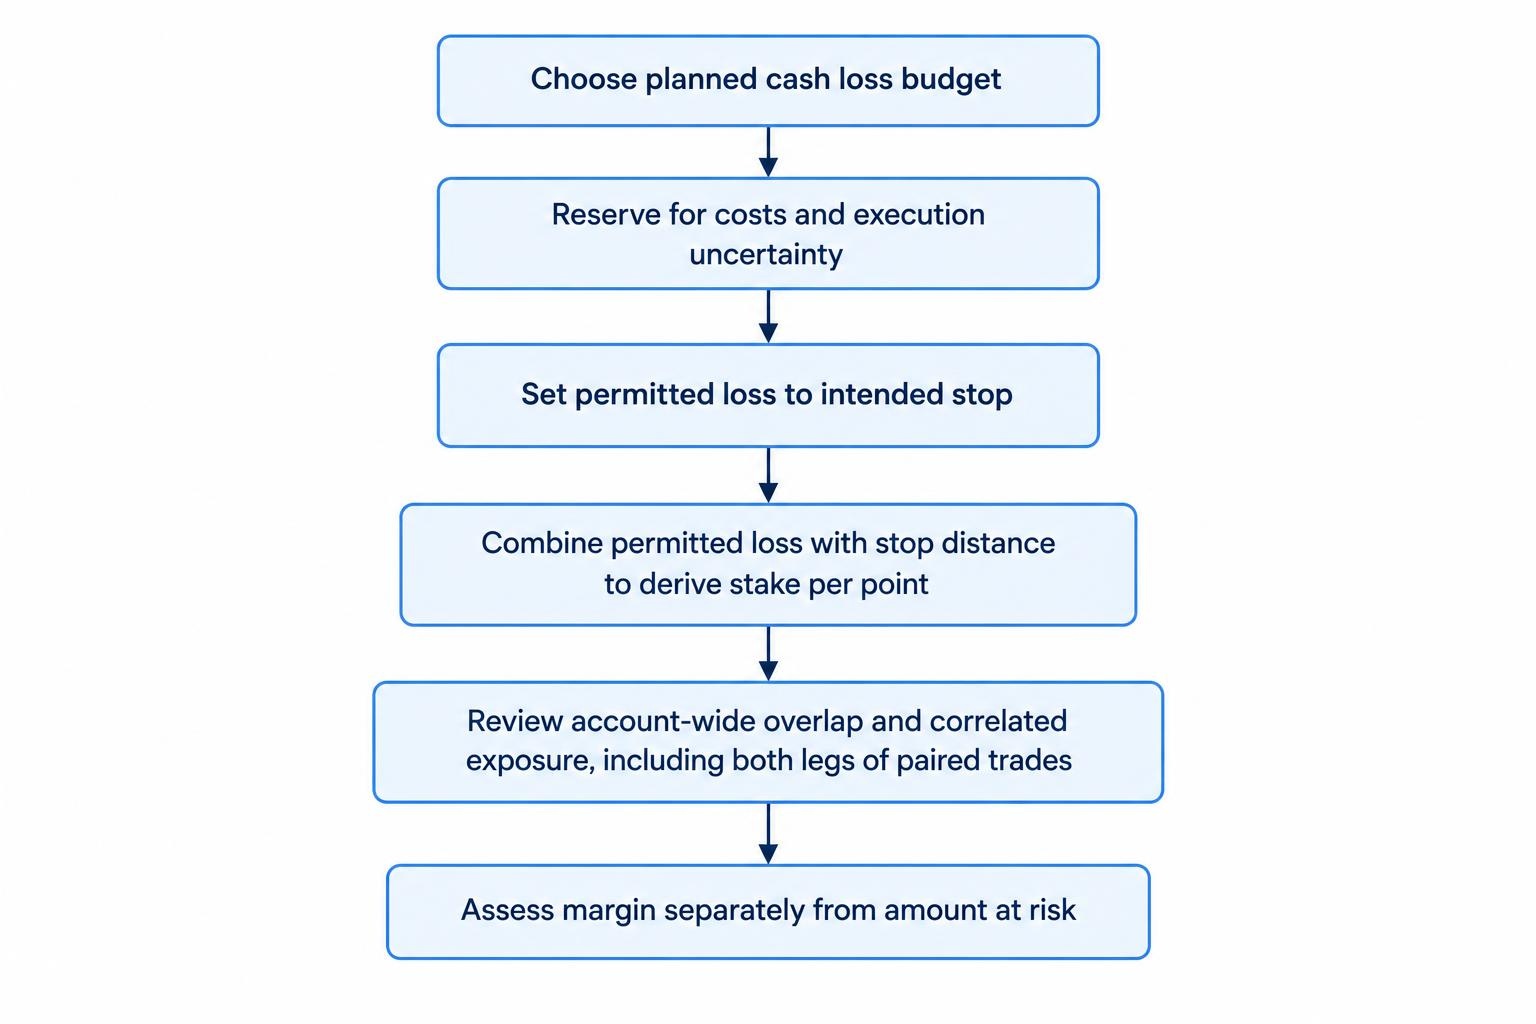
Size the position from the loss you are prepared to accept, not from the largest stake the available margin permits. At £2 per point, a 120 point adverse movement costs £240 before financing, adjustments and any slippage. A market gap could produce a worse exit than a conventional stop order requests.
Suppose your planned cash loss budget is £300 and you reserve £60 for costs and execution uncertainty. That leaves £240 for the distance between entry and the intended stop. With a 120 point distance, the resulting stake is £2 per point. This position sizing approach starts with risk rather than available buying power.
Review exposure across the account as well. A long sector position may overlap heavily with existing share bets or a broad index position. Several markets can carry the same underlying risk under different names. Check portfolio correlation and overlapping exposure before treating each position’s risk allowance as independent.
For a paired trade, include both legs in that review. A long and a short can still leave substantial exposure to interest rates, commodities, currencies or a handful of companies.
Checks Before Placing a Sector Bet
Contract selection deserves as much attention as market analysis. Before submitting an order, work through the following checks:
- Identify the underlying. Record the full index or fund name, constituent universe, weighting method and return type.
- Read the dealing terms. Confirm the betting point, minimum stake, spread, trading hours, margin requirement and contract expiry.
- Calculate cash exposure. Translate the stake into notional exposure, planned stop loss and the effect of a larger adverse move.
- Check the calendar. Review major constituent results, economic announcements and relevant dividend dates within the intended holding period.
- Write the exit conditions. Set the invalidation level, maximum holding period and response to a change in the original thesis.
Do not assume the benchmark’s published calculation hours match the provider’s dealing hours. Check when orders can execute, whether prices are offered outside the underlying session, and what happens to stops while the market is closed.
Use a spread betting demo account, where the relevant market is available, to check point values and order mechanics. A demo can expose a calculation mistake before money is involved, but it does not establish how live execution will behave during a fast market.
When a Sector Bet Fits the Trade
A sector bet fits most clearly when the view concerns a group of related companies and the available contract represents that group reasonably well. It is less suitable when the real thesis concerns one company, one commodity or a holding period whose financing costs undermine the expected return.
Choose the exposure before choosing the stake. Then test the constituents, costs and exit plan against the same question: does this contract express the intended view without adding risks you have overlooked? If the answer is unclear, a recognisable sector name is not enough reason to trade.