A broker’s lowest advertised spread is not the same as the spread a trader usually pays. A useful broker spread study measures prices across comparable products, accounts and trading sessions, then shows how those prices change when conditions become less favourable.
The questions are practical: which provider quotes the narrower spread during your trading hours, how often does that advantage hold, and what happens around market openings or economic announcements? A single screenshot cannot answer them.
This article presents a reproducible study framework, not results from original live broker testing. It does not name a cheapest provider or claim that live accounts have been tested. All numerical provider comparisons below are hypothetical and labelled as such. The purpose is to show what credible spread research should measure, how to calculate the results and where a comparison can go wrong.
What a Broker Spread Study Can Establish
A spread study should establish the width, consistency and availability of a broker’s quoted prices within a defined sample. Its findings should relate to named contracts, account terms, observation dates and trading windows. Without those boundaries, “lowest spreads” is too broad to mean much.
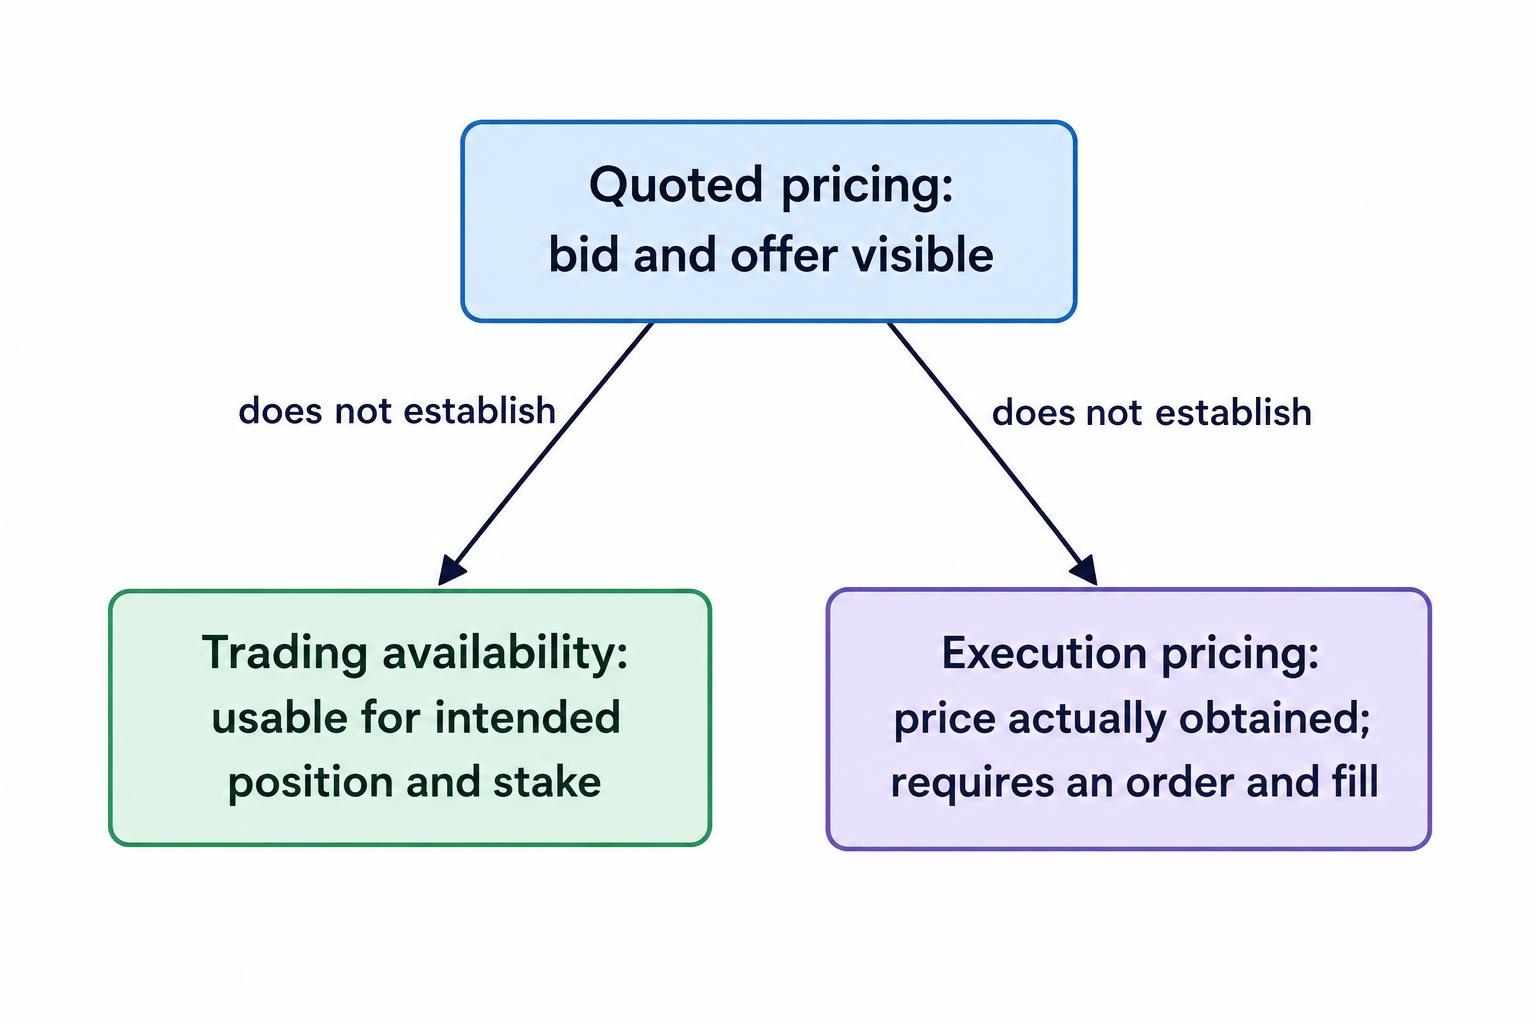
The most useful comparison separates three questions:
- Quoted pricing: what bid and offer were visible at the observation time?
- Trading availability: was that quote available for opening the intended position and stake?
- Execution pricing: if an order was submitted, what price was actually obtained?
These questions overlap, but they are not interchangeable. Recording a narrow quote does not prove that an order could have been filled at it. Recording an accepted trade does not, by itself, establish that the provider offered the narrowest spread elsewhere in the market.
A spread study also cannot establish total value on its own. The FCA’s review published on 13 November 2025 covered providers of CFDs, spread bets and rolling spot forex. It identified gaps where assessments concentrated on spread costs without giving sufficient attention to other charges, including overnight funding. That distinction matters when interpreting any spread ranking: FCA findings on derivatives pricing and fair value.
The appropriate output is therefore a set of conditional findings. “Lower median spread for this cash index during the sampled daytime session” is defensible if the data supports it. “Best broker for everyone” is not a research finding.
Define the Spread Before Comparing It
The quoted spread is the offer price minus the bid price. If an illustrative index contract shows a bid of 8,000.0 and an offer of 8,000.8, its spread is 0.8 index points.
Store the original bid and offer rather than recording only the calculated width. Those prices allow the calculation to be checked later and make it possible to examine the quote’s midpoint. They also help identify misplaced decimal points, reversed fields and contract mapping errors.
The midpoint is the average of the bid and offer. It is a measurement reference, not a promise that a trader can deal there. The underlying mechanics are covered in how spread betting spreads work.
Price precision is not the same as point value
Two platforms may display different numbers of decimal places for economically comparable prices. A study must convert both to the same unit before comparing them.
For a conventional EUR/USD quotation, a move from 1.08500 to 1.08510 is one pip. The last displayed decimal place is smaller than that. A spread of 0.00008 is therefore 0.8 pips, not eight pips. The spread betting contract’s definition of a point must still be checked before converting that width into pounds.
Keep three fields separate: the raw price difference, its standardised market unit and its cash value at the stated stake. This prevents a display convention from becoming an apparent pricing advantage.
Do not count a full spread twice
Buying at the offer and immediately selling at the unchanged bid loses one full spread, before other charges. It does not lose two full spreads simply because there were two transactions.
When analysing each transaction against its contemporaneous midpoint, the cost is normally expressed as a half spread on entry and a half spread on exit. The distinction becomes useful when entry and exit spreads differ.
Match the Broker, Account and Contract
Comparable brand names and market labels are not enough. The observation should identify the legal entity providing the account, the client classification, the account type and the pricing arrangement.
A quote available through one overseas entity should not silently stand in for a UK retail spread betting quote. Nor should a professional account price be presented as available to an ordinary retail applicant. The identity checks belong alongside the broker legal entity research, rather than being inferred from a logo.
Record whether pricing depends on trading volume, account balance, a temporary offer or another eligibility condition. A preferential rate may be worth reporting, but it belongs in a separate comparison unless every account in the sample qualifies on equivalent terms.
Use contracts with the same economic basis
A rolling cash index bet and a dated index bet are not interchangeable observations. Their pricing and charging structures differ. The same caution applies to rolling commodity contracts, dated commodity bets and products tied to different futures months.
For a study focused on daily funded spread bets, keep dated products outside the main table. If both are researched, publish separate groups and identify the expiry or rolling convention for each.
The contract record should also state the currency, point definition, minimum stake and any relevant size restriction. A narrow spread available only at a smaller stake may not answer the question being asked by a trader using a larger position.
Where a provider does not offer the matched contract, record it as unavailable. Do not substitute a different product simply to complete the table. Product availability is a separate finding, covered by broker market coverage research.
Choose a Market Basket Without Creating a Misleading Average
A practical study can include a small basket spanning indices, currencies, commodities and shares. The basket should reflect the intended audience rather than whichever instruments produce the neatest result.
One possible design would examine a UK cash index, a US cash index, EUR/USD, GBP/USD, gold and a small group of actively traded shares. That is a proposed research basket, not a claim that these contracts have been sampled here.
Each instrument needs its own comparison. Averaging raw spread points across gold, an equity index and a currency pair produces a number with no consistent economic meaning. One gold point is not interchangeable with one index point or one currency pip.
If an aggregate score is required, define a common basis first. Possible approaches include spread cost at matched economic exposure or a weighted basket of clearly stated trading scenarios. Each approach answers a different question, so the calculation should remain visible.
Share contracts deserve particular care. Distinguish the market spread from any additional pricing component, and check whether the charging method changes with transaction size. Keep that discussion connected to share spread betting costs rather than treating every displayed width as an identical charging structure.
Do not select only the instruments available at every provider and then imply that the study covers each provider’s full range. A common basket improves comparability, but it narrows the scope of the finding. State both facts.
Sample the Times Traders Actually Use
A meaningful study needs a timetable established before collection begins. Otherwise, it is too easy to favour quiet periods, skip awkward observations or compare providers under different market conditions.
As a workable design, a researcher could observe matched contracts over 20 trading days, taking scheduled snapshots once per minute during defined windows. That is a methodological choice, not an industry standard or a guarantee of statistical reliability.
The observation frequency should suit the question. Minute snapshots may describe broad session pricing, but they can miss short bursts of widening. More frequent data is needed to study brief changes around announcements. Manual observations should not be presented as continuous monitoring.
Use both clock time and market time
Record timestamps in UTC, then label the relevant market session separately. This avoids confusion when local clocks change or two countries move to daylight saving on different dates.
A currency study might distinguish the London session, the London and New York overlap, and a quieter window. The chosen labels and boundaries should be published. The forex trading hours guide provides the session context; the study must still state the exact windows used.
For indices and shares, distinguish the underlying market’s regular session from other quoted hours. Comparing one provider during the main session with another outside it is not a fair price comparison.
Synchronise observations across providers
The same market can move while a researcher switches between platforms. Sequential screenshots taken several seconds apart may therefore capture different conditions.
Where possible, compare observations on a shared sampling clock. Preserve the actual collection timestamp for each provider and set a maximum acceptable timing difference in advance. If observations fall outside that tolerance, exclude them from the paired comparison while retaining them in the audit record.
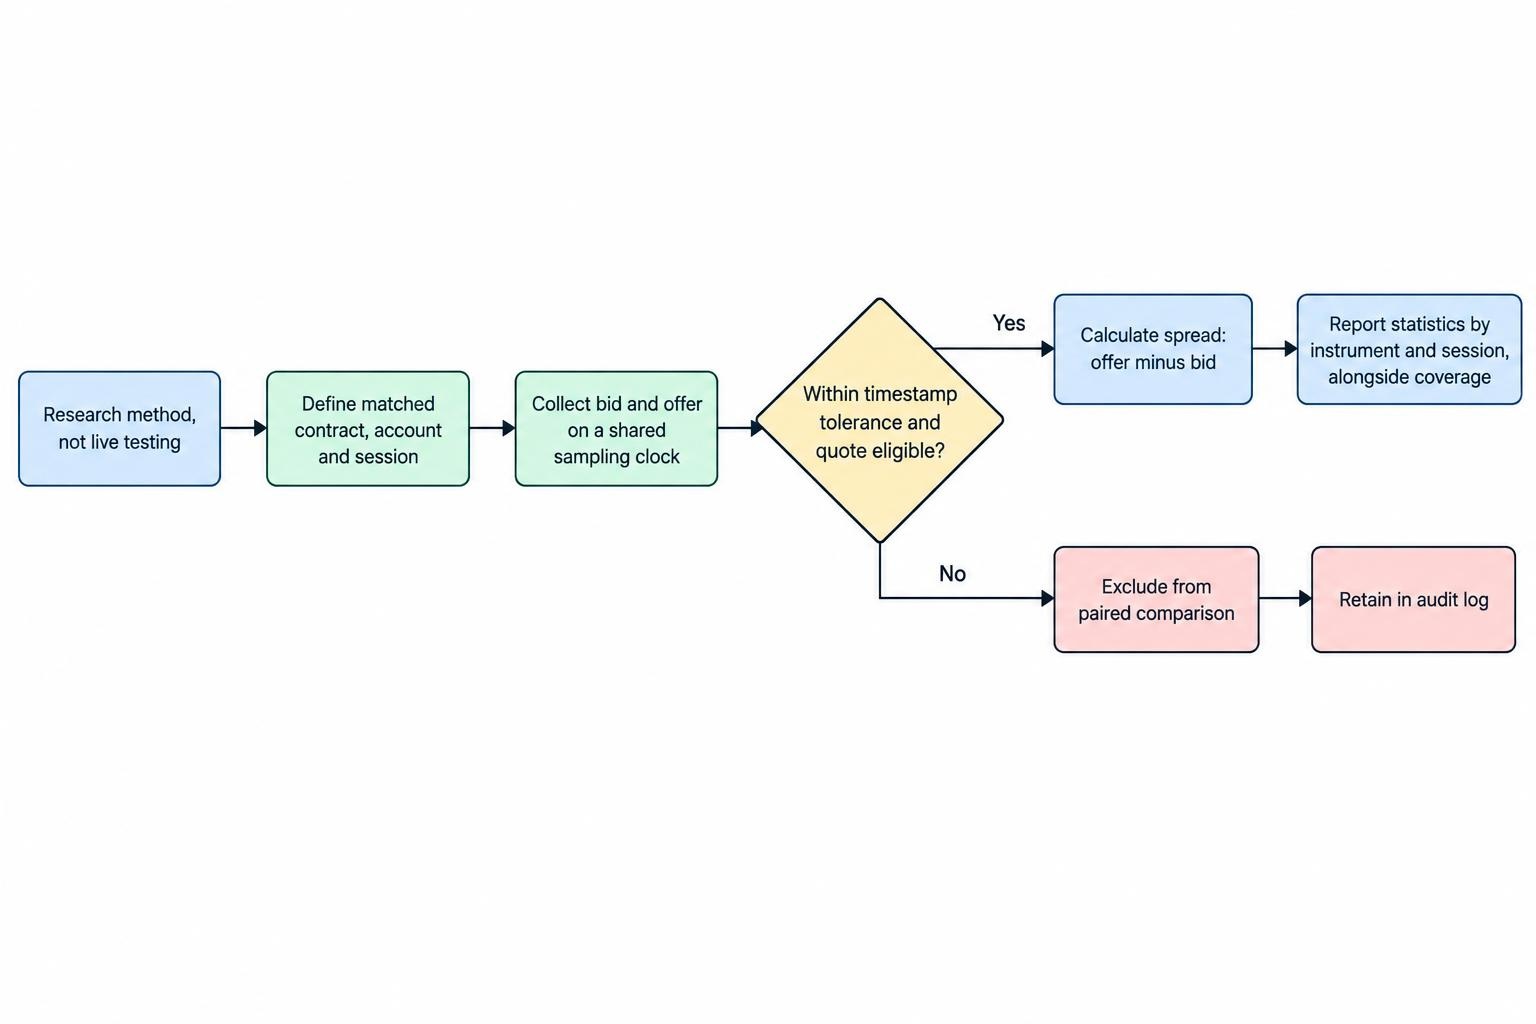
Timing also matters when execution data is added. Transaction cost analysis compares completed trades with a chosen benchmark and depends on accurate timestamps and suitable price data. The practical data requirements are set out in the BIS Markets Committee report on FX execution and transaction cost analysis. Its wholesale FX findings inform the measurement method; they are not retail spread betting broker results.
Capture Enough Information to Audit the Result
The minimum useful observation contains the provider and legal entity, account type, exact contract, timestamp, bid, offer, point definition and quote status. It should also identify the collection method and whether the prices came from a live or demonstration environment.
A chart image is not a substitute for a two-sided dealing quote. Nor is a marketing page listing a minimum spread equivalent to a recorded account price. Keep advertised terms in a separate evidence category.
For screenshots, retain the original files with timestamps. For permitted data feeds or exports, preserve the raw records before cleaning them. Collection should respect the provider’s terms and any relevant market data permissions.
Spread betting demo accounts can help rehearse the collection process and check contract mapping. Results from a demo environment should remain labelled as demo observations, however. They do not establish the prices or execution a funded account would receive.
There is no need to open live positions merely to measure displayed spreads. An execution study is a separate undertaking involving financial risk, additional records and a different set of controls.
Treat Missing Quotes as Information, Not Cheap Pricing
Data cleaning can alter a ranking as much as the original quotes. The rules should therefore be written before the results are inspected.
A missing bid or offer is not a zero spread. A closed market is not a narrow spread. A quote marked as unavailable for opening positions should not be treated as equivalent to an unrestricted dealing price.
Separate at least three situations: the contract is outside its stated trading hours, the provider is not supplying an eligible quote during an expected window, or the collection system has failed. These situations have different causes and should not be merged into one blank cell.
Report paired coverage and individual coverage
A paired comparison uses timestamps at which both providers have valid observations. This improves the fairness of the price comparison, but it can hide an availability problem if the excluded periods are not reported.
Publish the paired spread statistics alongside each provider’s coverage of the full expected sample. A provider should not appear stronger simply because its difficult periods disappeared from the comparison.
Do not carry a last recorded price indefinitely through a data gap. An unchanged quote may be valid, or it may reflect a frozen feed. Use quote age, connection status and other available evidence to distinguish the two. If the distinction cannot be made, mark the observation uncertain.
Retain genuine wide spreads
A very wide spread can be the most useful observation in the dataset. Removing it solely because it looks unusual would defeat the purpose of studying stressed pricing.
Exclude records for documented faults such as a reversed bid and offer, an incorrect instrument or a collection error. Keep an exclusion log. Where a questionable observation could change the result, show the calculation both with and without it instead of quietly choosing the more convenient version.
Report More Than the Lowest Observed Spread
The minimum tells readers what appeared at least once. It says little about how frequently that price was available or what happened during the rest of the sample.
A useful results table should show central pricing, wider-spread periods and data coverage. The following measures answer different questions.
| Measure | What it shows | Main caution |
|---|---|---|
| Minimum observed spread | The narrowest valid recorded quote | May represent only a brief observation |
| Median spread | The middle observation, or 50th percentile | Does not describe the severity of wider periods |
| Mean spread | The average under the stated weighting method | Depends on sampling and can be affected by rare wide quotes |
| 90th and 95th percentiles | Spread levels at or below which the stated share of observations falls | Need enough observations and a stated percentile method |
| Maximum observed spread | The widest valid quote in the sample | Is not a forecast or an upper bound |
| Eligible quote coverage | The proportion of expected observations with a usable quote | Requires a clear definition of expected and usable |
Show these measures by instrument and session before producing any combined score. A provider may have a lower daytime median but a worse upper tail. That is a useful difference, not an inconvenience to be averaged away.
State how the average is weighted
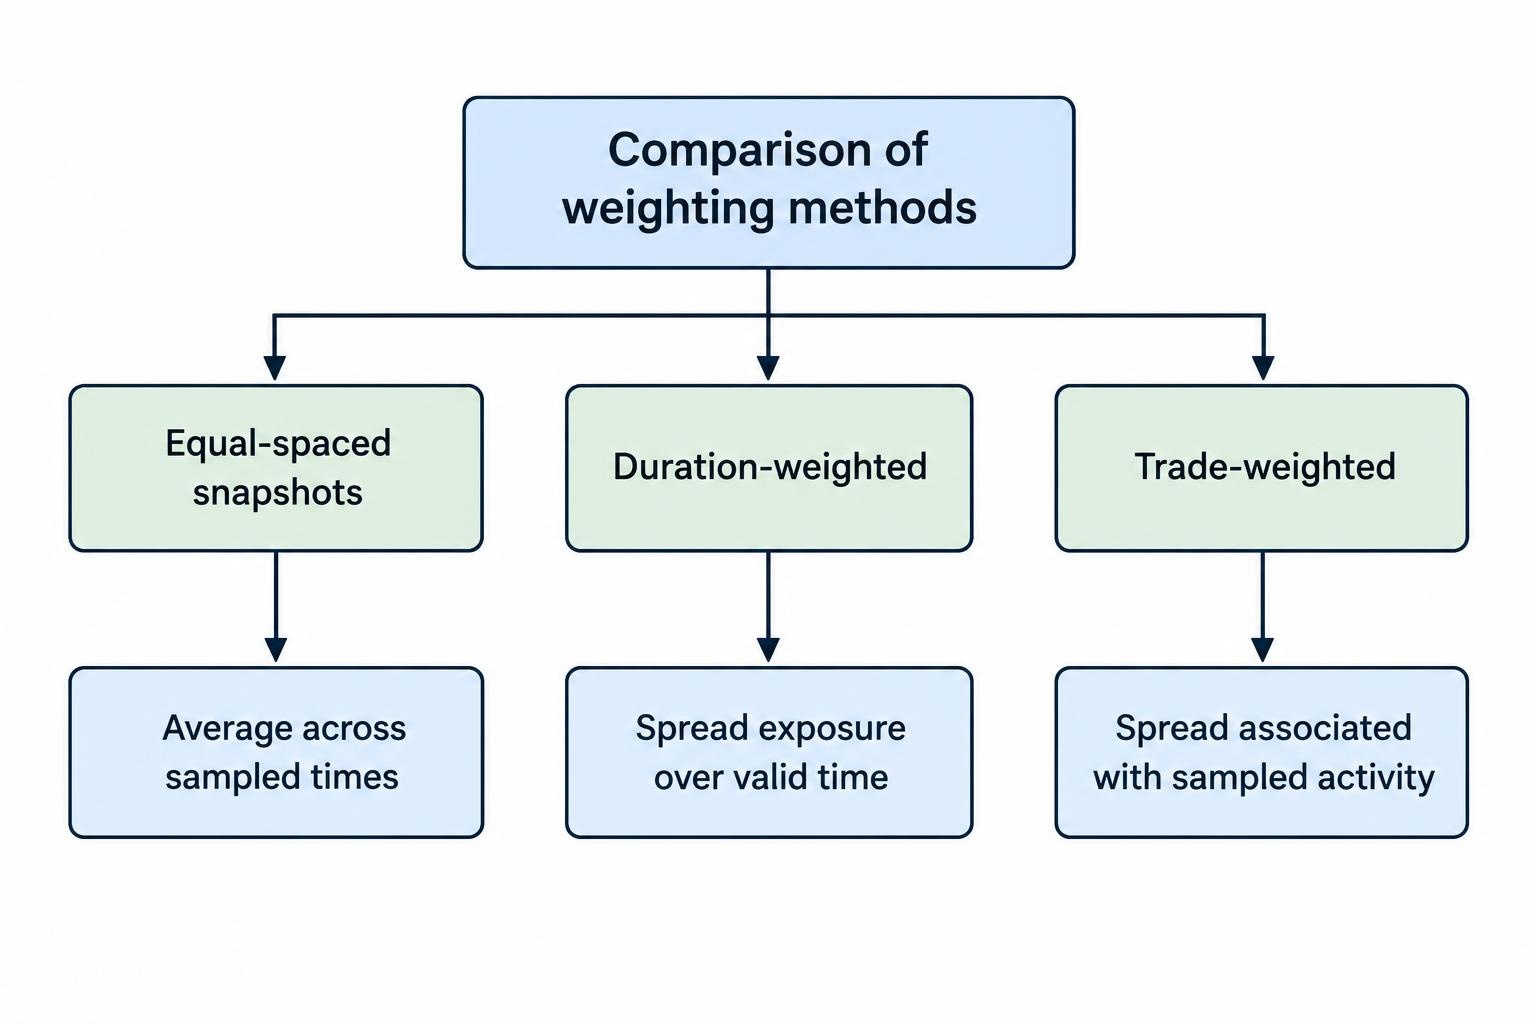
With equally spaced snapshots and comparable coverage, a simple average gives equal weight to each sampled time. With event-driven data, averaging every quote update gives more influence to periods with frequent updates.
A duration-weighted average instead multiplies each valid spread by the time for which it applies, then divides by the total valid duration. This estimates spread exposure over time, subject to the study’s quote validity and gap rules.
Trade-weighted averages answer another question: what spread was associated with the sampled trading activity? They should not be labelled as time averages. The choice is not cosmetic; different weighting schemes can change the ranking.
Worked Comparison: Why the Ranking Can Change
The following example is hypothetical. Providers A and B are invented labels, not anonymised brokers. The figures demonstrate the arithmetic for one matched index contract and do not represent observed market prices.
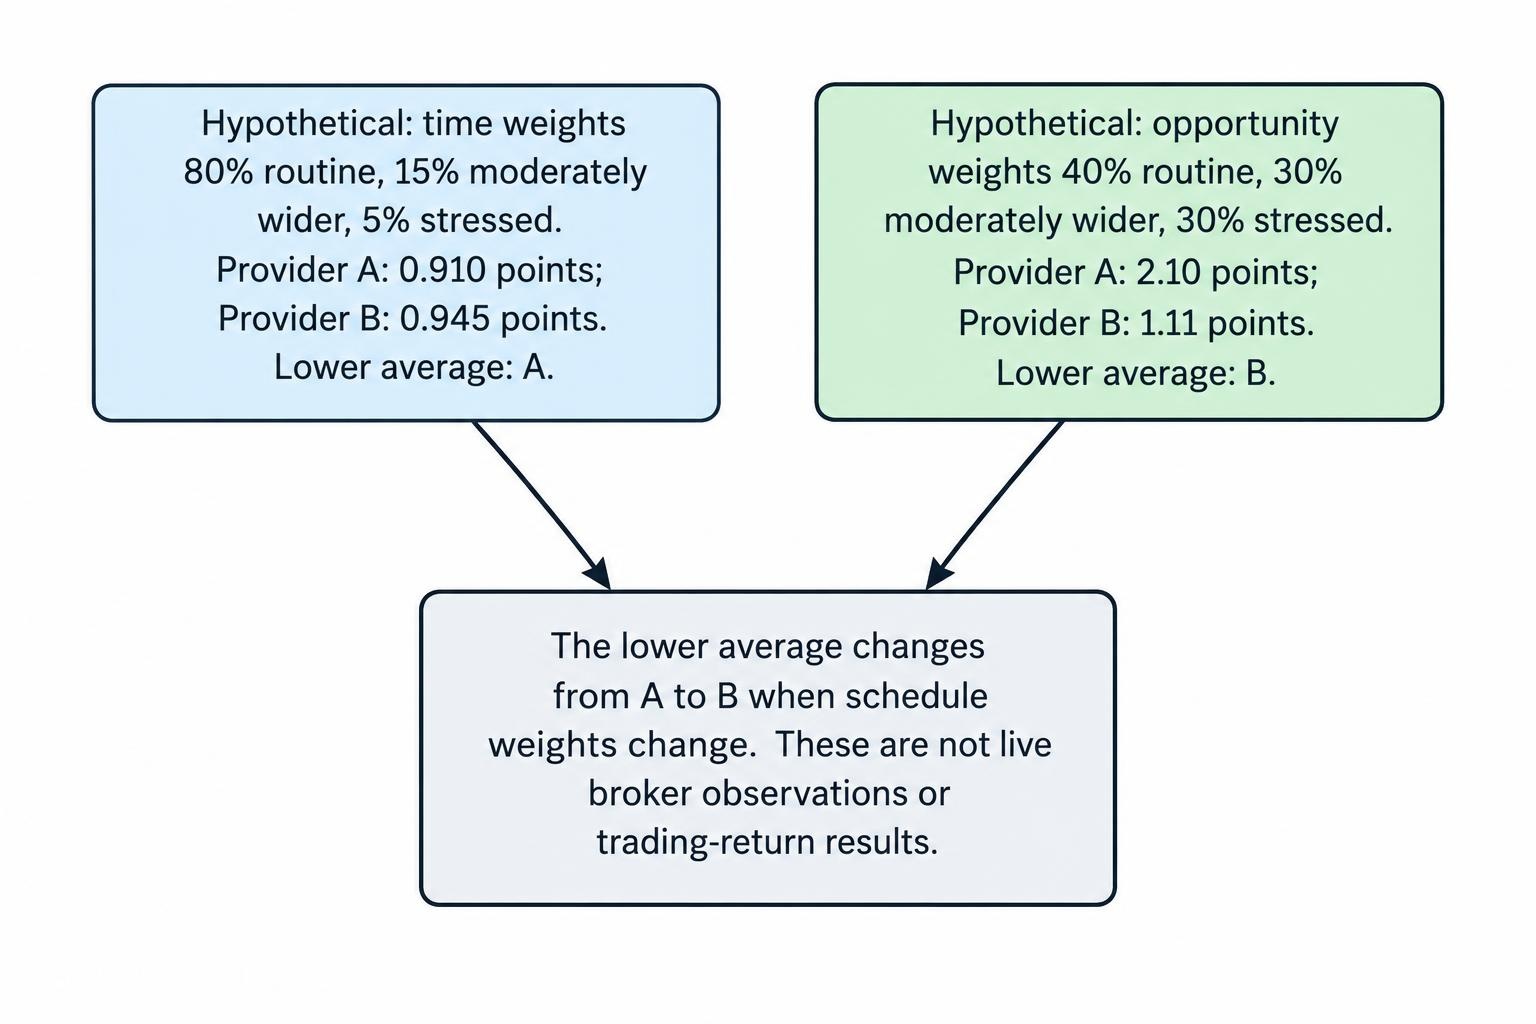
Assume three types of observation occupy 80%, 15% and 5% of the sampled time. Within each group, the example uses a constant spread for simplicity.
| Observation group | Share of sampled time | Provider A | Provider B |
|---|---|---|---|
| Routine conditions | 80% | 0.6 | 0.9 |
| Moderately wider conditions | 15% | 1.2 | 1.0 |
| Stressed conditions | 5% | 5.0 | 1.5 |
| Time-weighted mean | 100% | 0.910 | 0.945 |
Provider A has both the lower minimum and the lower time-weighted mean. Its mean is calculated as 0.6 × 80% + 1.2 × 15% + 5.0 × 5% = 0.910 points.
Provider B’s equivalent calculation is 0.9 × 80% + 1.0 × 15% + 1.5 × 5% = 0.945 points. On that measure, A is cheaper by 0.035 points. Reporting extra decimal places does not make the difference economically large.
A different trading schedule produces a different answer
Now assume a trader’s opportunities are distributed differently: 40% in routine conditions, 30% in moderately wider conditions and 30% in stressed conditions.
Using those opportunity weights, A’s average spread becomes 2.10 points. B’s becomes 1.11 points. B now has the lower spread exposure for that schedule, despite its higher routine spread.
This does not prove that B would produce better trading returns. The calculation contains no fills, market movement, financing or strategy performance. It shows only that a time-average ranking can be a poor fit for activity concentrated in wider-spread periods.
The same issue applies to short-duration spread betting strategies. A trader who deals repeatedly within one narrow window needs evidence from that window, not a full-day average dominated by hours they never use.
A published study should retain the broad time-based result and show the alternative weighting separately. Replacing one with the other after seeing which provider wins would turn a useful comparison into a moving target.
Examine Market Openings and Stress Windows Separately
A broad session average can conceal short periods that matter to order placement. Market openings, scheduled announcements, session transitions and unexpected disruption should therefore have their own labels where the sample covers them.
Define scheduled event windows before inspecting the spreads. One possible design might compare the period before an announcement, the immediate release window and the period afterwards. The exact boundaries should reflect the data frequency and research question.
Do not merge all announcements into one result without identifying their type and number. A sample of one event cannot establish normal behaviour across all news releases.
The importance of examining quiet-period stress is not theoretical. Bank of England research on the sterling flash episode of 7 October 2016 examined trading costs and price impact during a normally quiet part of the day: Bank of England study of liquidity during the sterling flash episode. It does not provide a retail broker ranking, but it illustrates why ordinary-session observations cannot describe every trading condition.
For each stress window, report spread width, eligible quote coverage and the duration of widening where the data supports it. Treat recovery time as a separately defined measure: the threshold and required duration below that threshold must be stated.
A wider spread and a market gap are different risks. Research should not describe one as proof of the other, even when they occur in the same period.
Keep Quoted Spreads Separate From Actual Execution
A quote study can be completed without placing trades. Claims about realised execution require order and fill records, including direction, size, order type, submission time, receipt time where available, execution time and fill price.
For a buy order, adverse slippage against a chosen offer is the fill price minus that offer. For a sell order, it is the chosen bid minus the fill price. Positive values indicate a worse outcome under that convention; negative values indicate price improvement.
The benchmark timestamp must be fixed in advance. Comparing with the quote visible before submission answers a different question from comparing with the quote when the provider receives the order. If only the first timestamp is observable, say so. The slippage guide covers the distinction between the requested price and the executed price.
Effective spread uses a midpoint benchmark
An effective-spread calculation puts a transaction’s distance from a midpoint onto a full-spread basis. With a stated reference midpoint, the directional formulas are:
Buy effective spread = 2 × (fill price − reference midpoint).
Sell effective spread = 2 × (reference midpoint − fill price).
The SEC’s US equity execution reporting guidance provides examples of this midpoint-based calculation and weighting partial fills by executed size: SEC guidance on effective spread calculations. This is a measurement reference, not a claim that US equity reporting rules govern UK spread betting.
For a spread betting study, identify whether the midpoint comes from the provider’s own quote or an external reference. The former measures execution relative to that provider’s displayed pricing; it does not independently establish price fairness.
Do not add the quoted spread to an effective-spread measure that already captures the transaction’s distance from the midpoint. That would double count part of the cost. Keep rejected orders, partial fills and unfilled orders in separate statistics rather than assigning them imaginary execution prices.
A full analysis of these outcomes belongs in broker execution quality research. A spread table should not imply that it has answered those questions unless the relevant records exist.
Use External Reference Prices With Care
An external feed can help investigate quote movement and pricing differences, but it must match the contract’s economic basis. A cash index reference and a futures contract are not interchangeable simply because both refer to the same index.
Check the underlying instrument, expiry where relevant, currency, timestamp, feed delay and any pricing adjustment before treating a difference as a provider markup. Preserve the reference feed’s bid and offer where available, rather than relying only on a chart’s last traded price.
FX comparisons need particular caution. The BIS’s research on FX market structure documents trading across multiple venues and proprietary liquidity pools, with reduced visibility of activity to the broader market: BIS research on fragmented FX trade execution. One external quote is therefore evidence from a reference venue, not automatically a universal executable price.
A price mismatch can justify further investigation. It does not, on its own, prove manipulation, an unfair markup or a missed execution obligation.
The FCA’s best execution provisions require firms dealing in OTC products to check proposed price fairness using relevant market data and, where possible, comparable products. They also address price and execution-related costs for retail orders: FCA best execution and OTC price fairness provisions. A research comparison can inform scrutiny, but it is not a regulatory compliance determination.
Translate Spread Differences Into Pounds
Point differences become more useful when converted into cash at a stated stake. For an unchanged quote, the spread cost of an immediate opening and closing transaction is:
Spread cost = full spread in points × stake per point.
A 0.8-point spread at £5 per point represents £4. This assumes execution at the displayed prices and excludes other charges. The contract’s point definition must be correct, which is why stake per point belongs in the study record.
Allow for different entry and exit spreads
When the spread changes, the midpoint-based spread component of a completed trade is:
Spread component = (entry spread ÷ 2 + exit spread ÷ 2) × stake per point.
Suppose the entry spread is 0.8 points and the exit spread is 1.6 points. At £5 per point, the spread component is (0.4 + 0.8) × £5 = £6, assuming fills at the quoted bid or offer.
This separates spread cost from the movement between entry and exit midpoints. It is not a replacement for calculating actual trade profit or loss from the executed prices.
For varying stakes, calculate each transaction’s cash component separately before adding the results. Multiplying a simple average spread by an unrelated average stake can produce a misleading total when larger positions occur during wider-spread periods.
Do not confuse a lower cash cost with better pricing if it comes from a smaller position. Provider comparisons should hold the relevant exposure constant. The separate position sizing guide addresses how that exposure relates to risk.
State What the Spread Comparison Excludes
A clean spread study isolates spread pricing. It should not quietly mix financing, stop premiums or unrelated account charges into the spread column.
That separation improves measurement, but it also creates a boundary readers need to see. Narrower spreads do not necessarily mean a lower bill over the intended holding period.
The broader spread betting cost study is the appropriate place to combine charging categories under matched trading scenarios. A spread comparison should provide a clearly defined input to that work, rather than duplicate it.
Overnight funding needs its own assumptions about holding duration, direction and the provider’s applicable terms. It should remain outside the spread ranking and be assessed through overnight financing research.
Other exclusions may include guaranteed stop premiums, currency conversion, data subscriptions and account fees. List only categories relevant to the accounts and products being studied. Do not imply that every provider charges every fee.
Where a promotion changes the effective cost, show the ordinary pricing and promotional scenario separately. Temporary eligibility should not be hidden inside a general claim about standard spreads.
Account for Uncertainty Before Publishing a Winner
A large number of observations can create false confidence. Thousands of snapshots from one quiet day do not provide the same breadth of evidence as observations across several market conditions.
Adjacent quotes are also related. Repeatedly sampling an unchanged spread adds records, but not a fresh market episode each time. The report should show the number of trading days, sessions and events alongside the observation count.
For paired comparisons, calculate the spread difference at each matched timestamp. Then examine whether the advantage persists across days and sessions. A small pooled advantage driven by one unusual day should be described differently from a consistent advantage throughout the sample.
If confidence intervals or resampling methods are used, explain how the method handles observations grouped within days. Do not treat every snapshot as independent without justification. The statistical method should fit the collection process, not just the spreadsheet’s default settings.
Economic relevance matters too. A tiny average difference may be smaller than the study can reliably distinguish, or too small to affect the reader’s intended trading costs. A tied or inconclusive result is acceptable. Research does not owe anyone a trophy.
Keep the publication auditable
A published result should identify the observation dates, collection method, contracts, account terms, sample windows, weighting rules, exclusions and coverage. Any change in methodology between editions should be visible.
Preserve earlier periods rather than replacing them without explanation. A historical result remains a result for its historical sample; it should not be presented indefinitely as current pricing.
If commercial relationships exist, disclose them separately from the calculation. Providers may be invited to identify factual errors, but a response should not erase valid unfavourable observations. Corrections need a documented reason and a traceable change.
How to Use a Broker Spread Study
Start with the instrument and session you actually intend to trade. Check that the account, contract type and stake conditions match your circumstances. Then compare the median, mean, wider-spread measures and quote coverage together.
A provider with the lowest minimum may still be a poor fit for a trader active around announcements. Another may look expensive across a full day but quote competitively during the only hour that matters to that reader.
A shortlist of spread betting brokers with lower spreads should therefore be tested against the conditions behind the figures, not accepted on the strength of a headline number.
Before choosing an account, extend the analysis to total spread betting costs and the execution evidence available. Do not increase stake size or trading frequency simply because one charging component is lower.
The strongest spread research does not promise a permanent winner. It provides enough detail to show where a pricing advantage appeared, how it was measured and when it may not apply. Used alongside the wider spread betting research, that is far more useful than a minimum-spread league table with the difficult hours missing.