Financial spread betting strategies are repeatable, rules-based frameworks for deciding what to trade, when to enter, how much to stake and when to exit. The core market approaches include trend following, breakout trading, range trading, mean reversion, momentum and news trading. These can be executed across intraday, swing or multi-week holding periods using technical indicators, macroeconomic fundamentals or a hybrid methodology. A timeframe is merely an execution window, and an indicator is only a measurement tool; a robust strategy requires an operational bridge connecting market setup, precise entry criteria and enforceable risk-management rules.
There is no universally “best” spread betting strategy without defining the underlying market, financing friction, volatility profile and available capital. A fast scalping method demands continuous execution discipline, whereas multi-week position trades can be eroded by cumulative overnight funding charges. The Financial Conduct Authority (FCA) regulates spread betting under its retail CFD regime, classifying these leveraged derivatives as complex, high-risk instruments. A structured strategy enforces mathematical consistency—it does not eliminate the risk of capital loss.
Core Spread Betting Strategies at a Glance
-
1
Trend Following: Ride sustained directional legs using moving average filters and pullback entries; cut losses when structure breaks.
-
2
Breakout Trading: Enter volatility expansions as key support, resistance, or consolidation ranges breach; manage risk tightly inside the range.
-
3
Mean Reversion: Fade overextended price moves back toward dynamic moving averages or Bollinger Band midpoints during range-bound conditions.
-
4
Swing Trading: Hold directional multi-day positions to capture higher-timeframe moves while minimizing the impact of bid-ask spreads.
-
5
Portfolio Hedging: Use short index or sector bets to offset temporary market drawdowns in a long share portfolio without triggering taxable events.
What Makes a Complete Spread Betting Strategy?
A complete trading strategy defines five mandatory components: the exact instrument and contract type, setup conditions, execution trigger, stake sizing, and explicit invalidation levels. It also dictates when to stay flat. Vague guidelines like “buy when moving averages cross” fail because they leave critical variables unresolved: timeframe, candle close confirmation, economic calendar filters and stop-loss placement. Without deterministic rules, execution defaults to emotional impulse.
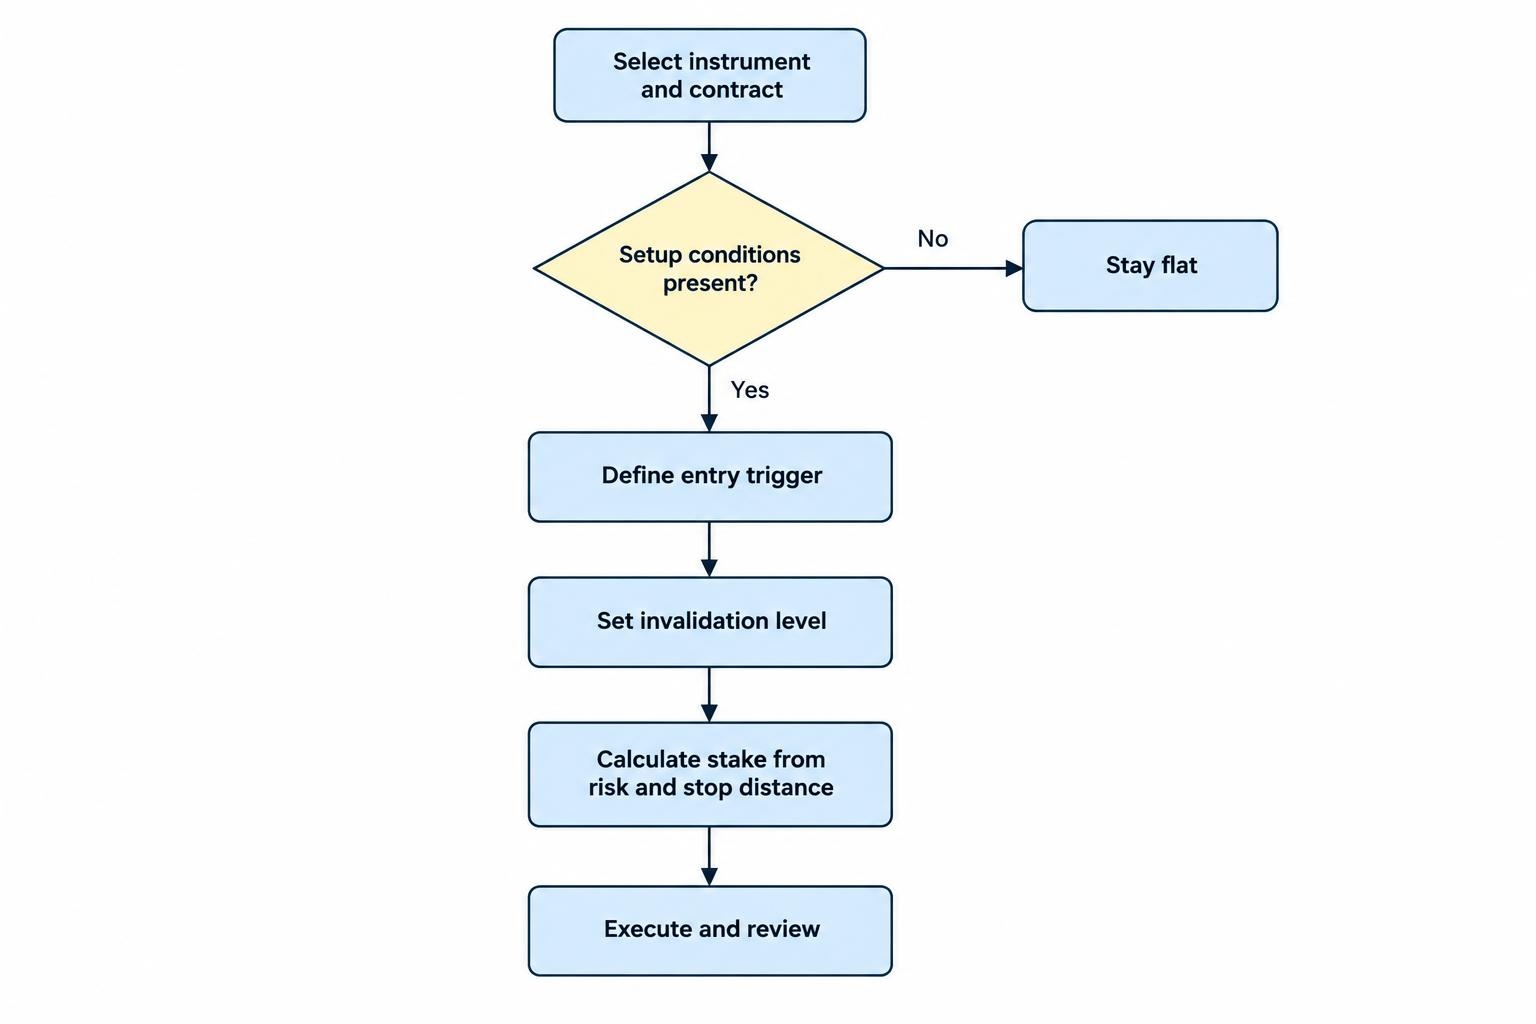
Spread betting introduces contract-specific variables that do not exist in cash equity or spot forex trading. Choosing between a daily funded bet (DFB) and a dated forward contract materially alters carrying costs over time. Furthermore, platform-specific factors—such as minimum stake limits, proprietary spread markups and bid/ask stop triggers—directly impact strategy viability. Testing must always be calibrated to real-world dealing specifications rather than idealized mid-market price charts.
Comparing the Main Spread Betting Strategies
| Trading Approach | What It Describes | Intended Market Opportunity | Primary Operational Difficulty |
|---|---|---|---|
| Scalping | Holding period (seconds to minutes) | Exploiting micro-imbalances and small intraday price ticks | High sensitivity to bid-ask spread friction and order-execution latency |
| Day Trading | Holding period (intraday; closed by session end) | Capturing intraday momentum without overnight holding exposure | Screen-time intensity and elevated intraday market noise |
| Swing Trading | Holding period (several days to weeks) | Capturing directional multi-day price swings and trend legs | Overnight financing drag (DFBs) and exposure to weekend gap risk |
| Position Trading | Holding period (months to quarters) | Riding large macroeconomic trends and multi-month cycles | Cumulative carrying costs, futures roll yield, and substantial margin needs |
| Trend Following | Market behaviour | Participating in sustained directional continuation | False breakouts and capital drawdown during range-bound chop |
| Breakout Trading | Market behaviour | Entering explosive volatility expansion as key levels breach | Frequent fakeouts and execution slippage during high-velocity moves |
| Mean Reversion | Market behaviour | Fading temporary price extremes back toward an equilibrium average | Runaway trend extensions triggering severe out-of-margin losses |
| Technical Analysis | Analytical framework | Identifying repeatable price patterns, volume trends, and support levels | Subjectivity in interpretation and lagging indicator signals |
| Fundamental Analysis | Analytical framework | Exploiting valuation mispricings, policy shifts, and earnings surprises | Uncertainty in market timing; prices can remain irrational longer than margin lasts |
| Hedging | Risk-management intent | Offsetting adverse price moves in an existing portfolio | Basis risk, dual financing friction, and potential to lock in dead capital |
*Trading styles and execution mechanics are modular components of a broader risk plan; they are not mutually exclusive and must be calibrated to individual market liquidity and holding costs.
Choose a Holding Period You Can Support
Day Trading
Day trading eliminates overnight carrying risk by opening and closing all positions within the same cash market session. Closing before the broker’s daily rollover (typically 22:00 UK time) ensures the account avoids overnight financing debits entirely. However, intraday trading requires sustained screen focus to navigate fast micro-structure volatility. Traders with limited daily availability should avoid intraday styles rather than trying to manage open day trades without adequate monitoring.
Swing Trading
Swing trading aims to capture directional swings lasting from several days to a few weeks, typically entering on trend pullbacks or chart pattern breakouts. This horizon allows for deliberate analysis outside core working hours, and transaction costs represent a smaller percentage of the wider target price movement. However, holding positions overnight exposes the account to overnight funding drag and weekend price gaps across unscheduled news releases.
Scalping
Scalping targets micro-movements lasting seconds or minutes. While high trade frequency can seem appealing, the mathematical hurdles are severe: a two-point spread on a five-point target consumes 40% of gross profit before factoring in execution slippage. Scalpers must utilize ultra-liquid major pairs or headline equity indices during peak market hours, where spreads are tightest and order-book depth minimizes latency costs.
Position Trading
Position trading captures macroeconomic themes spanning several months or quarters. While this provides insulation from daily price noise, traders must manage the cumulative cost of leverage. Holding daily funded bets (DFBs) long term causes financing fees to compound rapidly; traders should evaluate dated forward contracts to lock in predictable carrying costs and avoid rolling friction.
Overnight Trading
Overnight trading occurs when positions are held through regional session rollovers or when speculating during off-exchange hours. Off-peak trading sessions generally feature wider dealing spreads, reduced market depth and larger gap risk. Carrying overnight exposure should always be an intentional part of a swing or position strategy—never the accidental result of failing to close an intraday trade before the session closes.
Trend Trading and Momentum Trading
Trend trading aims to capture sustained market direction by following a sequence of higher highs and higher lows (uptrend) or lower highs and lower lows (downtrend). Entries are commonly staged around pullbacks to key dynamic moving averages or broken support/resistance zones. The primary operational trade-off is accepting delayed entries: confirming directional persistence means forfeiting the first leg of the move and enduring drawdowns during choppy consolidation phases.
Momentum trading targets the velocity and acceleration of price movements, often measuring relative strength against benchmark indices. Momentum setups seek to enter as volatility expands following range squeezes. The major risk is chasing overextended price action, which leaves stop-loss placements wide and exposes the position to sharp mean-reverting pullbacks. A disciplined momentum plan must define strict maximum chase distances.
Breakout Trading
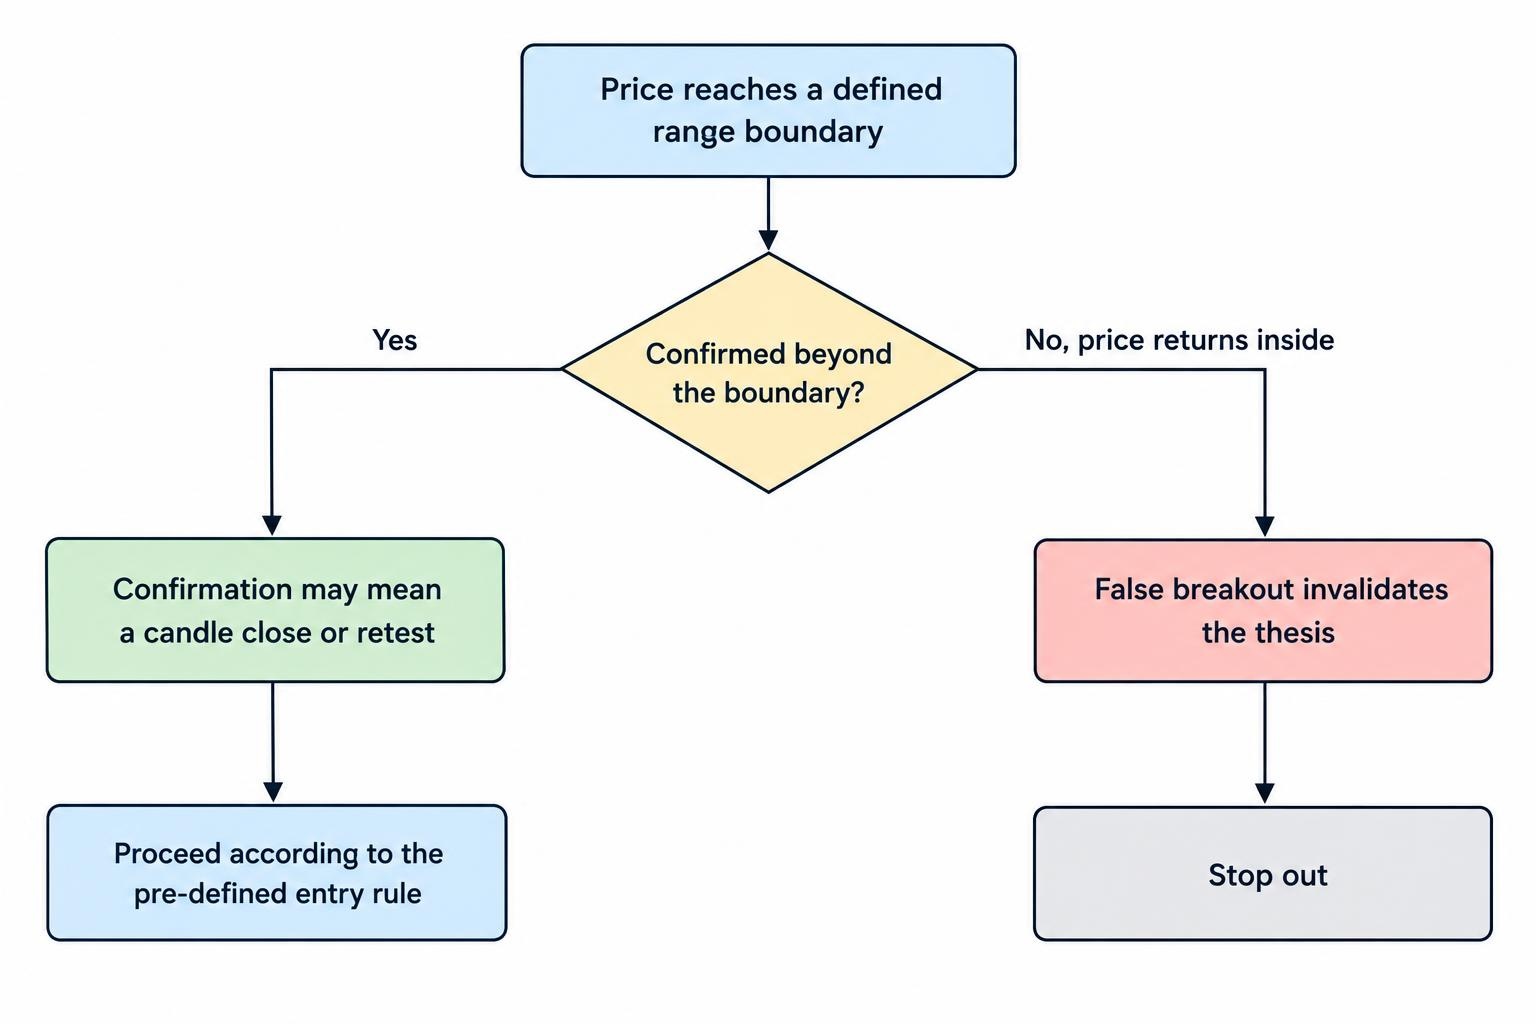
Breakout trading involves entering as the price breaches a defined structural boundary, such as a multi-week consolidation range, prior session extremes or a technical chart pattern. The premise relies on order-flow imbalances accelerating price velocity as trapped counter-trend traders are forced to exit. Traders must specify whether entries occur on initial boundary penetration or wait for a confirmed candle close or subsequent retest.
False breakouts (“bull traps” and “bear traps”) are a structural hazard in this approach, particularly during thin liquidity or leading into high-impact news releases. If a market spikes outside a key level and immediately falls back inside the range, the breakout thesis is invalidated. The stop loss should be placed strictly inside the consolidation structure to cut losses quickly rather than hoping for a secondary rebound.
Range Trading and Mean Reversion
Range trading operates on the premise that prices oscillate within horizontal support and resistance boundaries during non-trending markets. Traders look to buy at verified support and sell at established resistance, provided the range width offers an acceptable risk-to-reward ratio after clearing the broker’s spread. Stops are positioned just outside the boundary limits to cut exposure if the range breaks.
Mean reversion broadens this concept by fading price extensions away from statistical equilibrium benchmarks, such as long-term exponential moving averages, Volume-Weighted Average Price (VWAP) or Bollinger Band extremes. The critical operational danger is that a market can remain overbought or oversold far longer than account margin can withstand. Mean-reversion systems require definitive stop-loss parameters to prevent a ranging trade from turning into a catastrophic loss during runaway trend extensions.
News Trading
News trading seeks to capitalize on rapid market repricing following major macroeconomic releases (such as US Non-Farm Payrolls, CPI inflation reports or central bank rate decisions) and corporate earnings announcements. Price direction is determined by the variance between the actual published data and consensus forecasts, rather than whether the headline print is objectively positive or negative.
Entering positions immediately before or after high-impact announcements carries extreme execution risk: dealing spreads widen dramatically, liquidity dries up, and market orders suffer slippage. Straddle strategies utilizing pending buy and sell stop orders frequently get whipped into both sides during the initial price spike. Many professional spread bettors deliberately pause active trading during major data releases, waiting for initial volatility to settle before trading the resulting trend.
Hedging and Pairs Trading
Hedging utilizes a derivative position to offset market downside in an existing physical portfolio. For example, an investor holding UK blue-chip equities might open a short FTSE 100 spread bet to protect against short-term market corrections without selling underlying shares and triggering tax events. The hedge must be sized accurately to the portfolio’s beta: a hedge is designed for capital preservation, not standalone speculative profit.
Pairs trading involves taking simultaneous, opposing positions in two historically correlated instruments—such as buying BP while shorting Shell, or going long the Nasdaq while shorting the Dow. This market-neutral approach seeks to profit from the statistical convergence of an abnormal price divergence. However, traders must account for beta differences rather than using equal stakes per point, and be aware that macroeconomic shifts can permanently break historical correlations.
Both hedging and pairs trading run into dual financing and spread costs across two open tickets. The FCA’s CFD price and value review specifically highlighted the compounding cost drag of maintaining opposing positions. Ensure your broker does not maintain separate margin and overnight financing charges on opposing legs where internal netting should apply.
Technical Analysis: Tools for Defining Decisions
Technical analysis applies mathematical and behavioral tools to past price and volume action to construct objective trade rules. Used properly, indicators do not “predict” market direction; they define actionable entry triggers, stop-loss levels and objective invalidation zones. Stacking numerous indicators that calculate the same underlying price data creates analytical clutter without adding genuine confirmation.
| Technical Tool | Possible Role in a Strategy | Main Operational Limitation |
|---|---|---|
| Support and Resistance | Define structural entry zones, stop invalidation levels and price targets | Key levels can fail abruptly or be drawn inconsistently across timeframes |
| Moving Averages (SMA / EMA) | Identify directional trend bias and smooth out high-frequency noise | Inherent calculation lag produces late entries and severe whipsaws in ranging markets |
| Relative Strength Index (RSI) | Measure recent momentum velocity and compare average gains against losses | Overbought or oversold readings can persist indefinitely during strong directional runs |
| MACD | Assess shifts in short-term vs long-term moving-average relationships and convergence | Frequently redundant when paired with other trend-following or moving-average indicators |
| Bollinger Bands | Gauge dynamic volatility expansion and compare price against a statistical dispersion band | A touch or breach of an outer band indicates momentum, not an automatic mean-reversion signal |
| Average True Range (ATR) | Quantify periodic price volatility to calibrate stop-loss distances and stake sizing | Measures absolute price dispersion and volatility magnitude, providing no directional insight |
| Candlestick Patterns | Identify localized price action shifts, buyer/seller balance, and session rejection | Signals lack statistical significance without broader trend context and strict confirmation rules |
*Technical indicators are descriptive analytical tools rather than standalone predictive systems. Effective risk management requires pairing indicators with defined position sizing and invalidation levels.
Each technical indicator on your screen must perform a distinct task: for example, using a 200-period EMA for higher-timeframe trend filter, ATR for stop-loss distance calibration, and support/resistance levels for setup location. Adding extra momentum oscillators like RSI, Stochastics and MACD simultaneously provides no new information—it merely displays the same momentum calculation in three different formats.
Fundamental Analysis: Connecting Price With an Economic View
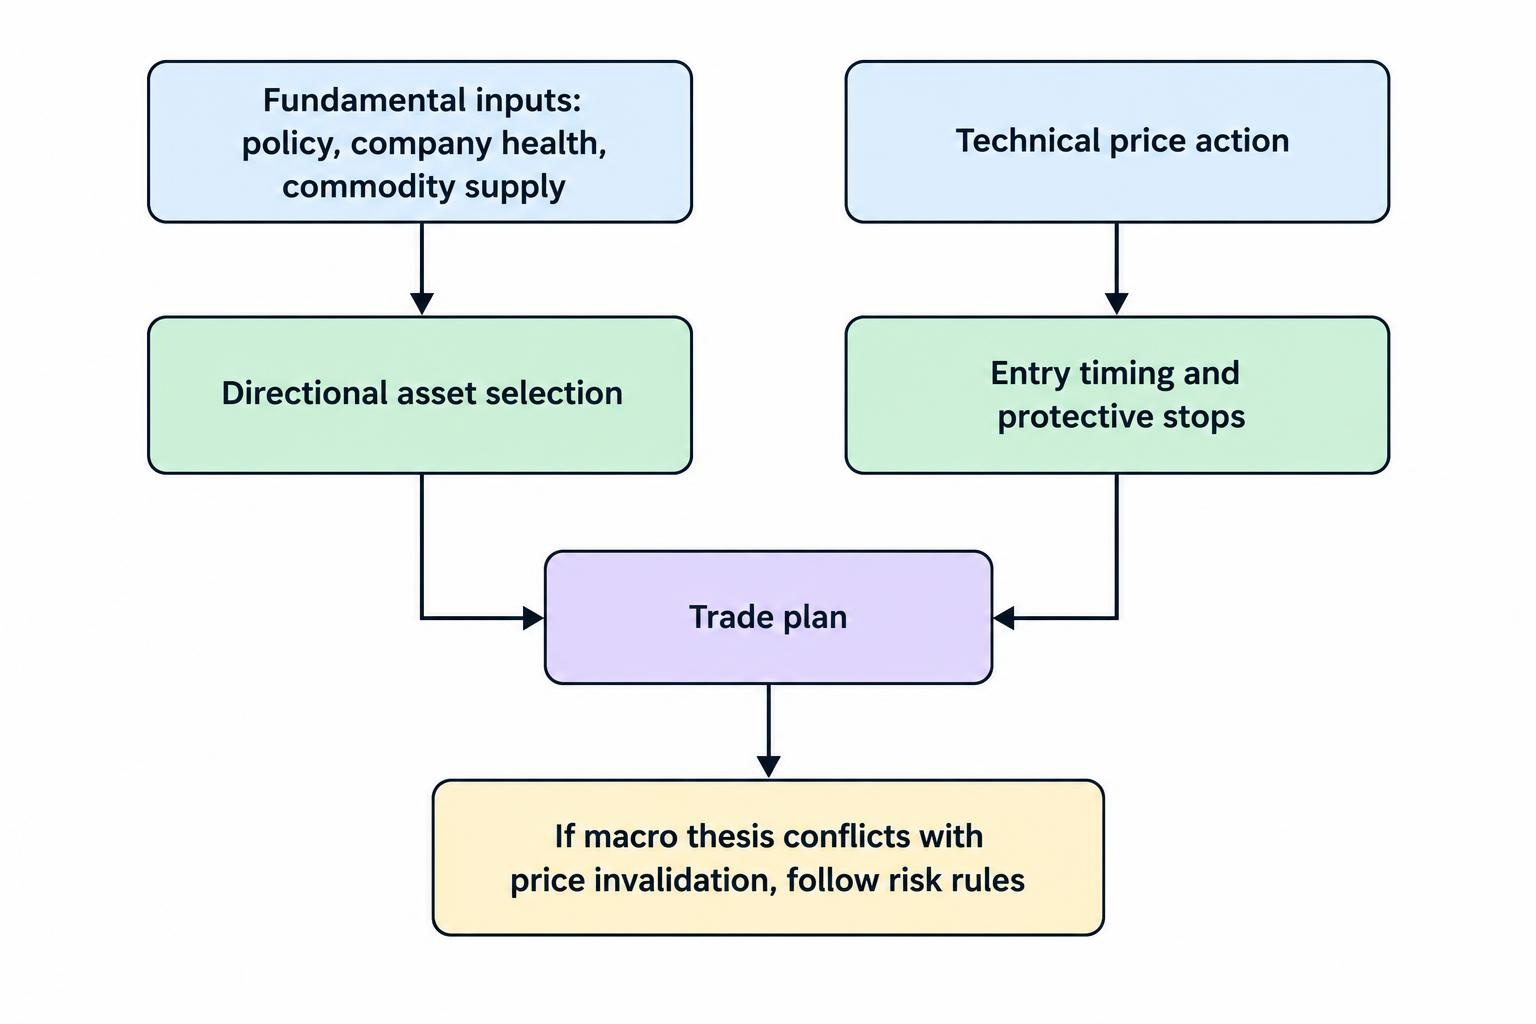
Fundamental analysis examines the macroeconomic conditions and corporate health that drive asset valuations. In forex, this focuses on central bank policy expectations, interest rate differentials and trade balance data. In single equities, it centers on earnings growth, profit margins, debt ratios and free cash flow. In commodities, it tracks physical supply bottlenecks, OPEC+ production quotas and inventory storage levels.
A practical hybrid approach combines fundamental analysis for directional asset selection with technical analysis for precise execution timing. Macro fundamentals establish what to buy or sell, while price action mechanics dictate where to enter and place protective stops. When macro thesis and price invalidation conflict, risk rules must take priority over economic forecasts.
Costs Can Decide Whether a Strategy Is Viable
A spread betting strategy’s long-term viability depends on its net expectancy after total trading costs. For active intraday methods, the dealing spread and slippage represent the primary friction. For multi-week swing strategies, overnight funding rates (SOFR/SONIA plus broker markup) and dividend debits often exceed the initial spread cost. Never evaluate strategy viability using raw mid-market price data.
When running performance audits, avoid double-counting spread costs: if trades are backtested using real bid and ask prices, spread friction is already embedded in the P&L. For long-term holding strategies, calculate whether dated forward contracts (futures) provide a more cost-effective carrying structure than daily funded bets (DFBs), as forward contracts embed carrying costs upfront rather than deducting compound daily financing fees.
Position Sizing, Stops and Margin Must Fit the Strategy
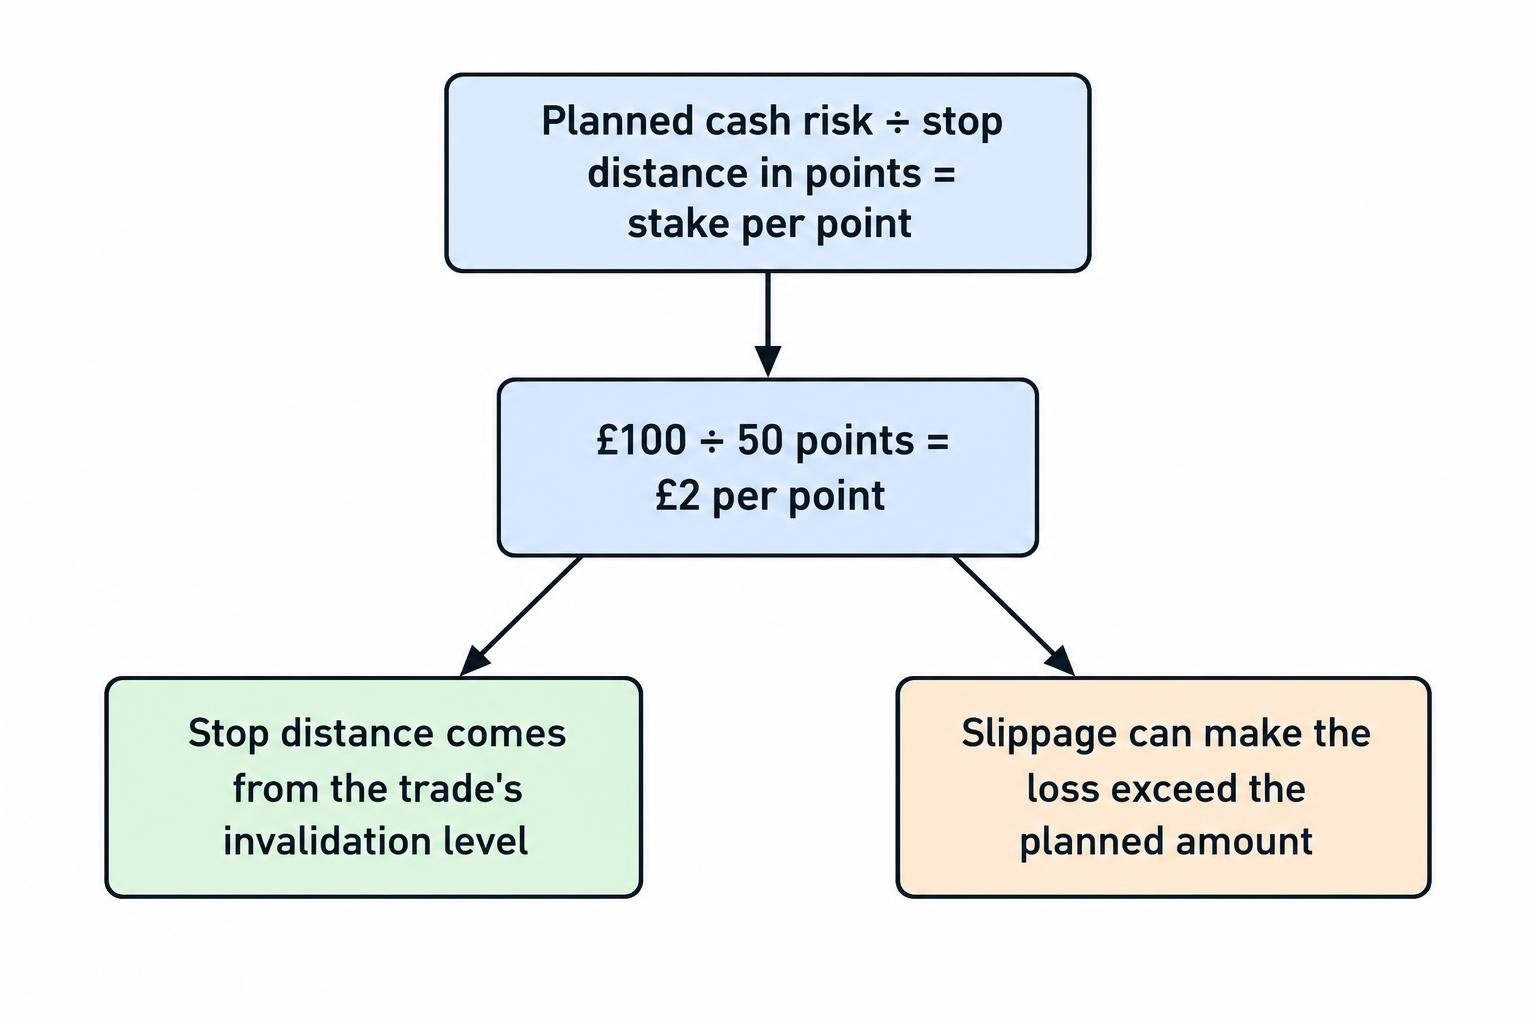
Professional position sizing works backward from acceptable monetary risk and technical invalidation distance, rather than the maximum leverage an account permits. The formula is straightforward:
Planned Cash Risk (£) ÷ Stop Distance in Points = Stake per Point (£/pt)
If your trading plan limits risk to £100 and your technical stop requires a 50-point buffer, your stake is exactly £2 per point (£100 ÷ 50). Standard stop-loss orders remain subject to slippage during gaps and illiquid sessions; where gap protection is essential (e.g., across weekend earnings announcements), consider using a Guaranteed Stop-Loss Order (GSLO) for a defined premium.
Account margin must be monitored holistically across all active positions. Under statutory FCA retail rules (COBS 22.5), spread betting brokers must enforce automated margin close-outs when total account equity falls below 50% of required margin. Holding multiple correlated trades simultaneously rapidly consumes your free margin buffer, leaving the account vulnerable to automated liquidation before stops are triggered.
A Worked Spread Betting Strategy Example
To see how these rules integrate into an actionable plan, consider an illustrative intraday breakout strategy on the FTSE 100 cash index:
- Setup Filter: Price trades above the 50-period EMA on the 15-minute chart, with the prior session high at 8,200.
- Entry Trigger: A 15-minute candle closes above 8,200. Entry fills at the broker’s ask price of 8,202.
- Invalidation Level (Stop): Placed at 8,177 (25 points risk), sitting below the breakout candle’s low.
- Stake Sizing: Account size is £10,000 with a 1% risk limit (£100). Stake = £100 ÷ 25 points = £4 per point.
- Profit Target: Set at 8,252 (50 points profit), establishing an initial 2:1 risk-to-reward target (£200 gain).
- Time Stop: Position is closed manually by the 16:15 UK cash market close if neither stop nor target has triggered.
This clear rule structure ensures every trade can be objectively audited. If execution slips and fills at 8,170 rather than the stop level of 8,177, the realised loss increases to 32 points (£128). An audit trail allows a trader to distinguish between normal execution variance and structural flaws in the trading system.
How to Judge Profitability Beyond the Win Rate
Judging a strategy solely by its win rate is a major mistake in financial trading. A strategy winning 80% of trades will still destroy capital if its average loss is five times larger than its average gain. Performance should instead be evaluated using mathematical expectancy expressed in R-multiples (where 1R equals initial monetary risk):
Expectancy = (Win Rate × Average Win in R) − (Loss Rate × Average Loss in R)
For example, a trend-following system with a modest 40% win rate that produces average winners of 2.5R and average losers of 1R yields an expectancy of +0.40R per trade [(0.40 × 2.5) − (0.60 × 1.0)]. Across 100 trades risking £100 per setup (1R), the net expected gross return is £4,000. Evaluating systems through expectancy, maximum drawdown and recovery periods prevents chasing unviable high-win-rate systems that carry catastrophic tail risk.
Backtesting Without Designing a Strategy Around the Past
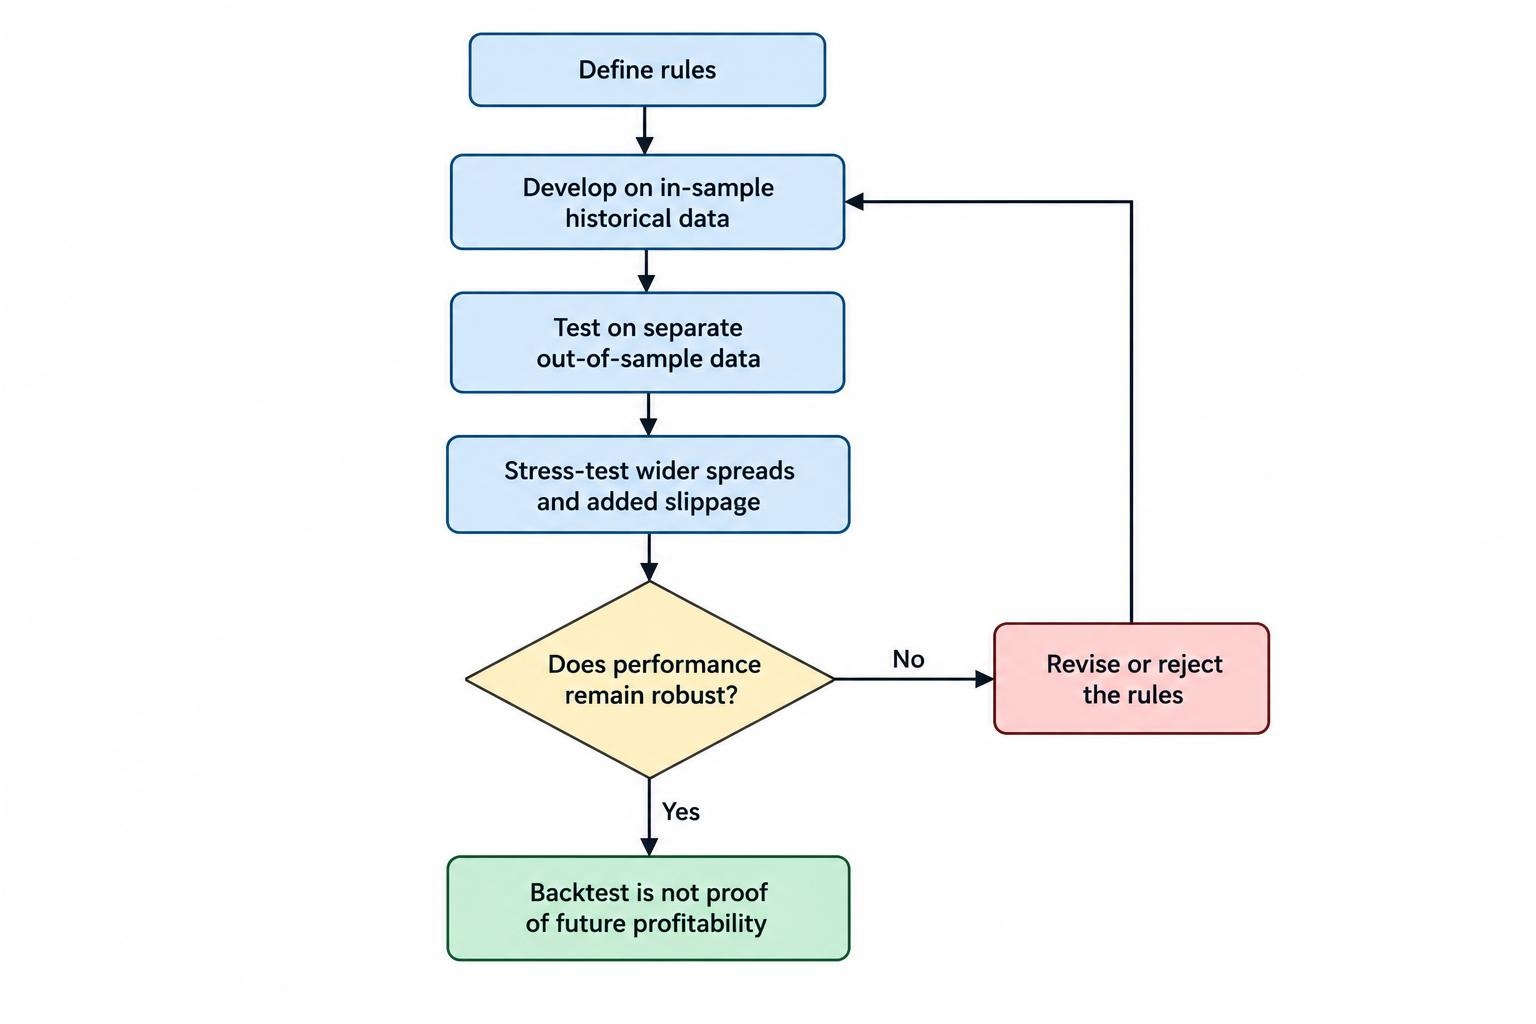
Backtesting evaluates rules against historical price data to examine drawdowns and performance metrics. However, excessive optimization creates curve-fitting (data-snooping bias), where parameters are overtuned to match historical market noise. In academic research on quantitative finance, Bailey, Borwein, López de Prado and Zhu demonstrate the mathematics of backtest overfitting, showing how testing dozens of indicator variations virtually guarantees finding a “profitable” model that collapses in forward testing.
To conduct legitimate backtests, separate historical data into in-sample (development) and out-of-sample (validation) periods. Stress-test performance by widening spread assumptions and adding artificial slippage on execution. If a system’s profitability vanishes after increasing spreads by half a point, it lacks the operational robustness required for live spread betting.
Demo Trading, Live Trials and Strategy Review
A demo spread betting account provides a risk-free environment to master order tickets, test contingent OCO orders and verify automated rules. However, demo trading cannot replicate live market slippage, partial fills or the psychological pressure of managing real capital losses. Practice on a demo balance that matches your intended live capital rather than a £100,000 fantasy allocation.
Transition from demo trading to a micro-stakes live trial (£0.10 to £0.50 per point) to measure real execution friction under live market conditions. Maintain a detailed trading journal logging the entry trigger, stop placement, execution slippage, holding fees and whether rule deviations occurred. Systematic weekly reviews provide the empirical data needed to refine risk management without abandoning strategies during normal losing streaks.
Which Spread Betting Strategy Should You Start With?
Beginners should prioritize operational clarity over tactical complexity. A recommended starting architecture is a daily swing-trading approach on one liquid benchmark (such as the FTSE 100, EUR/USD or S&P 500) using a clear trend-pullback or support/resistance breakout rule. Executing on higher timeframes (daily/4-hour charts) filters out intraday market noise, minimizes spread friction and allows positions to be managed outside working hours.
Select an approach that matches your personal schedule and psychological risk profile. Ensure the broker’s minimum stake size accommodates your 1% risk limit without forcing you to position your stop closer than the market structure demands. In financial spread betting, longevity depends on risk management discipline: staying flat when conditions are absent is just as critical as executing when an edge appears.