Breakout trading with financial spread betting means taking a position when price moves beyond a defined boundary, such as resistance, support or the edge of a trading range. The trader buys an upward break or sells a downward break, expecting further movement in that direction. The challenge is that crossing a line on a chart does not establish that the move will continue. Price can reverse immediately, and a trade can become unattractive if its entry slips too far beyond the intended level. This guide explains how breakout spread betting works, who it may suit, its advantages and disadvantages, and how to develop and test a practical process. The examples are hypothetical and include successful trades, failed breaks and execution problems.
What is breakout trading in spread betting?
A breakout is a move beyond a boundary identified before the move occurs. That boundary could be the highest price of the previous session, a multi-day range, a recent swing high or a price channel calculated from completed periods. A move below support is sometimes called a breakdown, although breakout trading commonly covers both directions. The strategy attempts to profit from continuation after the boundary is crossed. It does not require the trader to believe that every break signals a new long-term trend. Some methods seek a brief intraday extension, while others hold for several sessions. Within financial spread betting strategies, breakout trading describes an entry idea that still needs rules for risk, execution and exit.
The spread bet determines how that idea translates into money. A long position opens at the provider’s buy price and closes at its sell price; a short position opens at the sell price and closes at the buy price. The difference between those executed prices, multiplied by the stake per point, gives the price profit or loss before separate charges and adjustments. The underlying asset is not purchased. The FCA includes spread betting within its supervision of contracts for difference and related products, which it describes as high risk. A clearly defined breakout level does not change that product risk. Losses can arise from a failed move, excessive exposure, gaps, execution differences or the cost of holding the position.
Breakout trading versus trend trading and range trading
Breakout trading and trend trading often overlap, but they answer different questions. A breakout rule identifies a possible entry when price leaves a defined area. A trend rule describes the directional conditions in which the trader wants exposure and may also govern how long to remain involved. A breakout can start a trend, continue an existing one or fail before either happens. Range trading generally takes the opposite starting position: it looks for the boundary to hold and price to return towards the range’s interior. Switching between these explanations after entering makes the record difficult to interpret. Decide whether the trade depends on continuation or rejection before placing it, and define the evidence that would prove the premise wrong.
The holding period is a separate choice. An opening-range breakout might be used within day trading, with all positions closed during the session. A break above a multi-day consolidation might form part of a swing-trading method that accepts overnight exposure. The same chart pattern can therefore lead to different costs, stop distances and monitoring requirements. A trader should specify the chart interval used to define the boundary, the interval used for confirmation and the intended exit horizon. A failed five-minute breakout does not become a valid weekly position merely because a longer chart still looks positive. That change replaces the original plan and can leave the account carrying risks it was never sized to accept.
How to identify a useful breakout level
A useful level can be described consistently using information available before entry. Horizontal support and resistance may come from previous highs and lows or a clearly observed trading range. A price-channel method might use the highest high and lowest low of the previous 20 completed candles, excluding the current candle from the calculation. An opening-range method uses a stated period after a chosen market opening. The exact definition matters more than how neatly the line fits a completed chart. Drawing a new boundary after every price change can make almost any move look predictable. Record the level, its reference prices and the time it became valid so that the setup can later be assessed without hindsight.
Levels are also affected by the data being viewed. A chart may show bid prices, offer prices, midpoints or transactions in an underlying market, while the spread bet uses its own executable quote. An index’s cash market, its futures contract and an out-of-hours spread betting price need not be identical. A share chart adjusted for corporate actions may also differ from the prices relevant to a historical order. Identify the instrument and price basis before transferring a level between charts. A breakout drawn at 8,000 on a bid chart should not automatically be treated as the same event as an offer-based order triggering at 8,000. That distinction becomes especially important when the spread widens near the boundary.
Three ways to enter a breakout trade
Entering as price crosses the level
The most direct method enters as price moves through the chosen trigger. A trader may use a stop-entry order placed beforehand or submit an order after observing the break. This approach can capture a move that accelerates without offering another opportunity, but it is exposed to brief breaches that reverse immediately. An ordinary stop-entry order is a trigger for execution, not a guarantee of the entry price. If price jumps beyond the level, the fill may arrive farther away than planned. Define an acceptable entry range and understand whether the order type can enforce it. A manual decision to avoid chasing cannot protect an unattended pending order that has already triggered under the provider’s terms.
Waiting for a candle to close beyond the level
Another method requires a completed candle to close outside the boundary before considering an entry. This rejects some temporary intraperiod breaches, but it enters later and may miss much of a fast move. The candle interval changes what confirmation means: a five-minute close and a daily close expose the trader to different information and delays. The entry must use a quote available after the confirming close becomes known. A backtest should not observe the final close and then assume an earlier fill within the same candle. There is also no guarantee that the next candle will continue in the same direction. Confirmation is an additional rule to evaluate, rather than evidence that a false breakout has become impossible.
Waiting for a breakout and retest
A retest method waits for price to break the boundary, return towards it and show behaviour consistent with the new direction. After an upward break, the trader might look for the former resistance area to hold during a pullback before buying. This can provide a closer invalidation point than chasing the initial move, but the retest may never occur. It may also move through the level rather than hold it. Define what counts as a return, what triggers the entry and how long the opportunity remains valid. A limit order waiting at the old boundary buys or sells on arrival; it does not by itself confirm that the level has held. These are different entry designs and should be tested separately.
| Entry approach | Possible benefit | Main trade-off | What the rule must specify |
|---|---|---|---|
| Immediate break | Participation before a fast move travels farther | False triggers and entry slippage | Trigger price basis, order type and acceptable execution |
| Candle-close confirmation | Filters some temporary breaches | Later entry and missed movement | Candle interval and entry after the close is known |
| Breakout and retest | Potentially closer invalidation point | Missed trades or retests that fail | Retest zone, confirmation and expiry of the setup |
Who might breakout trading suit?
Breakout trading may suit someone who prefers clear preparation and can accept that a well-defined signal still produces uncertain outcomes. The trader can identify levels before the session, specify orders and evaluate whether each decision followed the plan. That structure can be useful for people who dislike inventing a new explanation for every price fluctuation. However, the method requires patience while price remains inside the range and discipline when a move begins without offering an acceptable entry. Some approaches also involve repeated small losses before a sustained move occurs. A suitable trader must be able to assess the whole sequence rather than demand immediate confirmation from every position. The ability to leave a missed trade alone is often more useful than quick reactions.
The approach is a poor fit for someone who treats every fast candle as an opportunity, increases stakes after failed breaks or needs predictable daily profits. Intraday versions can require concentrated attention during openings and announcements, while longer-term versions require tolerance for overnight exposure and carrying costs. Beginners may find the basic pattern easy to recognise, but order triggering and execution are less obvious than the line on the chart. Someone who can only check a phone occasionally should not assume that pending orders remove the need to manage the setup. They need to understand cancellation, expiry and what happens when the market opens beyond the trigger. Suitability depends on the complete process and its demands, not simply on liking chart patterns.
Advantages and disadvantages of breakout spread betting
Breakout trading can provide clear conditions for entering, rejecting and reviewing a trade. Levels established in advance make it easier to compare the original plan with what actually happened. The approach can participate in a new directional move without requiring a prediction of the event that causes it. Spread betting allows both upward and downward expressions, subject to the availability and terms of the contract. A method can also be adapted to different holding periods, from an intraday opening range to a longer consolidation. Those features make the strategy understandable and testable. They do not establish an edge: a simple rule can lose money consistently, and the apparent size of the move after a breakout says little about the entry price the trader could actually obtain.
The disadvantages centre on failed continuation and difficult execution. Price can cross the boundary, attract entries and return to the range before much profit is available. Fast moves can widen spreads or create slippage just when the strategy wants to trade. Waiting for extra confirmation may improve some entries but worsen others by moving the fill closer to the eventual reversal. Stops placed very close to the boundary may be hit by ordinary retests; wider stops require smaller stakes to maintain comparable planned risk. Overnight positions can gap beyond their exits, and unsuccessful repeated attempts accumulate costs. A breakout method therefore needs rules for when to stop trying the same level, rather than assuming that the next attempt must finally work.
False breakouts: what failure actually looks like
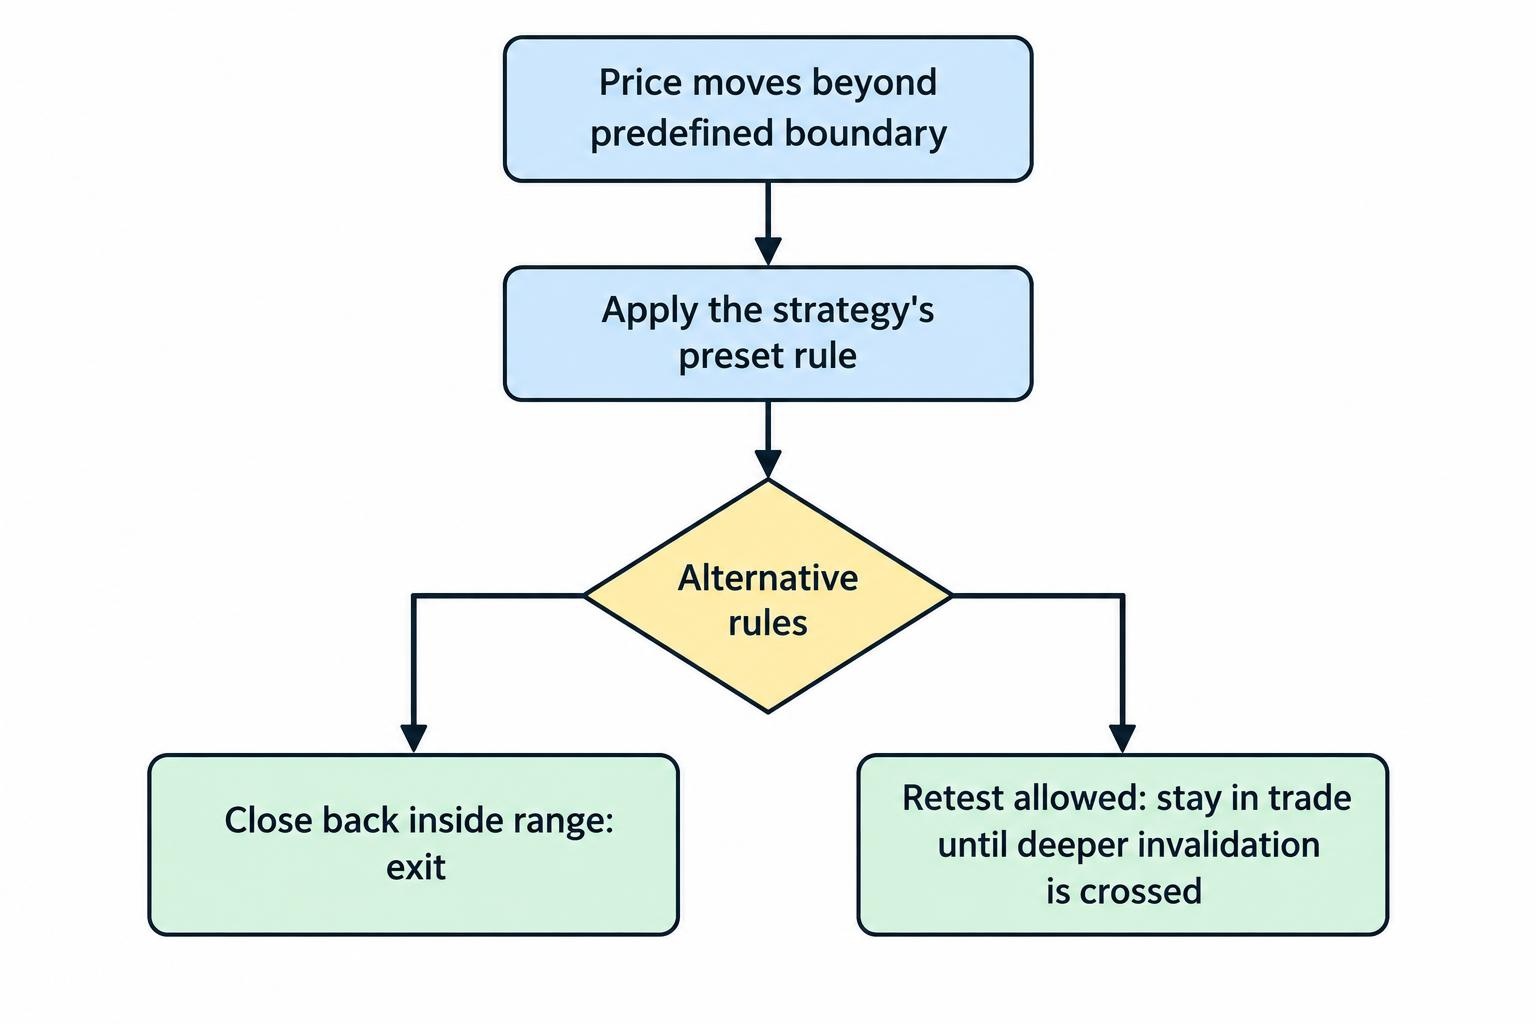
A false breakout generally describes a move beyond a boundary that fails to sustain the expected continuation. The exact definition depends on the strategy. One method may treat a close back inside the range as failure, while another allows a retest and only exits if a deeper level is crossed. State that rule before the trade, because a successful retest and a failed break can look similar at first. A long upper wick is not enough to diagnose the cause of the move or prove deliberate manipulation. Price may have changed because of ordinary order flow, new information or thin liquidity. The useful task is to measure how the strategy handles that behaviour, not to invent an explanation that excuses every loss.
Filters can include the broader trend, a completed close outside the range, acceptable volatility, the time of day or evidence of increased trading activity. Each filter changes the trades taken and can exclude winners as well as losers. Volume needs careful interpretation: exchange volume, provider tick volume and activity from one venue are different observations. Retail spot forex does not provide one consolidated exchange volume figure for the entire market. A price squeeze or a narrow range also does not guarantee a large subsequent move or its direction. Treat these observations as conditions to test. Adding enough filters to explain every historical failure can leave a method that describes the past beautifully but has no useful record on unseen data.
Practical example: buying an index breakout
Suppose a hypothetical index has traded between 7,940 and 8,000 on the chosen bid-price chart. The trader prepares an upward breakout setup with a buy stop-entry trigger at an offer price of 8,004. This assumes the provider triggers that order from the offer and the trader has checked the spread and underlying chart context. The order fills at 8,006 after a small price jump. At £1 per index point, an intended stop exit at 7,976 creates £30 of planned price risk. The target is a closing sell price of 8,066, giving £60 of potential price profit from the actual entry. These levels are illustrative, and the example assumes the contract permits the required stake and order distances.
If the sell price reaches 8,066 and the exit fills there, the result is £60 before separate charges. If price instead returns inside the range and an early-failure rule closes at 7,994, the loss is £12. If the ordinary stop fills at 7,976, the loss is £30; if it slips to 7,966, the loss becomes £40. These are alternative outcomes, not a sequence of transactions. The example assumes the position closes before any applicable overnight funding cut-off and has no other fees or adjustments. Because entry uses the actual buy price and exit uses the actual sell price, the spread is already included. Subtracting it again would understate the result.
| Alternative outcome | Actual closing sell price | Calculation at £1 per point | Price profit or loss |
|---|---|---|---|
| Target reached and filled | 8,066 | (8,066 − 8,006) × £1 | +£60 |
| Early exit after failure | 7,994 | (7,994 − 8,006) × £1 | −£12 |
| Initial stop fills as planned | 7,976 | (7,976 − 8,006) × £1 | −£30 |
| Stop slips below the intended level | 7,966 | (7,966 − 8,006) × £1 | −£40 |
The entry price changes the trade’s arithmetic even when the chart level, target and stop stay fixed. An entry at the intended 8,004 would offer £62 of potential price profit against £28 of planned price risk at the same stake. The actual 8,006 fill changes those amounts to £60 and £30. An entry as late as 8,020 would leave £46 of potential profit against £44 of planned risk. That deterioration is why a breakout method needs a response to chasing and slippage. Reducing the stake lowers the monetary exposure but does not restore the original reward-to-risk relationship. The trader must decide how unacceptable fills are handled, including what an order can prevent and what can only be addressed after execution.
Practical example: selling a forex breakdown
Suppose EUR/USD has support near 1.0800 and a trader plans to sell a confirmed move below it. The hypothetical contract defines one point as one pip, or 0.0001. The actual sale fills at 1.0797 for £1 per pip, with an intended stop purchase at 1.0822. The 25-pip distance gives £25 of planned price risk. If the decline continues and the position closes at the offer price of 1.0747, the 50-pip gain produces £50 before carrying costs. Assuming a £3 net financing debit over the holding period and no other adjustments, the result is £47. The funding figure is illustrative; short forex positions can incur a debit or receive a credit depending on the contract and applicable rates.
The short must close at the buy price, so a bid chart reaching 1.0747 does not establish that the profitable exit was available at that level. The offer may still be higher. If the breakdown fails and a rapid rally causes the stop purchase to fill at 1.0830, the price loss is 33 pips, or £33, before financing. This exceeds the £25 planned price risk. The example also assumes that the stake applies to a full pip, rather than a fractional-pip display increment. Check the contract specification and monetary preview before trading. A correct directional view cannot compensate for a misunderstanding of the point value, and a properly entered stop does not guarantee its fill during a sharp reversal.
Spread widening, slippage and order handling
A trigger can be reached because the executable quote changes differently from the chart reference. Suppose the bid remains at 7,999 while the offer widens from 8,001 to 8,005. A buy stop-entry order triggered by the offer at 8,004 could activate even though the bid never broke above an 8,000 resistance line. This is a hypothetical illustration of quote mechanics, not an allegation about a provider. Understand the trigger reference, chart setting and spread conditions before interpreting the event. Where a strategy depends on a maximum spread, establish how that condition is enforced. An alert watched manually, a platform-supported condition and an ordinary unattended stop order do not provide the same control over entry.
A stop-limit entry can restrict the acceptable execution price after its trigger, but it may remain unfilled when the market jumps beyond the limit. A market or ordinary stop-entry order prioritises seeking execution without providing the same price restriction. Neither is universally preferable: the choice depends on whether missing the trade or accepting a worse fill causes the greater problem for the tested method. Check order expiry, minimum distances and how attached stops are positioned after a slipped entry. If orders are placed on both sides of a range, confirm whether one cancels the other and what happens during a rapid reversal. Two unlinked orders can both execute, producing unintended exposure or closing an existing trade under the account’s dealing arrangements.
Stop placement, profit targets and time exits
An initial stop should reflect the setup’s invalidation point or another clearly defined risk rule. Some methods exit just inside the broken boundary; others allow a deeper retest or place the stop beyond the opposite side of the range. These choices produce different loss sizes and probabilities of being stopped. Recent volatility can help assess whether a distance is plausible, but ATR does not predict the largest possible adverse move. An ordinary stop can slip. A guaranteed stop, where available, provides a contractual exit under its terms, with potential premiums and distance restrictions. Choose the stop logic before calculating the stake, rather than moving the stop artificially close to make a desired position size appear affordable.
Profit-taking can use a fixed target, a trailing exit or a combination, but the rule should match what the strategy is trying to capture. Projecting the height of a range beyond its boundary creates a measurable target; it does not establish the probability of reaching it. A trailing exit can participate in a longer move while giving back some unrealised profit before closing. A time exit closes the trade when the expected continuation has not developed within a stated period. Partial exits change average wins and remaining exposure, so they need their own evaluation. Moving a stop to the entry price also does not guarantee a net break-even result, because slippage, funding and other charges can still leave a loss.
Position sizing, margin and repeated attempts
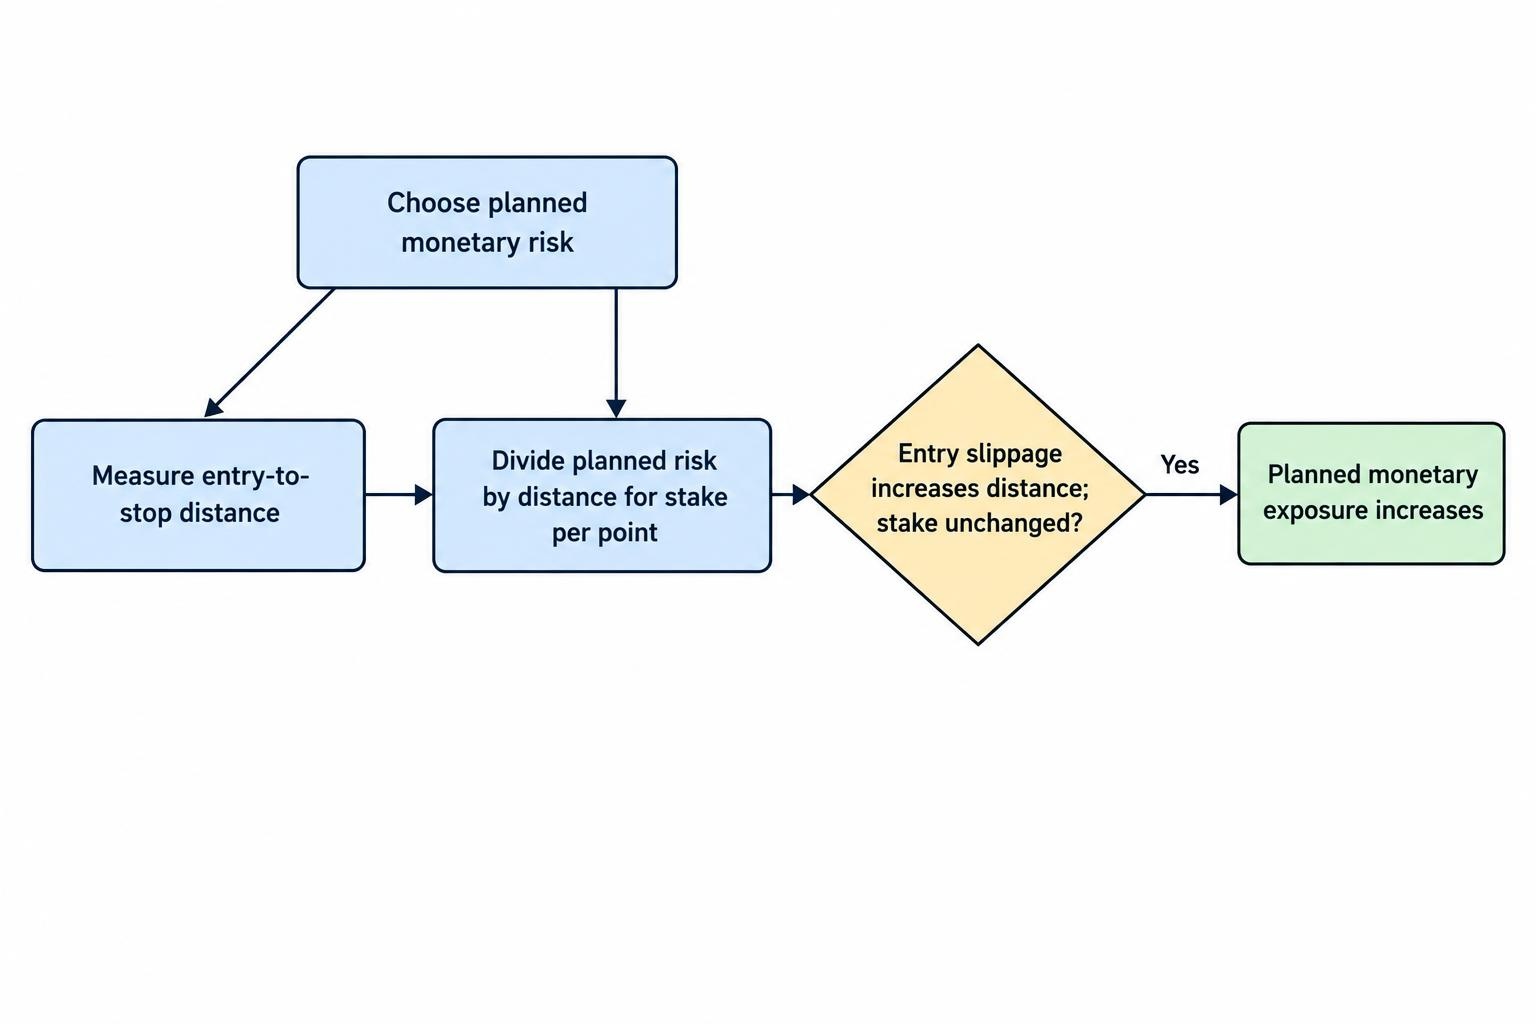
Calculate the stake from the amount allocated to planned price risk divided by the distance between the actual entry and intended stop. A £30 allowance and a 30-point distance give £1 per point. If an entry slips and the distance becomes 40 points, the same stake creates £40 of planned price risk instead. A pending order sized before the fill therefore needs an explicit allowance or response for execution differences. These figures demonstrate the calculation, not a recommended allowance. The position sizing guide also considers costs, minimum stakes and account constraints. A setup that cannot be sized appropriately with the available contract should not be made to fit by removing protection or assuming that the breakout is unusually certain.
Margin is separate from the intended loss at the stop. Under FCA retail rules in COBS 22.5, minimum initial margin includes 5% for major stock indices and 3.33% for major currency pairs; firms can require more. At an index level of 8,006 and £1 per whole point, approximate exposure is £8,006, giving £400.30 at an assumed 5% margin rate. The rules also provide account-level margin close-out when net equity falls below 50% of required margin, as soon as market conditions allow, and negative balance protection for relevant retail accounts. These protections do not preserve funds already in the account or cap a trade at its intended stop loss. Available margin is therefore not a suitable way to choose the stake.
A risk plan should address the whole sequence of attempts around a level. Three failed entries with £30 price losses consume £90 before separate charges, even if each individual trade looked small. Increasing the stake after each failure can accelerate that loss. Set rules for re-entry, the maximum session exposure and when the setup becomes stale, then apply them consistently. Several simultaneous breakouts may also reflect the same underlying market move, such as correlated equity indices rising together. Treat their combined exposure as part of the decision rather than assuming each chart provides an independent opportunity. The risk management guide should sit alongside the entry method, covering losing streaks, correlation and the point at which trading pauses for review.
Opening-range and news breakouts
An opening-range method defines a high and low during a stated period after a chosen market opening, then looks for movement beyond that range. For example, a test might use the first 15 minutes of an underlying cash session, with entries considered only after those 15 minutes have completed. The period is an assumption to evaluate, not an established optimum. Specify the relevant exchange, time zone and treatment of daylight-saving changes, because a provider’s extended trading session may have a different starting point. Decide when unfilled orders expire and whether later announcements cancel the setup. A very wide opening range may create an impractical stop distance, while a very narrow one may be dominated by the spread and routine fluctuations.
News-driven breaks need separate attention because information and executable prices can change before the trader can respond. A scheduled release may cause the market to jump beyond both the intended entry and the acceptable price range. The first reaction can then reverse as participants interpret the details. Placing orders on both sides of the market does not guarantee capturing the winning direction, and a fast reversal can expose both orders to execution. A breakout method can instead exclude these periods, reduce exposure according to a tested rule or treat them as a separate strategy. The news-trading guide covers that distinction. Movement alone is not enough: the opportunity must remain viable after the fill and the possibility of a failed exit.
Costs and contract choice beyond the entry spread
Intraday and multi-day breakouts need different cost assumptions. A position closed before the relevant funding cut-off may avoid an overnight financing charge under its terms, but still incurs the spread and any execution costs. Longer holds can accumulate funding, dividend adjustments or share-borrowing charges where applicable. The FCA’s review of CFD providers’ price and value, which includes spread betting, examines charges beyond the headline spread and differences in funding practices. Compare daily funded and dated contracts using the intended holding period and total cost. Financing incorporated into a forward quote has not disappeared, and rolling an expiring contract can introduce further costs. A breakout that develops slowly can be directionally correct yet disappointing after these adjustments.
How to get started with breakout trading
Begin with one market, one type of boundary and one entry approach. Write down the data source, chart interval, trigger, permitted spread, intended stop, sizing rule, exit method and conditions that cancel the setup. Choose a trading window you can monitor and check how scheduled events interact with it. Before opening an account, follow the FCA’s guidance on checking that a firm is authorised and genuine, including relevant permissions and contact details. Read the contract specification and execution policy, paying attention to order triggering and gaps. Regulatory authorisation does not make the strategy suitable or profitable, but the account must support the method’s requirements. A clear chart rule is of little use if the necessary order controls are unavailable.
Use a demonstration environment to practise the full order sequence, including cancellations, expiry, attached exits and closing a position after a failed break. Confirm that no unwanted pending orders remain when the session ends. Record intended and actual prices so that the exercise tests execution assumptions as well as recognition of the pattern. Demo fills may not reproduce live slippage, liquidity or the emotional effect of losing money. Progress should depend on understanding those differences and producing an interpretable record, rather than achieving a short run of simulated wins. If a live evaluation is appropriate, use a suitably small stake to assess the process. There is no requirement to trade a setup simply because the level was marked in advance.
How to test a breakout strategy fairly
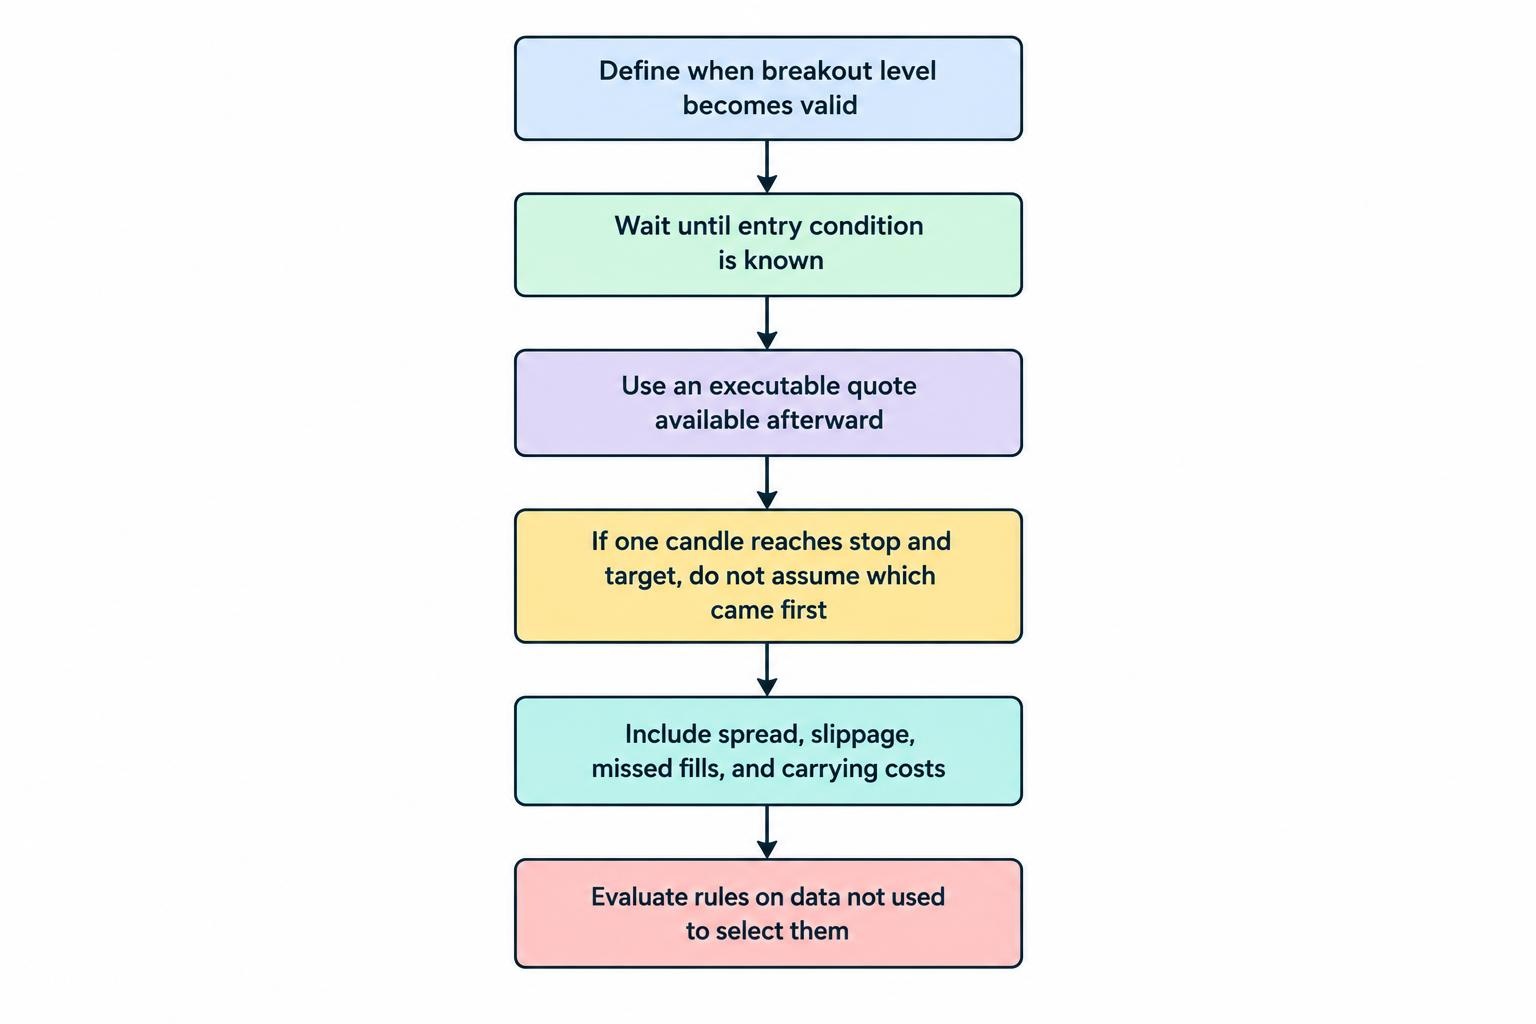
A fair test must know when the level became available, when the entry condition was satisfied and which executable prices could then be obtained. A candle that contains both the target and stop does not reveal which was reached first. Opening-range highs and lows cannot be used before the range period has ended. Retest entries should not be recorded only when hindsight shows that the retest held. Include spread changes, missed fills, slippage and relevant carrying costs, and evaluate the rules on data not used to select them. Research on the probability of backtest overfitting explains why choosing among many historical variations can create misleading results. More filters and more precise levels do not automatically make the evidence stronger.
Assess average net win, average net loss, win rate, drawdown and results across different sessions and market conditions. Suppose a hypothetical method wins 40% of trades, with an average £60 price profit and an average £30 price loss, already measured using actual bid and offer fills. Its estimated price expectancy is 0.40 × £60 minus 0.60 × £30, or £6 per trade. If additional average charges are £2 per trade, the estimate becomes £4. If average losses instead rise to £40, that same calculation produces a £2 net loss. These assumptions illustrate how execution and loss control affect results, not a typical return. Avoid subtracting the spread again when it is already embedded in the recorded fills.
UK tax treatment of breakout spread betting
HMRC’s Business Income Manual states that a person placing a spread bet is not normally carrying on a trade, with profits not taxable and losses not relieved under that normal treatment. Its guidance on spread betting exceptions explains that the contract and economic substance matter, including whether winnings arise from carrying on an existing trade. Using breakout entries does not itself determine the tax position. Residence, individual circumstances and company arrangements can require separate consideration. The ordinary treatment of spread betting profits should not be used to justify a weak strategy or excessive exposure. It affects the treatment of a result; it does not improve the probability of a successful breakout, and the normal absence of loss relief remains relevant.
Developing a breakout process you can rely on
A useful breakout process connects a level identified in advance with an executable entry, a defensible exit and a position size the account can support. It also states what happens when the move fails, the fill is worse than expected or no acceptable entry appears. The trader’s task is not to catch every move beyond a line. It is to establish whether a repeatable set of decisions produces worthwhile results after costs and whether that process can be followed through losing periods. Review missed trades as well as completed ones, because entry restrictions have consequences in both directions. A method becomes easier to assess when those trade-offs are recorded honestly, without turning every profitable chart pattern into a trade that could supposedly have been captured.