A risk-reward ratio compares the loss you plan to accept on a spread bet with the profit you aim to make. If your planned loss is £50 and your profit target is £150, the ratio is 1:3: one pound at risk for three pounds of potential reward.
That calculation helps you assess a trade, but it does not tell you whether the target is realistic or how likely the trade is to succeed. A useful ratio needs credible entry and exit prices, an allowance for costs, and evidence that your trading approach can produce enough winners. It belongs within a broader spread betting risk management plan, not in place of one.
What Does a Risk-Reward Ratio Measure?
For a spread bet with a planned stop loss and profit target, the calculation starts with two distances: the distance from entry to the stop, and the distance from entry to the target. Multiplying each distance by your stake per point converts those price movements into pounds.
Planned price risk = stop distance in points × stake per point
Potential price reward = target distance in points × stake per point
These figures exclude separate charges and assume execution at the intended prices. An ordinary stop loss does not guarantee that assumption will hold.
Throughout this article, ratios are written in risk:reward order. A ratio of 1:2 means risking £1 to target £2. Some trading resources reverse the order or use “risk/reward” to describe reward divided by risk, so check the underlying amounts rather than relying on the label.
What Does R Mean in Trading?
R represents the initial planned risk on a trade. If that amount is £60, a £120 profit is +2R and a £60 loss is −1R. Using R makes it easier to compare trades with different stakes and stop distances.
Define your convention before reviewing results. You might use initial price risk as 1R and then record every completed result after charges. Keep that original denominator fixed: changing it after a loss would turn record keeping into creative accounting.
The ratio itself does not determine cash exposure. A 1:3 trade could risk £10 or £1,000, depending on the stake per point and stop distance.
How to Calculate a Spread Betting Risk-Reward Ratio
Consider a hypothetical long index spread bet. You buy at an executable price of 8,002, intend to exit at 7,982 if the trade fails, and target an exit at 8,062. Your stake is £3 per point.
| Trade measure | Calculation | Result |
|---|---|---|
| Stop distance | 8,002 − 7,982 | 20 points |
| Target distance | 8,062 − 8,002 | 60 points |
| Planned price loss | 20 × £3 | £60 |
| Potential price profit | 60 × £3 | £180 |
| Risk:reward ratio | £60:£180 | 1:3 |
Use executable prices, not just chart levels. A long position opens at the buy price and closes at the sell price. A short position opens at the sell price and closes at the buy price. Check which quote triggers your broker’s stop and target orders, because a chart may display a different price basis.
If your entry and exit assumptions already use the correct dealing prices, the spread is reflected in the calculation. Do not deduct it again. The same distinction applies when calculating spread betting profit and loss.
Calculating the Ratio for a Short Position
Suppose you sell at 5,000, place a stop intended to close the trade at 5,025, and target 4,950. The stop distance is 25 points and the target distance is 50 points. At £2 per point, that gives £50 of planned price risk against £100 of potential price reward: a 1:2 ratio.
The direction changes, but the comparison does not. Measure the adverse movement to the stop and the favourable movement to the target, then convert both into cash using the same stake.
Risk-Reward Ratios and Break-Even Win Rates
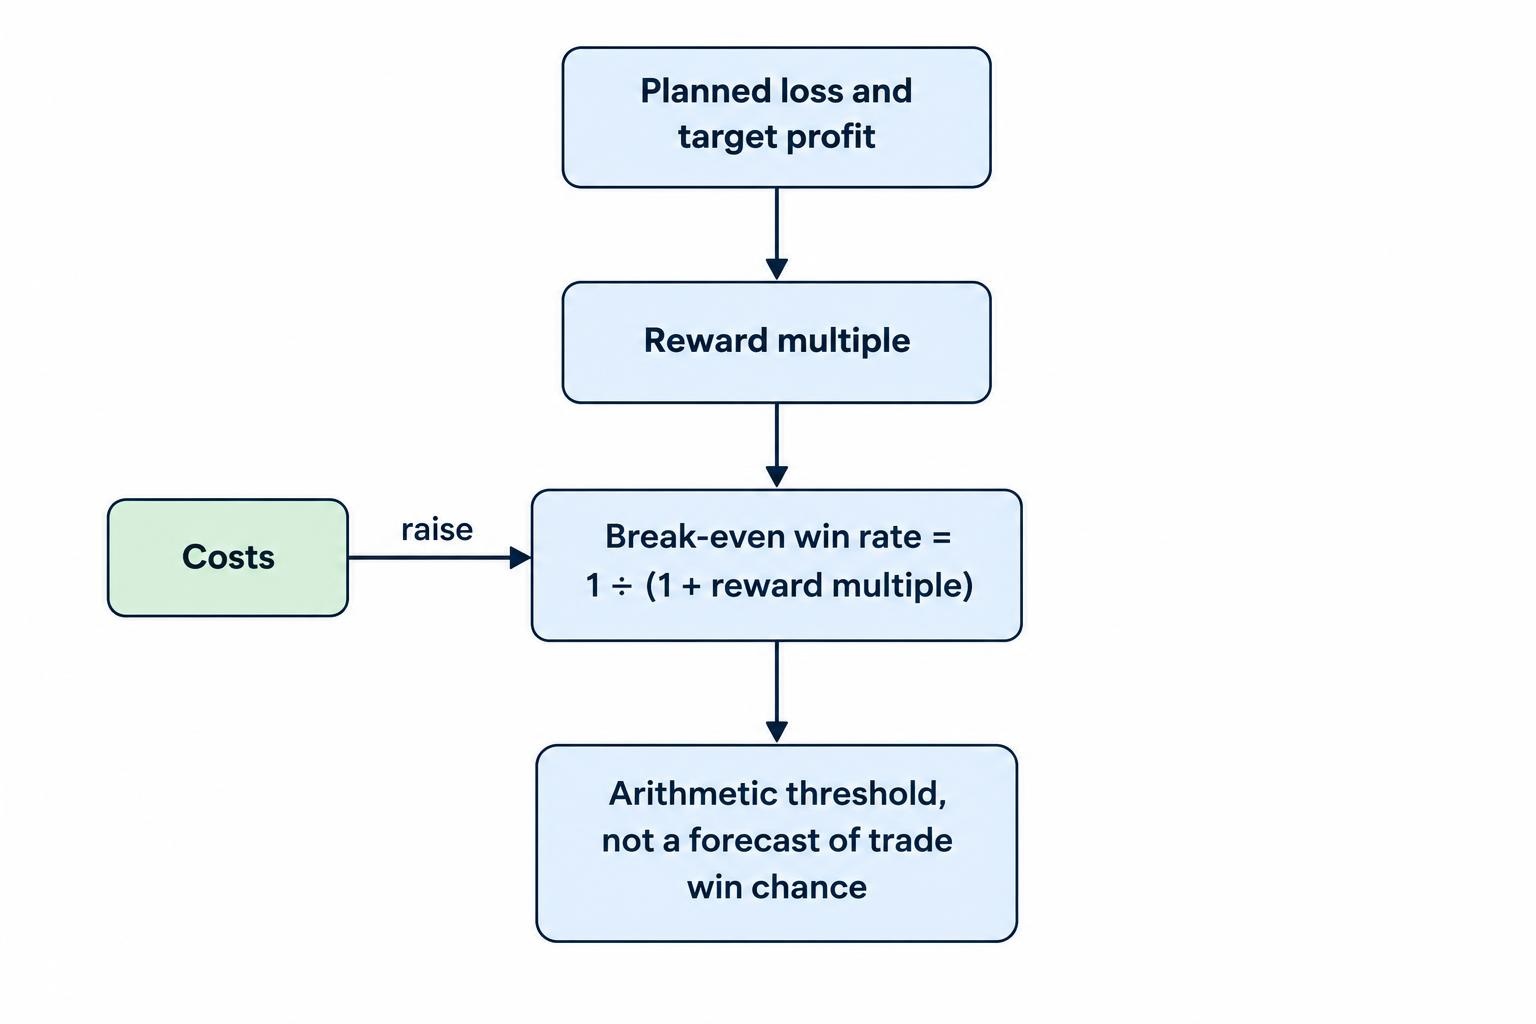
A ratio becomes more useful when paired with a win rate. If each winner earns twice as much as each loser loses, you do not need to win half your trades to break even. You need one winner for every two losers, before costs.
For a simplified strategy where every trade either reaches the full target or takes the full planned loss:
Break-even win rate = planned loss ÷ (planned loss + target profit)
Expressed using the reward multiple:
Break-even win rate = 1 ÷ (1 + reward multiple)
| Risk:reward ratio | Target profit per £1 risked | Break-even win rate |
|---|---|---|
| 1:1 | £1 | 50% |
| 1:1.5 | £1.50 | 40% |
| 1:2 | £2 | 33.3% |
| 1:3 | £3 | 25% |
| 1:4 | £4 | 20% |
These are arithmetic thresholds, not forecasts. A 1:3 setup does not come with a 25% chance of winning. The table says that winning exactly one quarter of trades would break even under its assumptions. Charges would turn that result into a loss.
Expectancy Combines Win Rate and Payoff Size
Expectancy measures the average result per trade implied by a win rate and average winning and losing amounts. This is the mathematical expectation approach used in CME Group’s trading education.
Expectancy = (win rate × average win) − (loss rate × average loss)
Suppose a hypothetical approach wins 45% of its trades, with average winners of 2R and average losers of 1R. Its calculated expectancy is (0.45 × 2R) − (0.55 × 1R), or +0.35R per trade. This is an average under the stated assumptions, not a promise about the next trade.
For completed trades, use realised results after costs. If you have flat exits, record them separately and include any charges. A trade that closes at its entry price can still lose money.
Is a 1:2 or 1:3 Ratio Better?
Neither ratio is automatically better. A larger reward multiple lowers the win rate needed to break even, but moving a target further away changes what the market must do before you get paid.
Compare two hypothetical approaches before costs. One wins 30% of trades with 3R winners and 1R losers. Its expectancy is +0.20R. Another wins 55% with 1.5R winners and 1R losers. Its expectancy is +0.375R. The approach with the smaller reward target has the higher calculated expectancy in this example.
That does not make 1:1.5 preferable either. Change the win rates, average losses or charges and the ranking can reverse. What matters is the relationship between achievable payoffs and the frequency with which your rules produce them.
A rule such as “only take trades offering at least 1:2” can serve as a screening condition. It cannot establish an advantage by itself. Nor should a trade below that threshold be rescued by placing the target further away without a reason.
Choose Credible Stops and Targets Before Judging the Ratio
Start with the trading idea. Identify the price action that would show the idea has failed, then assess where a profitable exit could reasonably sit within your intended holding period. Calculate the ratio from those levels.
For a hypothetical long trade near support, the invalidation point might lie below the area the market needs to hold. The next resistance area may constrain the available reward. The practical issue is whether there is enough room between those levels, not whether a drawing tool can display a pleasing rectangle. See the guide to support and resistance in spread betting for the chart analysis involved.
Tightening a stop from 20 points to 10 points doubles the displayed reward multiple if the target stays unchanged. But it also changes the exit rule. If that tighter stop sits inside price movement your setup needs to tolerate, the improved ratio may come with more losing trades.
The same problem appears with distant targets. A target beyond several likely obstacles may offer an attractive number without a convincing exit plan. Sometimes the sensible response is to wait for a better entry or reject the trade, not edit the chart until it agrees.
Position Size Controls the Cash Risk
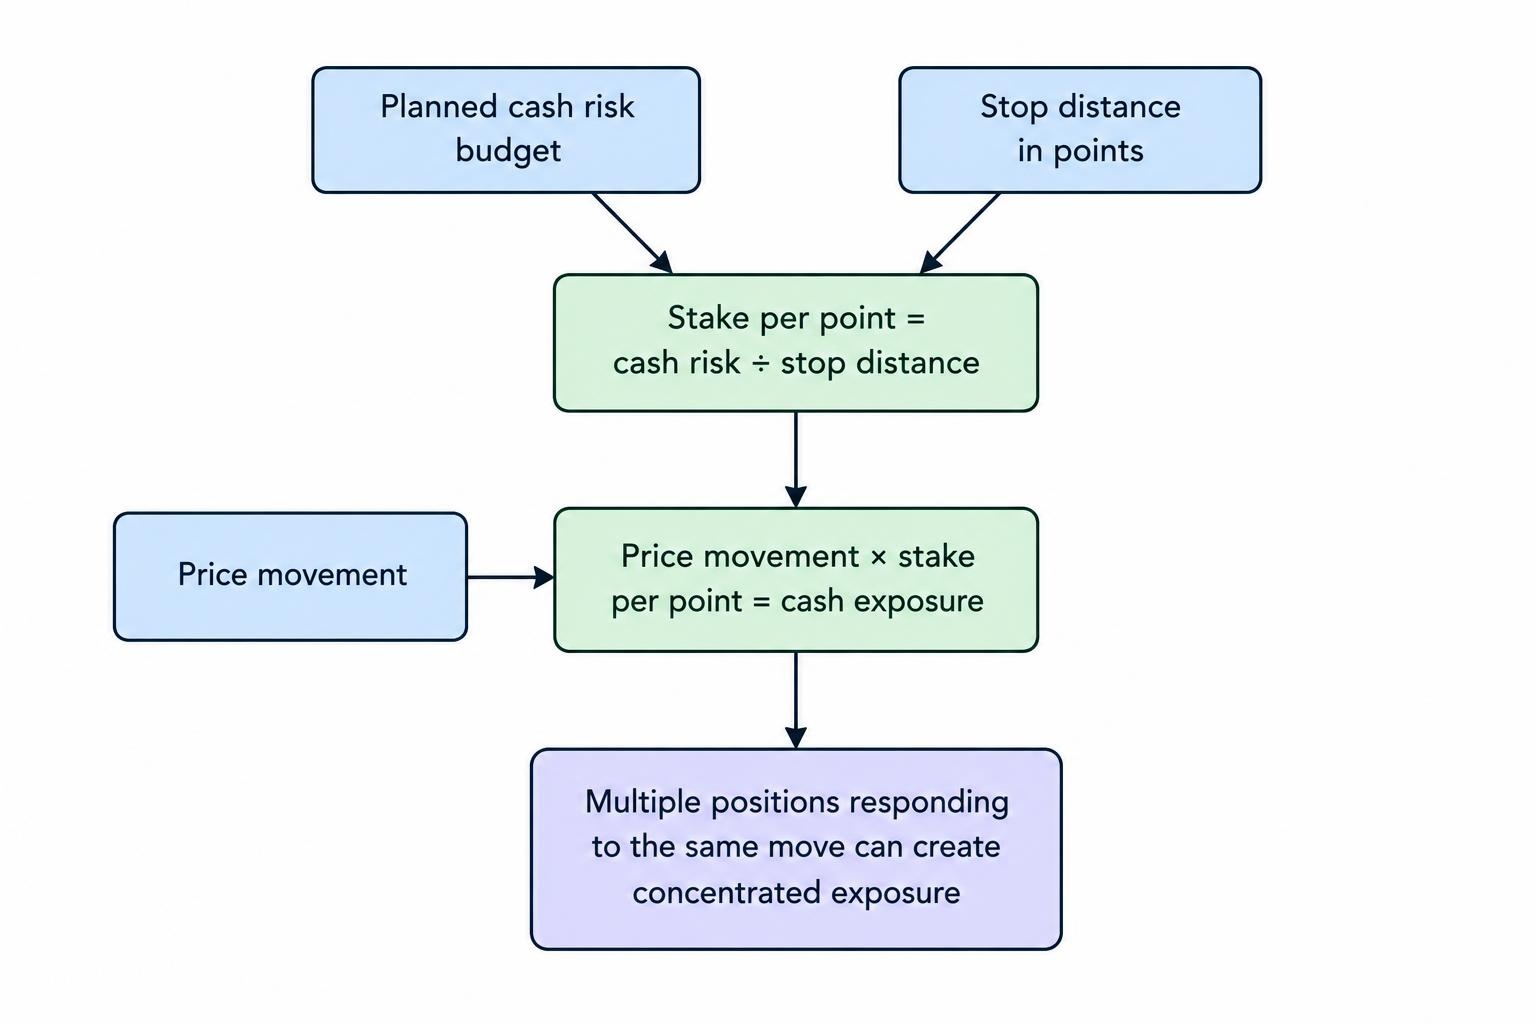
Once the stop distance is established, position size converts it into an amount your account can bear. Before separate costs, the relationship is:
Stake per point = planned cash risk ÷ stop distance in points
Suppose an illustrative £5,000 account has a £50 planned risk budget for a trade. That is 1% of equity, used here only to demonstrate the calculation. With a 25 point stop, the stake would be £2 per point before allowing for charges and execution uncertainty.
There is no universally correct risk percentage. Even the familiar 2% threshold is an arbitrary choice rather than a safety standard, a distinction made in CME Group’s explanation of percentage risk limits. Account size, trading frequency and the possibility of losses beyond the intended stop all matter.
If the chosen cash budget includes estimated charges, reserve an allowance before calculating the stake. Where charges depend on position size or holding time, check the estimate again after sizing. The full process belongs in position sizing for spread betting.
Increasing the stake does not improve the price based ratio: it multiplies both sides. It does, however, increase the money exposed. Three positions that each look acceptable in isolation can also create concentrated exposure if they respond to the same market move. Assess correlation across open spread bets rather than treating each ratio as a separate permission slip.
Include Costs in the Risk-Reward Calculation
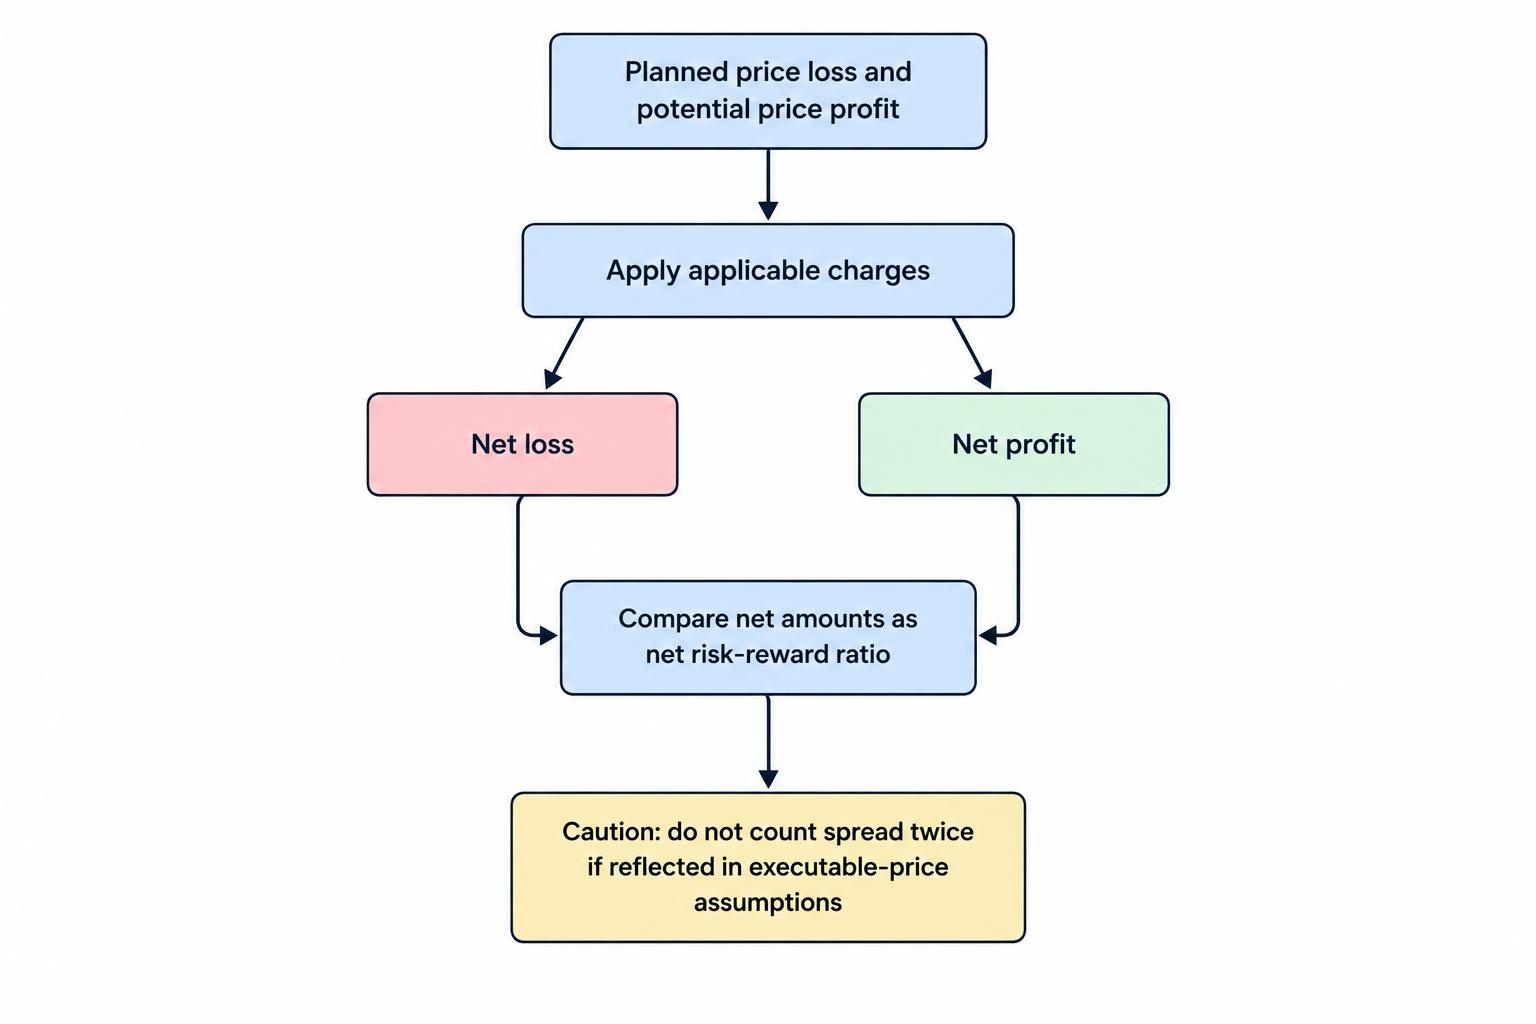
The headline ratio usually compares price movements. Your account receives the result after applicable charges, so make a second calculation using estimated net outcomes.
Return to the earlier trade with £60 of planned price risk and £180 of potential price reward. Assume, purely for illustration, an extra £8 cost in either outcome. The losing outcome becomes £68, while the winning outcome becomes £172.
Net risk:reward = £68:£172, or approximately 1:2.53
The break-even win rate rises from 25% to approximately 28.3%, calculated as £68 ÷ (£68 + £172). That difference comes entirely from the assumed costs.
In practice, costs need not be equal between winning and losing trades. A target reached after several days may incur more financing than a stop reached within an hour. Guaranteed stop charges may depend on whether the stop triggers. Use the terms for the actual product, not a single fee assumption applied everywhere.
Include only costs that apply, and avoid counting the spread twice. A comparison of total spread betting costs helps separate quoted dealing costs from the full cost of carrying out the plan.
Planned Risk Is Not a Guaranteed Loss Limit
An ordinary stop can execute at a worse price than its trigger during a fast move or market gap. This execution risk is covered in the Financial Ombudsman Service’s guidance on spread betting stop orders.
If the 20 point stop in the earlier example produces an actual exit 30 points below entry, the price loss at £3 per point becomes £90 rather than £60. Against the original £180 target, that adverse execution outcome represents 1:2 rather than the planned 1:3, before separate charges.
You cannot forecast every gap. You can, however, assess whether the position will remain open through a market closure or scheduled announcement, and whether its size remains acceptable under a worse exit scenario. The guide to market gap risk covers that wider assessment.
Where available, a guaranteed stop provides a contractual exit level subject to its terms. Include any premium and check distance restrictions before using it in the calculation. Managing risk with guaranteed stops requires a different cost assumption from using an ordinary stop.
Regulatory account protections are separate from your trade plan. For UK retail accounts covered by FCA COBS 22.5 margin and negative balance rules, positions must be closed as soon as market conditions allow when net equity falls below 50% of the required margin, and liability is capped at funds dedicated to the relevant account. Neither protection guarantees your chosen stop price or preserves your planned ratio.
Measure Realised Reward, Not Just the Original Target
A trade entered with a 1:3 target does not necessarily produce a 3R winner. Early exits, partial profit taking and trailing stops can change the realised payoff. Those decisions may be valid, but your results must reflect them.
Suppose you close half a position at +1R and the other half at +3R. The combined price profit is +2R on the original full position: (0.5 × 1R) + (0.5 × 3R). It is not a 3R winner.
If the second half instead closes at entry, the combined result is +0.5R before separate charges. Calling the remaining stop “break even” does not make the whole trade cost free.
Keep planned and realised figures in separate journal fields. Record the original ratio, the net result in pounds, and that result divided by initial R. You can then see whether the trading idea is failing, execution is worsening outcomes, or your exit decisions are reducing average winners.
Do not widen a losing stop and redefine R afterwards. If initial risk was £50 and the completed net loss is £80, the result is −1.6R. The journal should expose that change, not hide it.
How to Test a Risk-Reward Rule
Test the complete trading method rather than the ratio alone. Entry conditions, stop placement, targets, holding periods and exit changes all affect the results. A collection of attractive chart examples is not a test.
Apply the same rules to wins and losses. Record cases where the target was missed, where a gap changed the exit, and where charges consumed a small profit. If you alter the target or stop method after reviewing results, assess the revised version on data not used to choose the change.
There is no single trade count that proves a ratio works. A small sample can produce unstable estimates, while a larger sample taken under one set of conditions may still say little about another. Review how results differ between market conditions and trading sessions without repeatedly changing the rules to flatter the past.
Before placing a trade, use a short decision sequence:
- Define the entry, the price that invalidates the idea, and a defensible target.
- Calculate the ratio using executable price assumptions.
- Estimate net winning and losing outcomes after applicable charges.
- Choose a stake that fits the cash risk budget and assess worse execution.
- Check the trade against your tested rules and existing account exposure.
A spread betting demo account can help rehearse those calculations and order instructions. Treat simulated outcomes as practice, not proof that live execution or behaviour will match.
The useful question is not simply whether a trade offers 1:2 or 1:3. It is whether the target is defensible, the loss is affordable, and the realised results support taking that trade repeatedly. A risk-reward ratio measures the proposal. Your trading record shows what the proposal actually delivers.