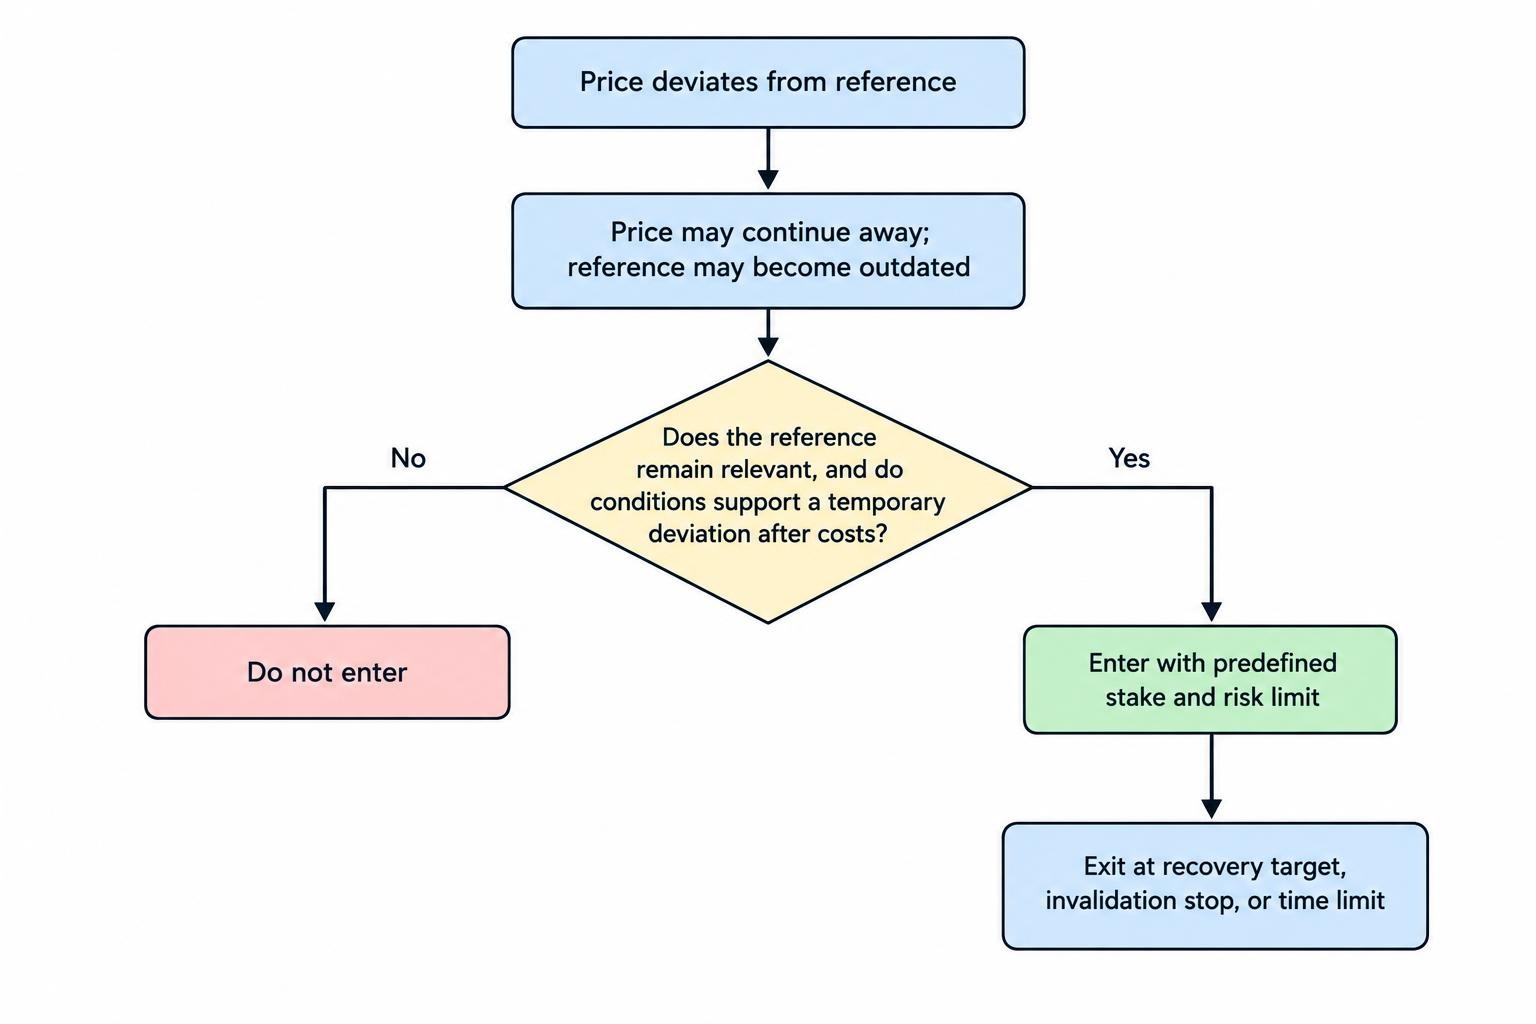
Mean-reversion trading with financial spread betting seeks to profit when a price moves back towards a chosen reference after deviating from it. A trader might buy after an unusually large decline below a recent average or sell after a sharp rise above it, expecting at least a partial return. The difficult question is whether the deviation is temporary or whether the market is adjusting to conditions that make the old reference less relevant. A price is not obliged to recover simply because an indicator calls it oversold. This guide explains the mechanics, suitability, advantages, disadvantages and practical decisions involved. All trade examples are hypothetical, with assumptions and costs stated, rather than evidence that a particular signal will produce a profit.
What is mean reversion in financial spread betting?
Mean reversion describes a tendency for a measured variable to move back towards an average or another reference after a deviation. In trading, that variable might be price relative to a moving average, an intraday deviation from a volume-weighted benchmark or a modelled relationship between two instruments. The reference must be defined before it can support a strategy. Simply observing that a market has fallen does not establish that the fall is excessive or that a return is likely within a useful holding period. Within financial spread betting strategies, mean reversion is a hypothesis to investigate. A tradable method still needs an entry signal, an exit, a risk limit and evidence that the observed behaviour survives realistic costs.
A spread bet expresses the view through a stake per point without ownership of the underlying asset. A long position opens at the buy price and closes at the sell price; a short opens at the sell price and closes at the buy price. The difference between those executed prices, multiplied by the stake, gives the price profit or loss before separate charges and adjustments. The FCA includes spread betting within its supervision of contracts for difference and related products, which it identifies as high risk. An expectation of mean reversion does not limit losses. The deviation can increase, the reference can change, or the account can reach its risk limits before any eventual recovery occurs.
What does the “mean” actually mean?
The reference might be a simple moving average of recent closing prices, an exponential average that gives more weight to newer observations, or another explicitly defined benchmark. Each answers a different question. A 20-period average on a five-minute chart describes a different history from a 20-period average on a daily chart. Neither is automatically an estimate of fair value. It is a calculation based on the selected data. The moving averages guide explains those choices in more detail. Specify the calculation, chart interval, price source and update schedule before testing a signal. Changing the reference after a trade starts losing can make the position appear reasonable while quietly replacing the premise on which it was opened.
A standardised deviation, often called a z-score, expresses the distance from a chosen mean in units of a chosen standard deviation. If the reference is 8,000, the measured price is 7,900 and the standard deviation is 50 points, the score is minus two: (7,900 − 8,000) divided by 50. That describes the observation under the selected calculation; it does not prove that price is undervalued. Nor does a two-standard-deviation reading guarantee a particular probability of reversal or recovery. Financial price observations can have changing distributions and persistent trends. Define which observations enter both calculations and test the resulting signal directly, rather than importing a probability from a textbook distribution that the trading data may not follow.
| Reference or tool | What it measures | Possible use in a strategy | Main limitation |
|---|---|---|---|
| Moving average | Average price over a defined history | Identify and target a deviation | The average moves and can lag a repricing |
| Session VWAP | Volume-weighted average price for a defined data source and session | Compare an intraday price with that benchmark | Data coverage and session definition affect the result |
| Standardised deviation | Distance from a mean relative to measured dispersion | Define a repeatable entry threshold | An extreme reading does not establish reversal probability |
| Bollinger Bands | A moving average with bands based on price dispersion | Identify relative extension | Bands expand and move; price can remain near an outer band |
| RSI | Balance of recent gains and losses in its calculation | Add a momentum or recovery condition | It does not measure fair value or supply a price target |
Mean reversion versus range trading and trend trading
Range trading expects price to move back from an identified boundary towards the interior of a relatively contained area. Mean reversion is broader: the reference can move, and the market need not remain inside fixed horizontal boundaries. A pullback towards an average can occur inside a strong trend. A trader might therefore investigate temporary downward deviations within a broader uptrend, rather than systematically oppose every directional move. This distinction matters when selecting the conditions in which the method operates. A strategy designed for short-term retracements in an upward market should not be assumed to work equally well during a sustained decline simply because the same indicator reaches an extreme reading.
Trend trading and momentum trading generally seek continuation in an established or strengthening direction. A mean-reversion entry often takes the other side of the latest move, although the relevant timeframe can make the apparent conflict less direct. Neither philosophy is universally correct. Markets can exhibit different behaviour over different horizons, and a method needs to state which behaviour it is trying to capture. The holding period remains a separate choice: an intraday reversion may form part of day trading, while a multi-session recovery may form part of swing trading. Moving to a longer horizon after the original trade fails introduces different costs and risks; it does not validate the original signal.
Who might mean-reversion trading suit?
The approach may suit someone who can work with clear definitions, wait for uncommon conditions and accept that an apparently stretched price can become more stretched. The useful temperament combines patience before entry with willingness to exit when the evidence or risk limit changes. A trader must distinguish a testable reason for expecting a recovery from the emotional appeal of buying something after it falls. The process also requires comfort with incomplete outcomes: a partial recovery may justify an exit even when the original average remains farther away. Someone who records assumptions and evaluates a series of trades can assess these trade-offs more clearly than someone who treats every missed rebound as proof that the next position should be larger.
It may be a poor fit for someone who dislikes accepting losses, habitually adds to losing positions or assumes that a familiar price must eventually return. Those tendencies can turn a bounded trading idea into an open-ended commitment to defend an entry. A high frequency of small wins can make that behaviour harder to recognise until a larger loss occurs. Beginners may understand the idea of returning to an average quickly, but judging whether the reference remains useful is more demanding. Intraday methods require attention to execution and announcements; longer holds require attention to financing and gaps. A trader who needs reliable withdrawals should not interpret a regular-looking sequence of historical recoveries as evidence of dependable future income.
Advantages and disadvantages of mean-reversion strategies
A potential advantage is that the reference provides a basis for defining both the opportunity and the exit before entering. The trader can specify a deviation threshold, a partial recovery target and an invalidation point, then compare actual decisions with that plan. A method may also identify opportunities during conditions that offer little sustained directional movement. Financial spread betting permits both long and short expressions, subject to the availability and terms of the instrument. The concept can be studied across different markets and holding periods. These features make it possible to build an interpretable process. They do not establish that the chosen average attracts prices or that the intended recovery is large enough, frequent enough or fast enough to compensate for losing trades and costs.
The disadvantages include opposing a move that continues, relying on a reference that has become outdated and accepting small gains while occasionally suffering much larger losses. Waiting for stronger evidence of reversal can reduce the distance left to the target; entering earlier can mean trading while the adverse move is still accelerating. A slow recovery can also accumulate carrying costs, and a position can be stopped before a later return that looks obvious on a completed chart. Some apparent signals disappear when spreads and missed fills are included. The method therefore needs a time limit, a monetary risk plan and a definition of failure. “It will come back eventually” provides none of those and can be expensive to maintain.
Ways to build a mean-reversion setup
Deviation from a moving average or Bollinger Band
One approach looks for price to move a stated distance from a moving average, measured in points, percentages or units of recent dispersion. Another uses Bollinger Bands to describe the extension and then requires price to return inside a band before considering entry. The details matter: buying immediately beyond a lower band is different from waiting for a completed close back inside it. The second method enters later and may miss part of the recovery, while the first can enter during a continuing fall. Neither rule is inherently superior. Define the threshold, confirmation and exit together, then test the full sequence. A band touch by itself is an observation about the calculation, not an instruction to trade.
Intraday reversion towards VWAP
Volume-weighted average price, or VWAP, combines prices with the volume associated with them over a defined period. An intraday method might investigate a deviation from session VWAP and seek a partial return under suitable conditions. The reference depends on the data source and session definition, which must be clear. Exchange-traded instruments can have identifiable exchange volume, while retail spot forex does not provide a single consolidated exchange volume series for the whole market. A platform may use a narrower feed or another measure, and an index spread bet may reference a different instrument from the displayed volume data. Those distinctions affect the signal. A price above or below VWAP also need not reverse; a directional session can remain on one side for a long time.
Using RSI as a condition rather than a complete strategy
RSI describes recent gains and losses within its calculation. It can help define a short-term momentum condition, but it is not the mean to which price must return. A low reading does not provide a price target, and an extreme can persist while a market trends. A trader might investigate a recovery from a low RSI reading only when price also meets a defined deviation and market-condition rule. That is a different strategy from buying every oversold reading. State whether the indicator must cross a threshold, close beyond it or remain there for a period. Adding several indicators based on the same price history does not create several independent reasons to expect the trade to succeed.
Temporary deviation or a lasting repricing?
The central risk is that the old reference has stopped describing the conditions in which the market now trades. An earnings surprise, interest-rate decision, supply disruption or change in financial conditions can produce a move that persists rather than reverses. A recent average still includes prices from before that information arrived. Buying solely because the market has moved far below it assumes that the earlier prices remain relevant, which may be the very point in dispute. Fundamental analysis can help identify the event and its implications, although an explanation alone does not settle the trade. A method should state how scheduled releases and unexpected news affect eligibility, rather than applying the same entry rule regardless of what caused the deviation.
Market filters might consider trend direction, the slope of the reference, recent volatility or the time of day. These conditions can reduce exposure to some unsuitable situations, but they can also exclude profitable reversals. There is no reliable filter that labels every temporary deviation and every permanent change in advance. Statistical work likewise needs care: the fact that a moving average follows price does not demonstrate that the raw price itself has a stable long-run mean. Test the variable actually used by the method, such as a defined deviation, and assess whether its behaviour persists outside the design sample. A stable-looking historical relationship can weaken, disappear or become too costly to trade without announcing the change beforehand.
Practical example: buying an index below its recent average
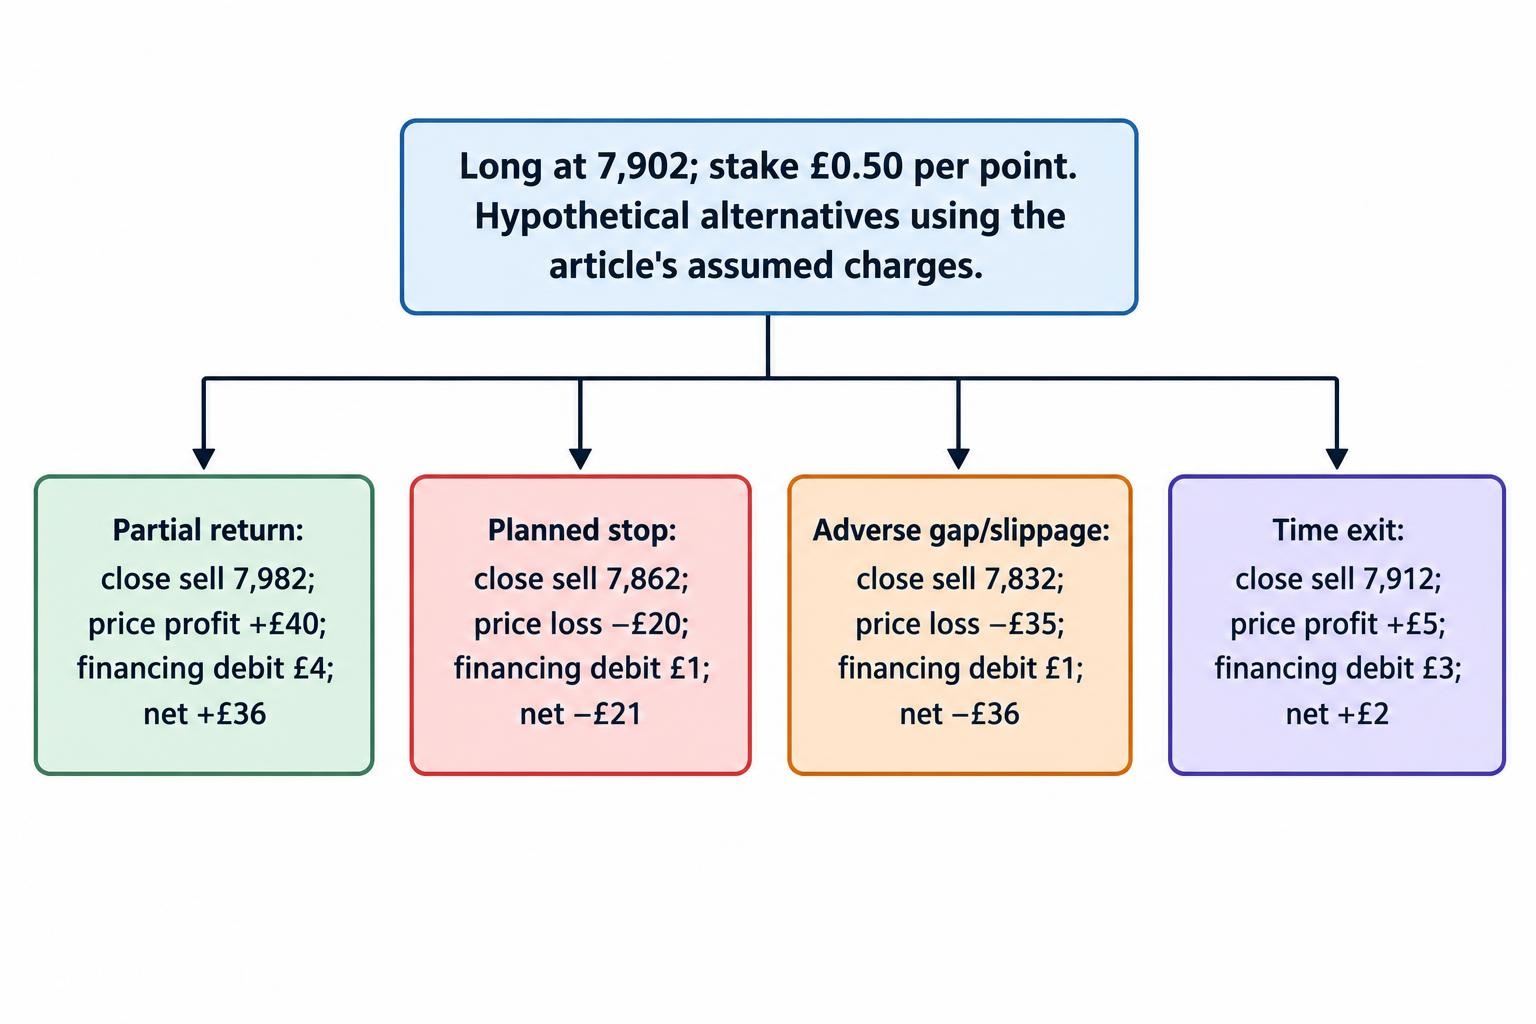
Suppose a hypothetical index has a reference average of 8,000 under the trader’s chosen calculation. After a decline and a defined stabilisation signal, the provider quotes 7,900/7,902. The trader buys at 7,902 for £0.50 per index point, planning to exit at a sell price of 7,982, slightly before the original reference. The intended stop exit is 7,862. That creates 40 points or £20 of planned price risk and 80 points or £40 of potential price profit. The example uses a fixed target established at entry, so later changes in the average do not automatically move it. It assumes the contract permits the stake and order distances. The £20 figure is an illustration, not a recommended risk allowance or guaranteed maximum loss.
If the closing sale fills at 7,982, the price profit is £40. After an assumed £4 financing debit and no other adjustments, the net result is £36. If the ordinary stop fills at 7,862, the price loss is £20; with an assumed £1 funding debit, the net loss is £21. A sharp decline causing execution at 7,832 instead creates a £35 price loss, or £36 after that assumed £1 debit. A time-based exit at 7,912 gives a £5 price gain, reduced to £2 by an assumed £3 financing charge. These are alternative paths with different assumed holding periods. The spread is already included because the calculation uses the actual opening buy and closing sell prices.
| Alternative outcome | Actual closing sell price | Price profit or loss at £0.50 per point | Assumed financing debit | Net result |
|---|---|---|---|---|
| Partial return towards original average | 7,982 | +£40 | £4 | +£36 |
| Stop fills as planned | 7,862 | −£20 | £1 | −£21 |
| Adverse gap with stop slippage | 7,832 | −£35 | £1 | −£36 |
| Time exit after a small recovery | 7,912 | +£5 | £3 | +£2 |
Practical example: selling a forex extension
Suppose GBP/USD has risen above a reference level of 1.2600, and a separately defined reversal condition has been met. The provider quotes 1.2680/1.2682. For this hypothetical contract, one point equals one pip, or 0.0001. The trader sells at 1.2680 for £0.50 per pip and sets an intended stop purchase at 1.2730, giving 50 pips or £25 of planned price risk. The target is a purchase at 1.2620, representing a partial return rather than a requirement to reach the original reference. If filled there, the 60-pip gain produces £30 before carrying costs. An assumed £2 net financing debit leaves £28, with no other adjustments. Actual funding depends on the contract and applicable rates, not simply on the position being short.
The short closes at the offer because the trader must buy back the exposure. A bid chart reaching 1.2620 does not establish that the intended purchase was available at that price. If the upward move resumes and the stop purchase fills at 1.2760 after a gap, the price loss is 80 pips, or £40, before financing. This is larger than the planned £25. The example also depends on the stake applying to a full pip, rather than a fractional display increment. Confirm the point value in the contract specification and monetary preview. A market can be above its recent average and still move far enough higher to invalidate the position before any eventual return.
A moving average can catch up with price
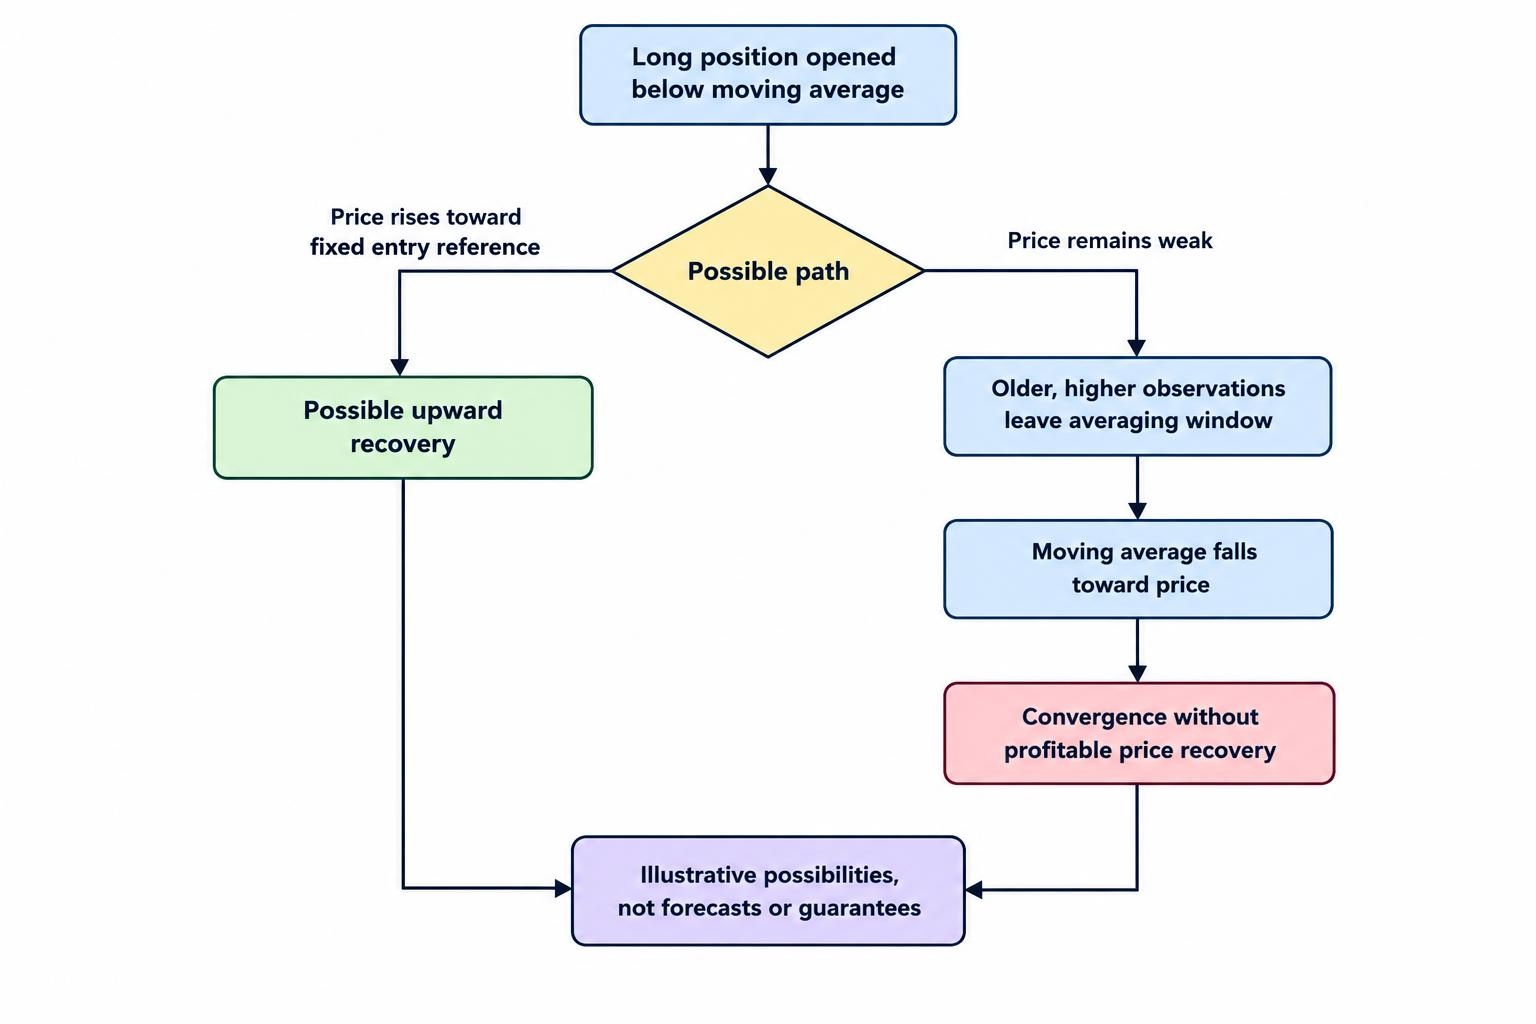
Price meeting a moving average does not necessarily mean that the expected profitable recovery occurred. Return to the index example, where the trader bought at 7,902 when the reference was 8,000. Suppose price remains weak while older, higher observations leave the averaging window. The moving average eventually falls to 7,890, where it meets the sell price. A strategy that exits at that updated reference would close 12 points below entry, creating a £6 price loss at £0.50 per point. An assumed £3 financing debit would make the net loss £9. This is a separate exit design from the fixed target in the earlier table. The statistical distance has closed, but the trader has not captured an upward recovery.
Choose explicitly between a reference fixed at entry, a continuously updated target and another exit such as partial recovery or a trailing rule. Each produces different trades. A fixed target can remain anchored to conditions that no longer apply; an updated target can move towards an unfavourable price. Neither is automatically preferable. A time exit addresses another part of the problem by ending exposure when the expected recovery has not developed within a stated period. That period should come from the method being tested, not from how long the trader feels willing to wait on a losing position. Extending the deadline whenever a trade struggles changes both the risk and the cost assumptions on which the strategy was evaluated.
Stops, position sizing and the cost of waiting
The initial stop should correspond to a defined failure condition or a planned exposure limit. It could sit beyond a relevant price structure or at a distance informed by recent movement, but it should not be moved farther away solely because the deviation has increased. ATR can help describe recent volatility; it cannot establish the largest possible adverse move. Ordinary stops can slip during gaps or fast markets. A stop-limit exit adds a price restriction that can leave the position open if no permitted fill is available. A guaranteed stop, where offered, provides a contractual exit under its terms, with premiums and distance requirements to check. The analytical expectation of reversion remains separate from these order mechanics.
Calculate the stake after choosing a defensible stop distance. An allowance of £30 for planned price risk divided by a 60-point distance gives £0.50 per point. If the distance required by the setup increases to 120 points, keeping that allowance reduces the stake to £0.25, assuming the contract permits it. These are arithmetic examples, not recommended allowances. Make room for costs and evaluate the effect of worse-than-planned exits rather than treating the stop calculation as a guaranteed loss ceiling. The position sizing guide explains this distinction. A larger deviation is not permission to increase exposure: it may reflect a larger opportunity, a more dangerous change in conditions or a reference that has lost its usefulness.
Financing, spreads and contract selection
Mean-reversion methods can be especially sensitive to the relationship between the expected recovery and the total cost of waiting for it. A small target must overcome the bid–offer spread, while a slow recovery can accumulate funding. The FCA’s review of CFD providers’ price and value, covering spread bets and related products, examines differences in funding practices and costs beyond the headline spread. For illustration, an unchanged £6,000 exposure charged at an assumed annual rate of 8% for 14 chargeable days on a 365-day basis would cost approximately £18.41. Actual calculations can use different conventions, variable rates and changing exposure. A trade that eventually recovers a modest amount may therefore disappoint after its carrying costs are included.
Compare daily funded and dated contracts using the expected holding period, spread, expiry arrangements and all relevant adjustments. Financing embedded in a forward quote has not disappeared, and rolling an expiring position can introduce further costs. Share positions can involve dividend adjustments or borrowing charges, while forex funding can be a debit or credit depending on the terms and rates. Price data also need to match the contract: an ex-dividend move, a share split or a futures rollover can create an apparent deviation that should not automatically be treated as a trading opportunity. Use appropriate historical adjustments and understand their effect on executable prices. A chart pattern caused by a mechanical adjustment is different from a temporary imbalance that a strategy expects to reverse.
Margin and account-level protection
Under FCA retail rules in COBS 22.5, minimum initial margin includes 5% for major stock indices and 3.33% for major currency pairs; firms can require more. In the index example, 7,902 multiplied by £0.50 gives approximately £3,951 of exposure. At an assumed 5%, initial margin would be £197.55, separate from the £20 planned price loss. The rules also provide account-level close-out when net equity falls below 50% of required margin, as soon as market conditions allow, and negative balance protection for relevant retail accounts. These protections do not preserve funds already in the account or guarantee an individual stop price. A belief that price will eventually return does not prevent margin-based closure before that return occurs.
Why averaging down is not evidence of an edge
Adding to a losing position lowers the average entry price of a long, but it also increases exposure while the original hypothesis is under pressure. It does not improve the probability of recovery by changing the arithmetic of the ticket. Stake-doubling or martingale arrangements can produce frequent small recoveries while accumulating much larger losses when the adverse move persists. A planned multi-entry strategy would need a total exposure limit, predetermined sizing, a shared invalidation rule and testing of the complete sequence. It should not develop as an improvised response to discomfort. Keep that distinction clear: mean reversion is an idea about market behaviour, whereas averaging down is a position-management choice. Neither supplies evidence that the other is justified.
Several mean-reversion trades can fail together when their shared driver changes. Buying multiple equity indices after a broad sell-off may create several tickets expressing much the same recovery view. Currency positions can also concentrate exposure to one currency without making that concentration obvious from the individual charts. Pairs trading introduces another form of relative-value analysis, but two related instruments do not guarantee a stable relationship or cost-free protection. This guide’s single-market examples should not be assumed to apply unchanged to paired positions. Assess the combined exposure, costs and adverse scenarios at account level. The risk management guide covers correlation, losing streaks and drawdown alongside the risk assigned to each individual trade.
How to get started with a mean-reversion process
Begin with one instrument and one clearly defined reference. Write down the data source, observation period, deviation threshold, permitted market conditions, entry confirmation, initial stop, target and time exit. Check whether the expected movement remains worthwhile after the actual spread and holding costs. Before opening an account, follow the FCA’s guidance on checking that a firm is authorised and genuine, including relevant permissions and contact details. Read the contract specification and execution policy, paying attention to point value, minimum stake and order triggering. Authorisation does not establish that a method is suitable or profitable. The account must also support the intended position size and order controls, and its costs must match the assumptions used to evaluate the strategy.
Practise the complete process in a demonstration environment, including closing a trade that has not recovered by its deadline. Record the reference and threshold as they appeared at the decision time, because later recalculation can hide what was actually observable. Test order placement, amendments and cancellation, and check what happens to protective orders when the device disconnects. Demo execution and costs can differ from live conditions, and simulated losses do not recreate the pressure of real ones. Progress should depend on an interpretable record and knowledge of those differences rather than a short series of successful reversals. If a live evaluation is appropriate, a suitably small stake can help assess execution without treating the exercise as a source of income.
Testing whether reversion survives realistic conditions
A fair test calculates each reference using information available at that time. Avoid using a full day’s eventual VWAP for morning signals or calculating an average from observations that occur after entry. Specify whether the current completed candle enters the signal and execute only after the necessary information is known. Include missed fills, bid–offer prices, slippage, carrying costs and the possibility that a target and stop appear inside the same candle without revealing their order. Research on the probability of backtest overfitting explains why selecting among many historical rule variations can create misleading results. Evaluate the chosen method on data outside its design sample, including persistent trends and repricing events rather than only periods that repeatedly returned to familiar averages.
Review the speed and size of recoveries as well as the win rate. A method might win 65% of trades with average price gains of £20 and average price losses of £30, already calculated from actual bid and offer fills. Its estimated price expectancy would be 0.65 × £20 minus 0.35 × £30, or £2.50 per trade. Additional average charges of £2 reduce that to £0.50. If the win rate falls to 60% with the same outcome sizes, the estimated result becomes a £2 loss after those charges. These are illustrative assumptions, not typical returns. Also examine losses beyond the planned stop, drawdown and dependence on particular market conditions. Frequent wins can coexist with a small or negative advantage after costs.
UK tax treatment of mean-reversion spread betting
HMRC’s Business Income Manual states that a person placing a spread bet is not normally carrying on a trade, with profits not taxable and losses not relieved under that normal treatment. Its guidance on spread betting exceptions explains that the contract and economic substance matter, including whether winnings arise from carrying on an existing trade. Calling a method mean reversion does not itself determine its tax treatment. Residence, individual circumstances and company arrangements can require separate consideration. The ordinary treatment of profits should be assessed alongside the product’s costs and risks. It does not increase the likelihood of recovery, and the normal absence of loss relief remains relevant when a strategy produces a negative result.
Building a method that can accept being wrong
A workable mean-reversion process connects a defined reference with evidence about the conditions in which deviations tend to close, then limits exposure when that expectation fails. It must distinguish a profitable price recovery from an average moving towards an unprofitable position. It also needs an answer to how long the trader will wait, how costs affect that wait and what information invalidates the old reference. Keep records that separate rule-compliant losses from execution problems and changes made under pressure. Use them to decide whether the method deserves further evaluation, needs revision or should be stopped. A recent average is a useful measurement, but the market has no obligation to restore the trader’s preferred entry price or complete the recovery on a convenient timetable.