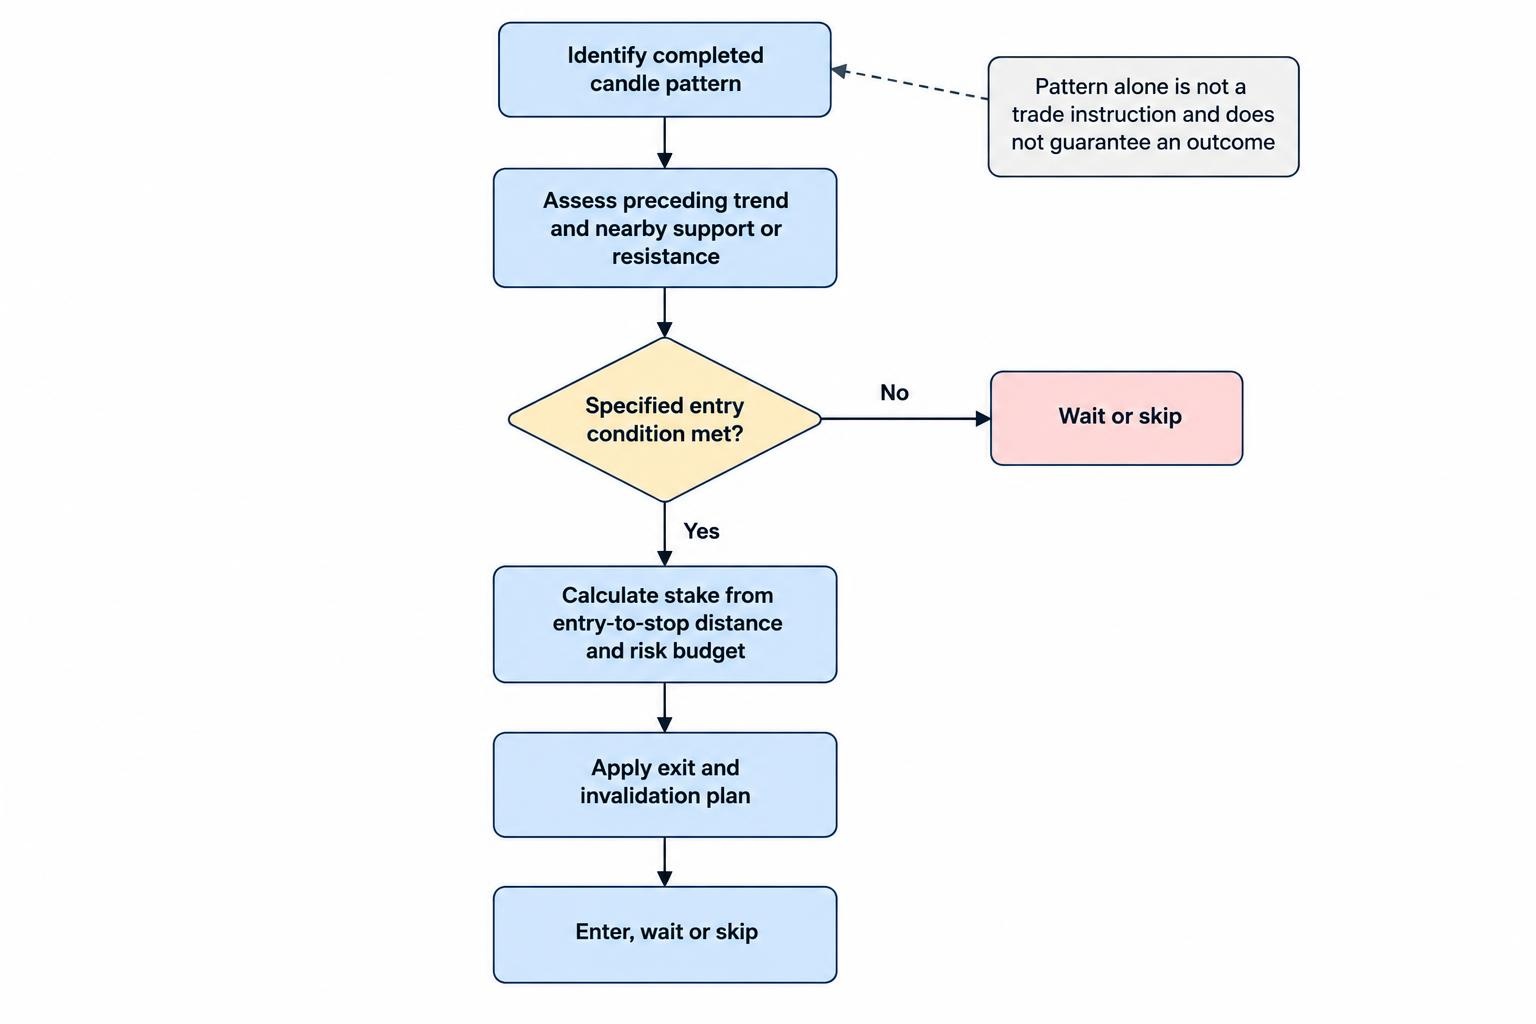
Candlestick patterns describe the relationship between opening, closing, highest and lowest prices over one or more chart periods. Spread bettors use them to investigate possible reversals, pauses and continuation moves, often near support, resistance or an established trend. A hammer, engulfing pattern or morning star can make a price observation easier to recognise and record, but its name does not establish that a profitable move will follow. A complete candlestick spread betting method also needs a market context, an executable entry, a stake, an exit plan and a clear condition for abandoning the trade. Recognising a shape is the beginning of that process rather than the finished trading decision.
This guide explains how to read candles, compare common patterns and turn a defined setup into a financial spread bet. All prices, stakes, costs and outcomes in the examples are hypothetical. They illustrate mechanics rather than demonstrate a profitable system. The Financial Conduct Authority includes financial spread bets within its coverage of contracts for difference, which it describes as high-risk products unsuitable for some retail consumers. Candlestick analysis does not remove the effects of leverage, adverse execution or market gaps. A visually convincing formation can fail, and an ordinary stop does not guarantee the closing price used in a trader’s planned loss calculation.
How to read a candlestick
A standard candlestick displays four prices for its selected period: open, high, low and close. The real body spans the opening and closing prices, while the upper and lower shadows, also called wicks, extend to the high and low. A close above the open produces an upward candle; a close below it produces a downward candle. Colours are configurable, so check the chart’s convention instead of assuming that every green or hollow candle is defined identically. The StockCharts introduction to candlesticks explains the standard construction. A five-minute candle summarises five minutes, whereas a daily candle summarises the session defined by that chart’s data and settings.
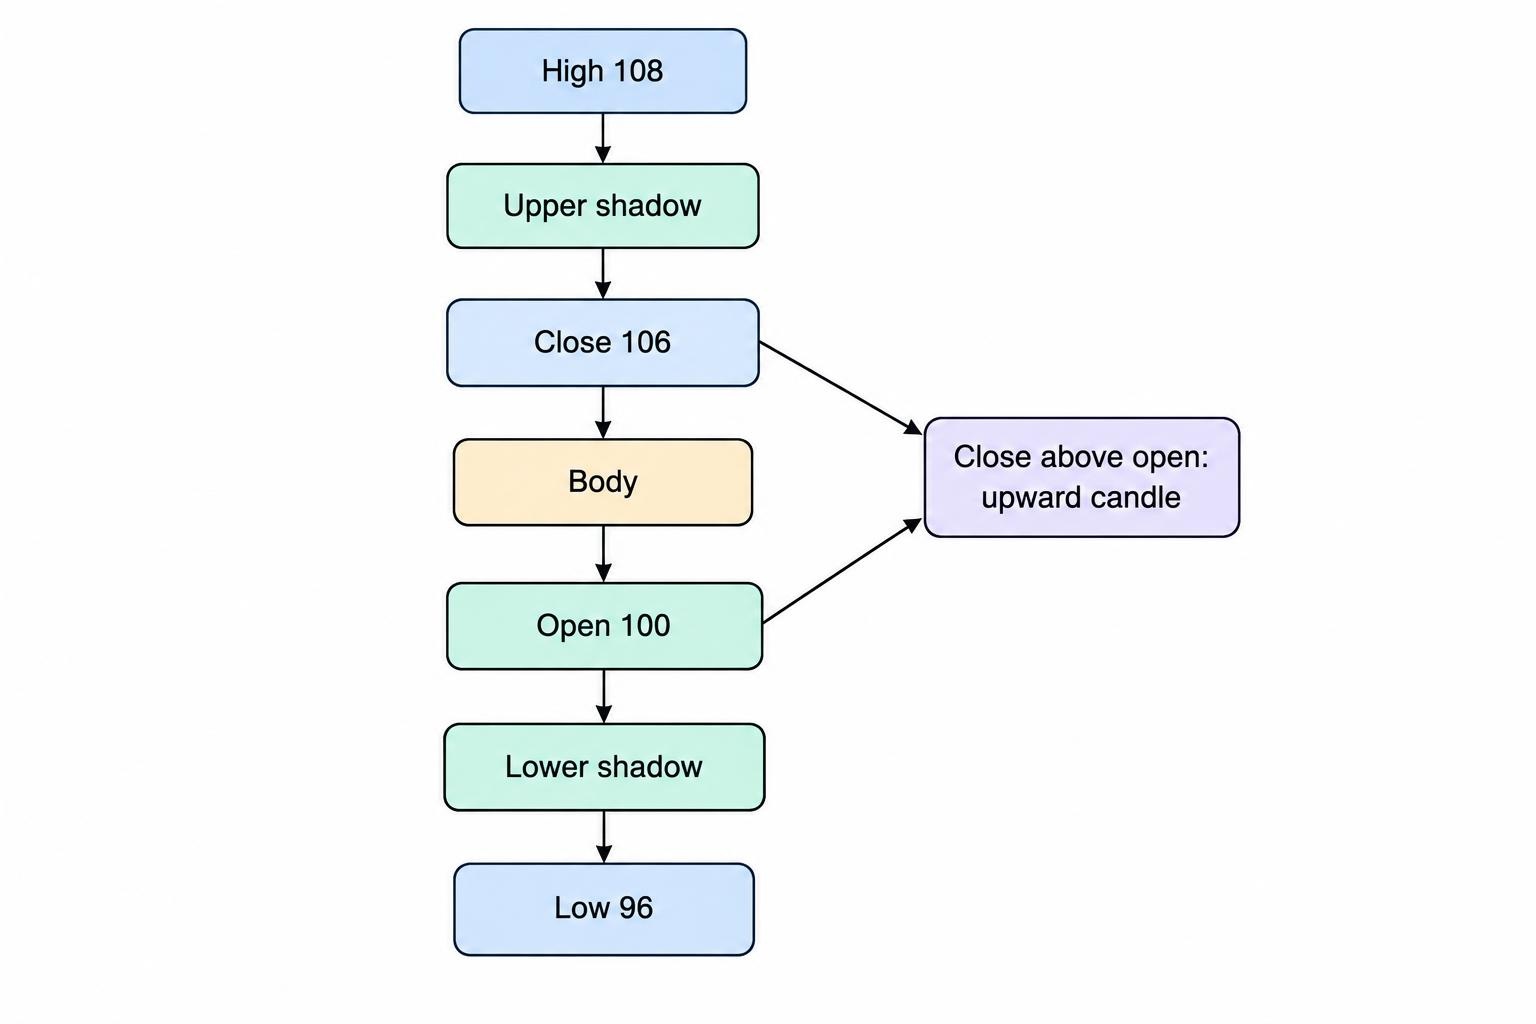
Suppose a candle opens at 100, reaches 108, falls as low as 96 and closes at 106. Its body is six points, its upper shadow is two and its lower shadow is four. The total range is 12 points. Although the candle closes above its own open, it can still finish below the previous candle’s close: if that earlier close was 110, the market has fallen four points between closes. This is why candle colour and the change since the previous session are different observations. Describe precisely which comparison matters to the method, rather than treating an upward-coloured candle as proof that the market has risen over every relevant reference period.
What a candle does not tell you
Four prices do not reveal the full sequence of trading within the period. The example above could have reached its high before its low, or its low before its high, with other fluctuations between them. That uncertainty matters when both a stop and target fall within the candle’s range. The same candle also does not reveal traders’ identities, motives or the complete order book. Descriptions such as “buyers rejected lower prices” are interpretations of the price record, not direct observations of every participant’s intentions. A long shadow shows that the close was away from an extreme; it does not establish why that happened or whether the next group of orders will push price in the same direction.
The data source matters as well. A cash index chart, an index futures chart and a provider’s spread betting chart may display different candles. Forex feeds and daily session cutoffs can also differ, changing whether a formation meets a pattern definition. Check whether the chart displays bid, ask, midpoint or underlying-market data. A long position closes at an executable sell price, while a short closes at an executable buy price; a candle touching a level on another price series does not guarantee that the intended order could execute there. Record the feed, timeframe and session when testing a method so that the historical setup and the live decision refer to comparable information.
Standard candles versus Heikin-Ashi
Heikin-Ashi candles use calculated values to smooth the display and should not be treated as ordinary opening, high, low and closing prices. The TradingView documentation on non-standard chart data explicitly identifies Heikin-Ashi values as synthetic. A visually attractive entry at a synthetic open or close may never have been available as an executable market price. If a method uses Heikin-Ashi to describe a trend, its execution and testing still need actual dealing prices. The distinction also affects pattern identification: an engulfing shape on transformed candles is not automatically the same setup as an engulfing pattern on standard candles. Specify the chart type before copying a template or assessing historical results.
Why context matters more than the pattern name
A reversal pattern requires a preceding movement that could reverse. A hammer-shaped candle after a decline has a different context from the same shape after an extended advance, and neither should be assessed without looking at nearby price structure. A bullish formation beneath a close resistance level might leave little room for a favourable move. A bearish formation during a strong upward trend might describe only a brief pause. Start with the broader question of what the market is doing, then decide whether the candle provides information relevant to that situation. The technical analysis guide explains how to organise price observations without turning every recognisable shape into an instruction to trade.
Context must also be defined before the outcome is known. A rule that buys a hammer near support needs to state how support is identified and how close the candle must be to it. Calling a level important only after price rebounds introduces hindsight. Likewise, a trend filter should use information available at the decision time, not a later swing high or low that has not yet been confirmed. Our guides to support and resistance and trend trading cover those decisions. A detailed pattern label cannot compensate for an undefined setup, because the undefined parts leave the trader free to reinterpret the same evidence differently after every win or loss.
Common candlestick reversal patterns
Hammer and hanging man
A hammer has a relatively small body near the top of its range, a long lower shadow and little upper shadow. It is examined as a possible bullish reversal after a decline. A similar shape following an advance is usually called a hanging man and is examined for possible weakness instead. Traders often require the lower shadow to be at least twice the body, but exact thresholds and upper-shadow allowances vary. The shape alone is therefore insufficient for a reproducible rule. Define the ratios, preceding trend and any subsequent price trigger. A hammer records recovery from a low during that period; it does not prevent the next period from breaking below that low and continuing downwards.
Shooting star and inverted hammer
A shooting star has a small body near the bottom of its range, a long upper shadow and little lower shadow, appearing after an advance. The same broad shape after a decline is commonly called an inverted hammer. The different names reflect different contexts rather than different guarantees about the next move. A long upper shadow after a rally may justify investigating a failed attempt to move higher, but a short position still needs an entry condition and a price where that interpretation fails. Definitions can also differ on whether a gap is required. Record the convention being tested, particularly when comparing exchange-traded shares with markets whose adjacent intraday candles usually open near the preceding close.
Doji and spinning tops
A doji has opening and closing prices that are equal or very close, while a spinning top has a small body with shadows on both sides. Both describe limited net movement from open to close, although the path within the candle may have been wide. Neither automatically predicts a reversal. A doji inside a quiet range may add little information, while one following a large directional move might prompt a closer examination of whether that move is pausing. Define “very close” relative to the instrument’s minimum price increment or recent range. An exact-equality requirement and a body below a chosen percentage of the candle’s range identify different sets of observations and can produce different trading results.
Bullish and bearish engulfing patterns
A conventional bullish engulfing pattern follows a decline and consists of a downward body followed by an upward body that covers the earlier body. A bearish engulfing pattern reverses that arrangement after an advance. The StockCharts bullish reversal guide distinguishes body engulfing from engulfing the entire high-to-low range. The second candle does not necessarily need to exceed both earlier wicks. That separates an engulfing pattern from an outside bar. Decide whether equality at a body boundary qualifies and whether minimum body sizes are required. A large second body can also leave a late entry far from a sensible stop, reducing the trade’s remaining reward relative to risk.
Harami and inside bars
A harami places a smaller second real body within the preceding larger body. An inside bar instead concerns the complete high-to-low range of the second bar fitting within the previous bar’s range. A pair of candles can satisfy one definition without satisfying the other. Both can be used to investigate a pause, but neither provides a directional forecast by itself. A trader might wait for a break above or below a defined reference range, with different rules for entries aligned with or against the preceding trend. Specify whether that reference is the small bar, the larger preceding bar or another price level. Otherwise, two traders naming the same pattern may actually be taking materially different trades.
Morning star and evening star
A morning star is a three-candle bullish reversal structure: a substantial downward body, a smaller middle body showing reduced net movement, and an upward third body closing well into the first body, commonly beyond its midpoint. An evening star reverses that arrangement after an advance. Classical star definitions involve separation between real bodies, and gap requirements vary between implementations. The StockCharts bearish reversal guide describes evening stars and related patterns. For nearly continuous intraday markets, a version that relaxes a gap requirement is a modified rule and should be tested as such. The full three-candle pattern cannot be known before the third candle has formed and met its required conditions.
| Pattern or structure | Main identifying feature | Context commonly examined | Important distinction |
|---|---|---|---|
| Hammer | Small upper body with a long lower shadow | Possible reversal after a decline | Similar shape after an advance is a hanging man |
| Shooting star | Small lower body with a long upper shadow | Possible reversal after an advance | Similar shape after a decline is an inverted hammer |
| Doji | Open and close are very close | Pause or possible transition | Does not choose direction by itself |
| Engulfing | Second body covers the previous body | Possible reversal after a directional move | Body coverage does not require wick coverage |
| Harami | Smaller body within the previous body | Possible pause or reversal | Differs from a full-range inside bar |
| Morning or evening star | Three-candle transition with a strong third body | Possible reversal | Gap and confirmation definitions must be specified |
| Inside bar | Second high-to-low range lies within the first | Contraction before a possible break | Direction depends on the subsequent entry rule |
Candlestick continuation patterns
Continuation patterns describe a pause that traders investigate for a resumption of the preceding move. Rising three methods conventionally starts with a long upward candle, followed by three smaller pullback candles contained within its range, then a strong upward candle closing beyond the first candle’s close. Falling three methods reverses the structure. The TradingView rising three methods documentation sets out its five-candle implementation. Exact containment and colour rules should be recorded because versions differ. Waiting for the final candle can also produce a more expensive long entry or a lower short entry. A completed continuation pattern still needs enough room to the target to justify the required stop distance and trading costs.
A long-bodied candle with very small shadows can also describe a strong directional period. A strict marubozu has no shadows, while looser implementations permit small ones. It shows a close near one end of the period’s range, but does not establish that price moved smoothly or that a continuation will follow. After a prolonged move, entering at the end of such a candle may mean committing after much of the opportunity has already passed. Compare the candle’s size with surrounding bars or ATR, then assess the actual entry and exit distances. Large bodies are information about completed movement, not a promise of an equally large movement in the next period.
Turning pattern recognition into trading rules
A reproducible method needs measurable definitions. An illustrative hammer rule might require a body no larger than one-third of the full range, a lower shadow at least twice the body and an upper shadow no larger than half the body. It would also need a defined preceding decline, a location condition and a minimum range to exclude trivial candles. These thresholds are examples for constructing a test, not recommended optimal settings. Rules must handle a zero body or zero range without dividing by zero. Automated pattern labels may use different thresholds or trend filters, so inspect their logic rather than assuming that every platform’s “hammer” identifies the same historical or live candles.
Entry timing is a separate choice. A trader might enter after the pattern closes, wait for a break of its high or low, or place a limit order seeking a retracement. Each choice changes the possible entry, stop distance, missed-trade frequency and execution risk. A confirmation rule can remove some failed signals while delaying successful entries; it does not improve every trade automatically. Specify when an unfilled setup expires and what happens if price moves too far before entry. A market order seeks immediate execution at an available price, while a limit order can remain unfilled. A chart pattern cannot resolve that trade-off without the rest of the method being defined.
Practical example: buying an index after a hammer
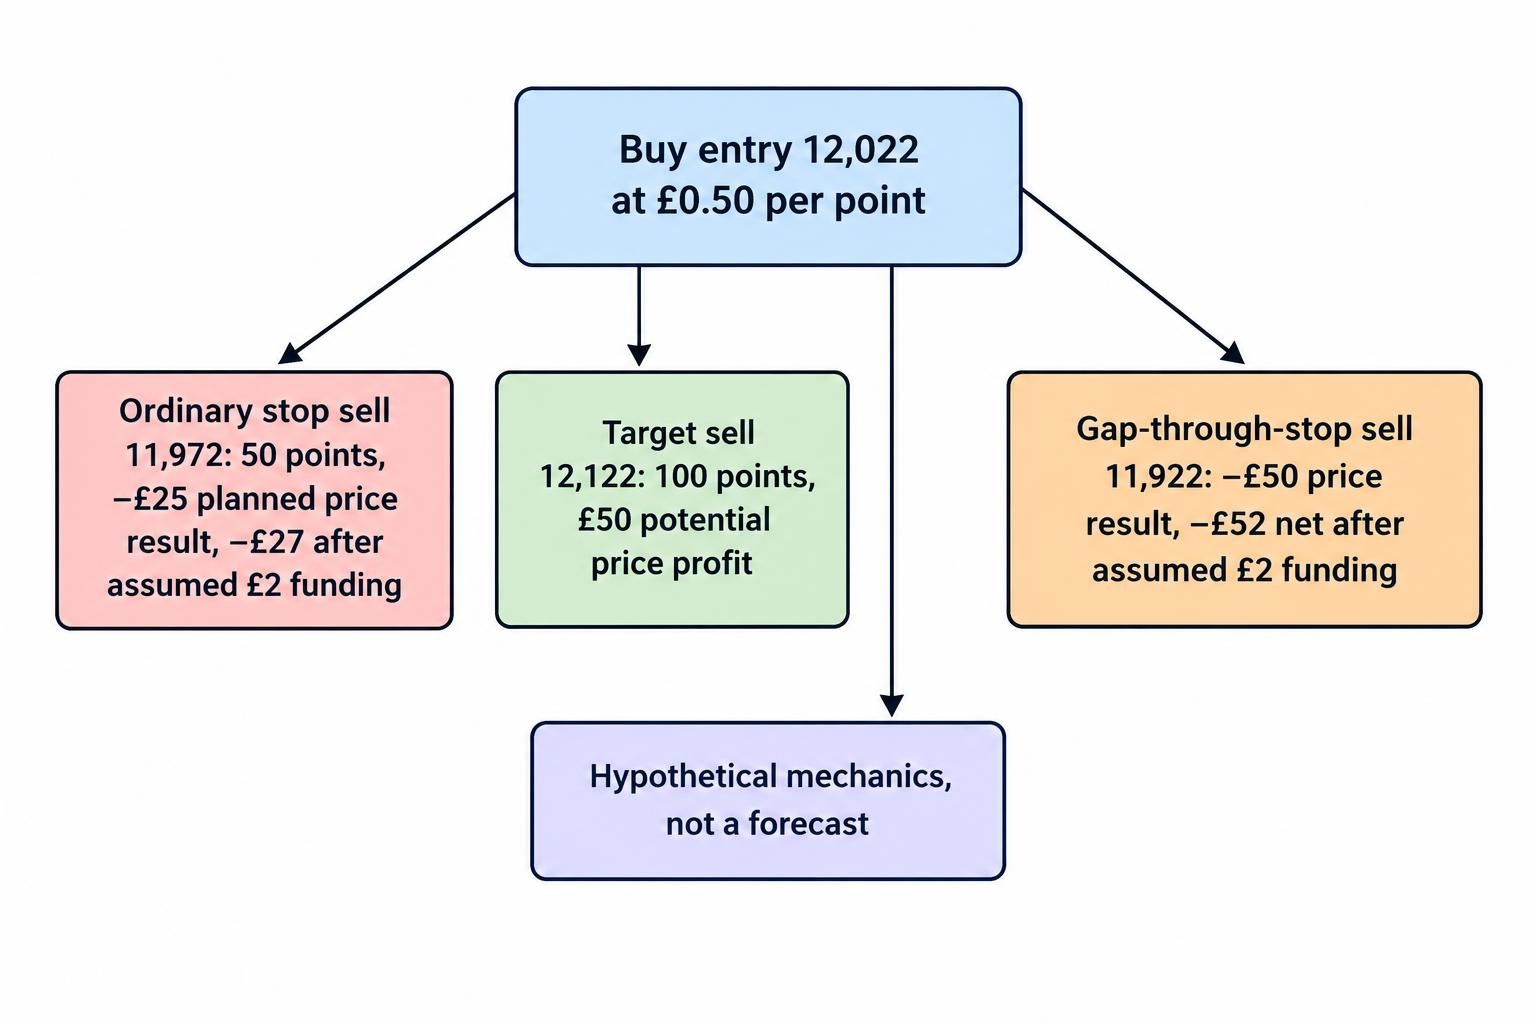
Assume a hypothetical index has declined towards previously identified support around 11,980–11,990. On a bid-price chart, a completed hourly candle opens at 12,008, reaches 12,014, falls to 11,982 and closes at 12,012. Its four-point body, 26-point lower shadow and two-point upper shadow meet the illustrative hammer proportions above. A separate entry rule waits for price to break the candle’s high. The available quote then becomes 12,020 to sell and 12,022 to buy. A trader buys at 12,022 for £0.50 per point, with an ordinary stop at 11,972 and a fixed target sell price of 12,122. The price-risk distance is 50 points, giving £25 of planned price risk.
The target lies 100 points above the actual entry, offering £50 of potential price profit. The dealing spread is already reflected by using a buy entry and executable sell exits; immediately closing at the unchanged sell quote of 12,020 would lose £1. Assume £2 of funding and no other separate charges. A target exit produces £48 net profit, while an earlier exit at 12,032 produces only £3 after funding. Closing at the original entry price produces a £2 net loss, and cash break-even requires a sell price of 12,026. The funding assumption is held constant in the table to isolate the effect of exit price; actual charges depend on the product and holding period.
| Outcome | Executable sell exit | Price profit or loss | Assumed funding | Net result |
|---|---|---|---|---|
| Target reached | 12,122 | £50 | £2 | £48 |
| Small favourable exit | 12,032 | £5 | £2 | £3 |
| Exit at the entry price | 12,022 | £0 | £2 | −£2 |
| Ordinary stop fills as planned | 11,972 | −£25 | £2 | −£27 |
| Gap through the stop | 11,922 | −£50 | £2 | −£52 |
An ordinary stop can fill beyond its requested level if price gaps or moves rapidly through available quotes. The final row therefore shows a £50 price loss despite a planned £25 price risk. The candle’s appearance does not protect the trade from that execution problem. Waiting longer for entry creates another issue: buying at 12,042 with the same stop and target would leave 70 points of downside distance and only 80 points of potential upside. At £0.50 per point, that becomes £35 of planned price risk against £40 of potential price profit, before funding. A better-looking confirmation can therefore accompany a less attractive financial setup, or require the stake to be reduced or the trade skipped.
Practical example: selling a bearish engulfing pattern in forex
Suppose EUR/USD has rallied towards resistance. One candle opens at 1.0940 and closes at 1.0960. The next opens at 1.0962, reaches 1.0970, falls to 1.0934 and closes at 1.0938. Its downward body covers the earlier upward body, producing a bearish engulfing structure under the stated definition. A hypothetical short-entry rule waits for a break below the second candle’s low. The quote then becomes 1.0930 to sell and 1.0932 to buy. The trader sells at 1.0930 for £0.50 per pip, where one pip equals 0.0001. A buy-side stop at 1.0980 creates a 50-pip distance and £25 of planned price risk, while a target buy price of 1.0830 offers £50 before charges.
If the target is reached and funding costs £3, the net profit is £47. An early buy-back at 1.0920 gives a ten-pip price gain worth £5 and leaves £2 after funding. A stop fill at 1.0980 produces a £28 net loss, while a gap to an executable buy price of 1.1030 produces a £53 net loss. The pattern supplies an observation about two completed candles, not a guarantee about any of these outcomes. Check whether the contract’s quoted point equals a pip or a smaller increment before setting the stake. Also verify financing terms: short positions do not automatically receive a credit, and a different holding period would change the assumed costs.
Stop placement and position sizing
A pattern’s high or low can provide a reference for an invalidation level, but an order should not be placed there mechanically without considering the underlying setup and contract. A small candle can produce a stop inside ordinary fluctuations; a large candle can imply a distance that is impractical at the minimum permitted stake. An ATR-based buffer may help describe recent range conditions, but it does not turn an ordinary stop into a guaranteed exit. The guides to stop losses and guaranteed stops explain the difference. Decide whether the relevant level is the signal candle’s extreme, the whole pattern’s extreme or a broader price structure, and test that exact choice.
Position sizing starts with the distance from the actual entry to the planned stop, rather than the candle’s body size. In the index example, a £25 price-risk budget divided by 50 points gives £0.50 per point. If the same budget must also cover the assumed £2 funding charge, £23 remains for the planned price loss, giving £0.46 per point before other costs or slippage. Contract minimums may prevent that exact stake. Follow the position sizing guide and round down where appropriate rather than increasing exposure to fit a preferred trade. Avoid enlarging the stake merely because several candles appear to tell the same story or because the last similar formation produced a profit.
Margin, leverage and correlated signals
At an entry of 12,022 and £0.50 per point, the hypothetical index trade represents approximately £6,011 of exposure. An assumed 5% initial margin requirement would require £300.55. That deposit is different from the planned £25 price loss and is not a cap on the position’s loss. The FCA’s retail CFD rules set a 5% minimum initial margin for major stock indices; other categories have different minimums, and firms can require more. Check the actual contract terms. A trade that can be opened with the available margin may still have an unsuitable stop distance, excessive exposure or insufficient account reserves for adverse movement across other positions.
The same FCA rules require account-level closeout when net equity falls below 50% of required margin, as soon as market conditions allow, and provide negative balance protection for covered retail accounts. That protection limits liability to funds in the relevant account; it does not guarantee an individual stop price or prevent deposited funds being lost. Several bullish patterns across related indices can also reflect the same market event. Treating them as independent trades understates portfolio correlation. Account closeout may occur before the individual candle-based stops are reached, so monitor total exposure, equity and margin alongside the pattern analysis rather than assessing every ticket in isolation from the rest of the account.
Costs, win rates and the difference between a reversal and a profit
A market can move in the anticipated direction after a candle pattern while the resulting trade still loses money. The favourable move may be too small, entry may arrive late, or the planned exit may occur only after price has reversed again. Spreads, slippage and funding further affect the result. The FCA’s review of CFD providers’ price and value examines costs including overnight financing. Measure results using executable buy and sell prices, adding separate charges without deducting the spread twice. A pattern study that merely counts whether price rose at some later point answers a different question from whether a defined spread betting method produced a net profit.
For a hypothetical method winning 45% of trades, with an average £40 price gain and £20 price loss, the average result before separate costs is £18 minus £11, or £7 per trade. Average additional charges of £2 reduce that to £5. If late entries reduce the average winner to £25 while losses remain unchanged, the same calculation becomes £11.25 minus £11 minus £2, or a £1.75 average loss. A quoted pattern success rate is therefore incomplete without the market, timeframe, definitions, entry, exit, costs and evaluation period. Avoid transferring an advertised win rate to a different spread betting contract or assuming that a higher hit rate compensates for occasional much larger losses.
Which traders and markets do candlestick methods suit?
Candlestick methods may suit traders who want to base decisions on explicit price observations and are willing to define those observations carefully. They can be used in day trading, swing trading and longer-term approaches, but each timeframe creates different demands. A five-minute method can require frequent attention and may produce potential moves small relative to dealing costs. A daily method produces fewer decision points but can involve funding, overnight gaps and event exposure. Larger timeframes are not automatically more profitable or safer. The choice needs to fit the trader’s availability, the intended holding period and the practical ability to place and manage the required orders consistently.
The underlying market also changes what the candles represent. Individual shares can gap after earnings, currencies react to relative policy and economic information, and commodities can move on supply disruptions or contract developments. Classical patterns involving gaps may appear differently on regular-session share charts and nearly continuous intraday forex charts. A candle shows the price response within its defined period, not the content of the next announcement. Keep a relevant event calendar and understand the instrument’s dealing hours. Candlestick analysis is a poor substitute for that knowledge, particularly for someone seeking certainty from visual shapes or assuming that a recognised pattern removes the need to tolerate and plan for losing trades.
Advantages and disadvantages of candlestick analysis
Candlesticks present opening, closing and extreme prices in a compact form, making it easier to describe the relationship between a period’s net change and its full range. A small set of defined patterns can provide consistent entry conditions within a broader strategy and help structure a trading journal. Their limitations are equally practical: definitions can be subjective, similar shapes appear frequently, and the same formation can occur in very different conditions. Candles compress the sequence of price movements and do not directly measure future demand or execution quality. The benefit comes from a clear, tested use of the information, rather than from memorising a large vocabulary of pattern names or finding a label for every chart fluctuation.
| Advantage | Limitation to assess |
|---|---|
| Shows open, close, high and low together | Does not reveal the full order of intrabar movements |
| Can make price observations easier to describe | Pattern names often conceal different numerical definitions |
| Can provide measurable entry conditions | A recognisable shape does not establish positive expectancy |
| Works across several chart timeframes | Session and feed differences can change the pattern |
| Can be combined with price structure | Extra price-based signals may repeat the same information |
Combining candles with other technical analysis
Assign each additional tool a defined role. Moving averages might describe trend, RSI or MACD might supply a momentum condition, and ATR might help assess stop distance. These tools still derive from price information, so agreement is not equivalent to independent evidence from several unrelated sources. A bullish engulfing pattern near the lower Bollinger Band can fail just as either observation can fail separately. Compare the combined method with its simpler version rather than assuming that more conditions improve every result. If volume is added, distinguish underlying exchange volume from a provider’s tick count or other activity measure before interpreting it.
How to get started with candlestick spread betting
Start with one market, one timeframe and one or two clearly defined patterns. For an educational exercise, a trader might investigate completed hammers near previously specified support, then choose one entry rule and one expiry rule for the setup. Write down the allowed candle proportions, preceding price condition, entry price limits, stop reference, target or exit rule and stake calculation before looking at results. Before funding an account, follow the FCA’s guidance on checking authorisation and relevant permissions. Provider checks address who is offering the service; they do not establish that a particular pattern is profitable or that the proposed trade’s financial consequences are appropriate for the account.
Review historical examples in sequence rather than selecting memorable reversals. Include qualifying patterns that failed, those that never triggered an entry and periods when the rules produced no trade. Then practise the same process in a demonstration account, recording the quote available after confirmation rather than assuming execution at the previous candle’s closing price. Demo practice helps with order handling and consistency but does not fully reproduce live fills or the pressure of losses. A useful journal records the pattern definition, market context, signal time, entry, stop, stake, exit, costs and deviations. That record can distinguish a valid losing trade from a calculation error or a decision to ignore the written method.
Testing candlestick patterns without hindsight
Trying many patterns, timeframes, filters and exits increases the chance of finding an attractive historical result by accident. The research paper The Probability of Backtest Overfitting examines this problem in investment strategy selection. Record the alternatives tested, evaluate chosen rules on data not used to develop them and assess different market conditions. Repeatedly adjusting the rules after consulting the evaluation sample weakens that separation. Small changes in a shadow ratio should not be treated as discoveries of a universal market law. An apparently strong result needs scrutiny if it depends on one exact threshold, a few exceptional trades or a period chosen because its charts contain particularly clear reversals.
Execution timing deserves equal attention. A candle that becomes a hammer at the close was not necessarily a hammer halfway through its formation. A morning star was not complete after its second candle, and a support level requiring later swing confirmation was not yet known earlier. If a bar reaches both the stop and target, use appropriate intrabar data or a stated conservative assumption rather than automatically selecting the winning sequence. Include spreads, funding, slippage, adjusted prices, trading interruptions and corporate actions where relevant. Examine net results, drawdowns and losing sequences alongside win rate. A recognisable pattern is useful only if the complete process remains plausible under the decisions and prices actually available at the time.
Frequently asked questions about candlestick spread betting
What is the most reliable candlestick pattern?
There is no universally most reliable candlestick pattern for financial spread betting. Reliability depends on the numerical definition, preceding market conditions, timeframe, entry method, exit, costs and the period used to evaluate results. A pattern with a high rate of small favourable moves can still perform poorly if its losses are large or its opportunities too small relative to the spread. Claims that a named formation has a fixed success percentage are not enough to assess a strategy. Look for complete rules and realistic net results rather than a ranking of shapes. The useful comparison is between methods applied consistently to the same market and execution assumptions, with evaluation beyond the data used to select them.
Should you wait for a candle to close?
If the strategy defines its signal using a completed candle, yes: acting before the close is a different rule. An apparent long lower shadow can disappear if price falls again, and a developing engulfing body can shrink before the period ends. Waiting resolves that particular uncertainty, but it can also lead to a later or worse entry and does not guarantee a winning trade. A method designed to act intrabar must explicitly define the information used, how temporary patterns are handled and how historical testing reproduces that timing. Do not test completed patterns and then assume their results apply to early entries that were made before those patterns were known to exist.
Can candlestick patterns be used without indicators?
Yes. A method can use candlesticks together with price-defined trend, support, resistance and written risk rules without adding a separate oscillator or moving average. That does not make the method automatically profitable or simpler to apply: subjective price levels and loosely defined patterns can still produce inconsistent decisions. The relevant question is whether the rules are clear, the available entry offers an acceptable relationship between potential reward and loss, and testing reflects realistic execution and costs. Indicators can supply additional measurements when they serve a useful purpose, but they cannot replace the entry, exit and sizing decisions. A complete price-based method still requires the same attention to margin, gaps and total account exposure.