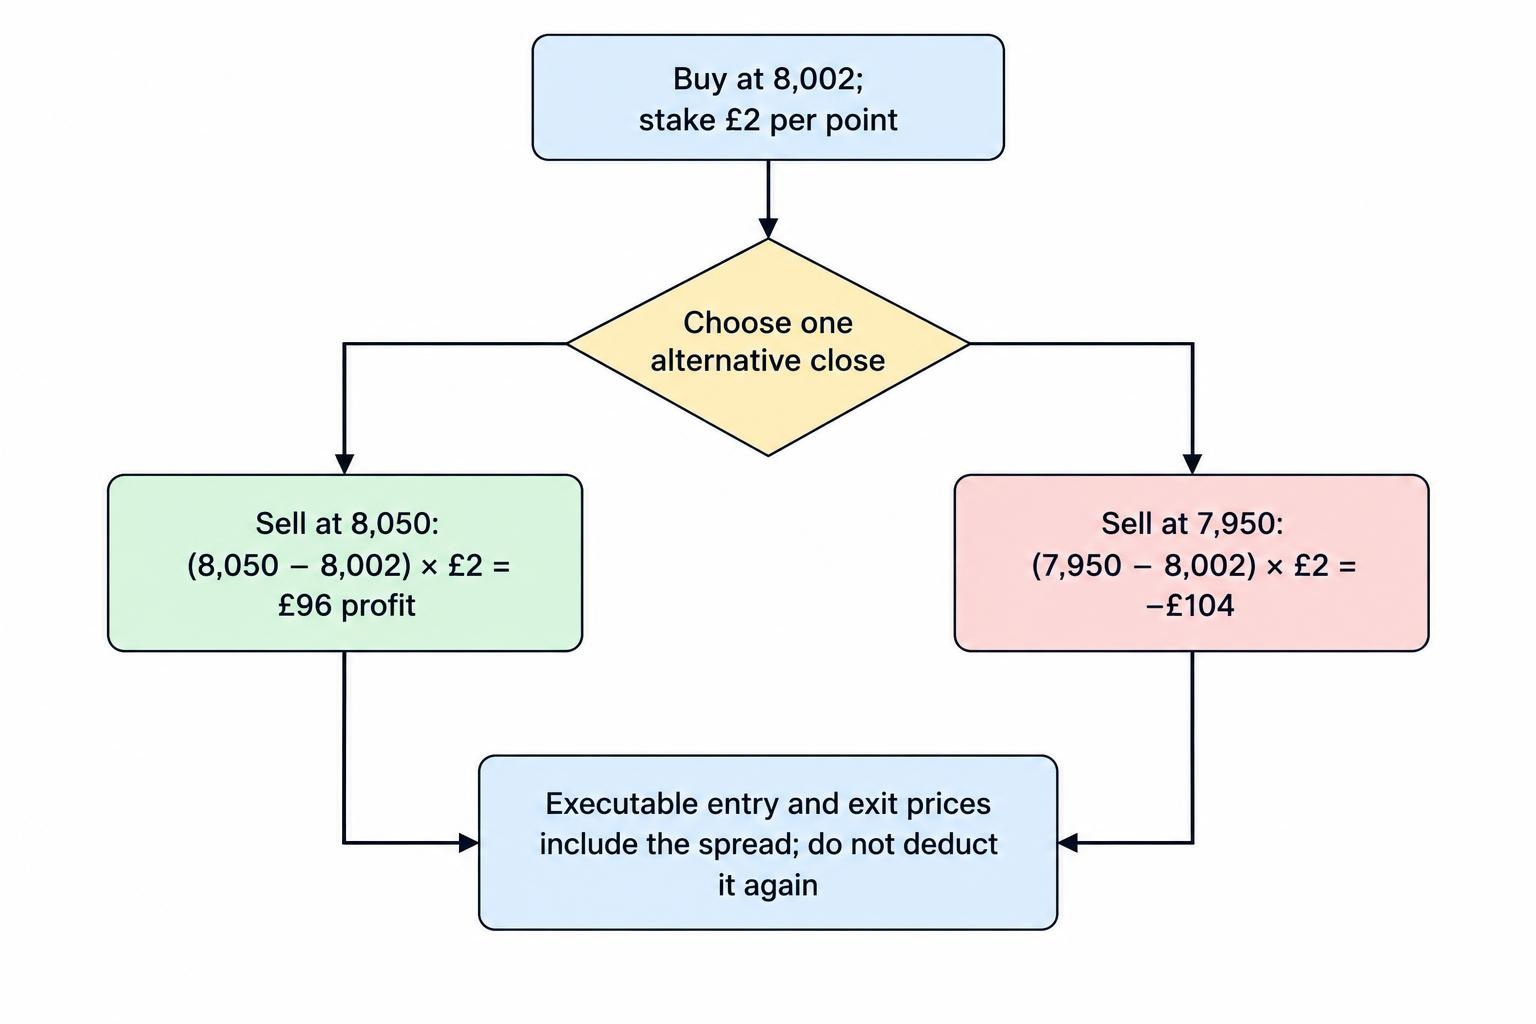
A spread betting worked example starts with three figures: your opening price, your closing price and your stake per point. Buy an index at 8,002, close at 8,050 and stake £2 per point, and your trading profit is £96 before any separate charges. Close at 7,950 instead and the same bet loses £104.
The difference between those outcomes comes from the prices you can actually trade, not just the market’s headline movement. The examples below follow a hypothetical FTSE 100 spread bet from opening to closing, including the spread, margin and a stop loss. All quotes and charges are illustrative, not live prices or a trading recommendation.
The Starting Quote and Stake
Suppose a provider quotes a FTSE 100 daily funded spread bet at 8,000 sell / 8,002 buy. You expect the market to rise, so you buy at 8,002. Your account contains £2,000, you have no other positions, and you choose a stake of £2 per point.
| Item | Illustrative figure |
|---|---|
| Opening sell price | 8,000 |
| Opening buy price | 8,002 |
| Spread | 2 points |
| Direction | Buy, also called going long |
| Stake | £2 per point |
| Starting account balance | £2,000 |
Here, one point means a full index point: a move from 8,002 to 8,003. At £2 per point, that movement changes the position’s profit or loss by £2, assuming the spread stays unchanged. A decimal movement of 0.1 points changes it by £0.20.
The stake is not the amount you pay to open the trade, nor the most you can lose. It is the cash value of each point of price movement. The stake per point guide covers how that exposure changes across different markets and quote conventions.
Buying the Index: Profit and Loss Calculations
Opening the Position
You buy at the higher price, 8,002. If you immediately close while the quote remains 8,000 / 8,002, you sell at 8,000.
Immediate trading result = (8,000 − 8,002) × £2 = −£4.
That £4 loss represents the two point spread multiplied by your stake. There is no need to subtract another £4 spread charge later: using the correct opening and closing prices already includes it.
The position needs the sell quote to reach 8,002 just to break even before separate charges. With an unchanged two point spread, that would mean a quote of 8,002 / 8,004.
If the Market Rises
Later, the quote moves to 8,050 sell / 8,052 buy. You close your existing long position by selling at 8,050.
For a buy trade, subtract the opening buy price from the closing sell price, then multiply by the stake:
Profit = (8,050 − 8,002) × £2 = 48 × £2 = £96.
Both sides of the quote have risen 50 points, but your trade captures 48 points after crossing the spread. Multiplying the headline 50 point move by £2 would overstate the profit by £4.
Assuming no separate charges, adjustments, deposits or withdrawals, your account balance rises from £2,000 to £2,096. Until you close, the £96 is an unrealised profit and can change with the quote. Closing the position makes it a realised trading result.
If the Market Falls
Now take the alternative outcome. Instead of rising, the quote falls to 7,950 sell / 7,952 buy. You close the same long position by selling at 7,950.
Result = (7,950 − 8,002) × £2 = −52 × £2 = −£104.
Your account balance falls to £1,896, before any separate charges. The loss reflects the 50 point fall in the quote plus the two point spread.
These are alternative endings to one trade, not two trades taken together. The winning outcome adds £96; the losing outcome subtracts £104. The spread accounts for the difference between their cash amounts.
How Much Margin Would This Bet Require?
The position’s approximate notional exposure, using the opening buy price, is:
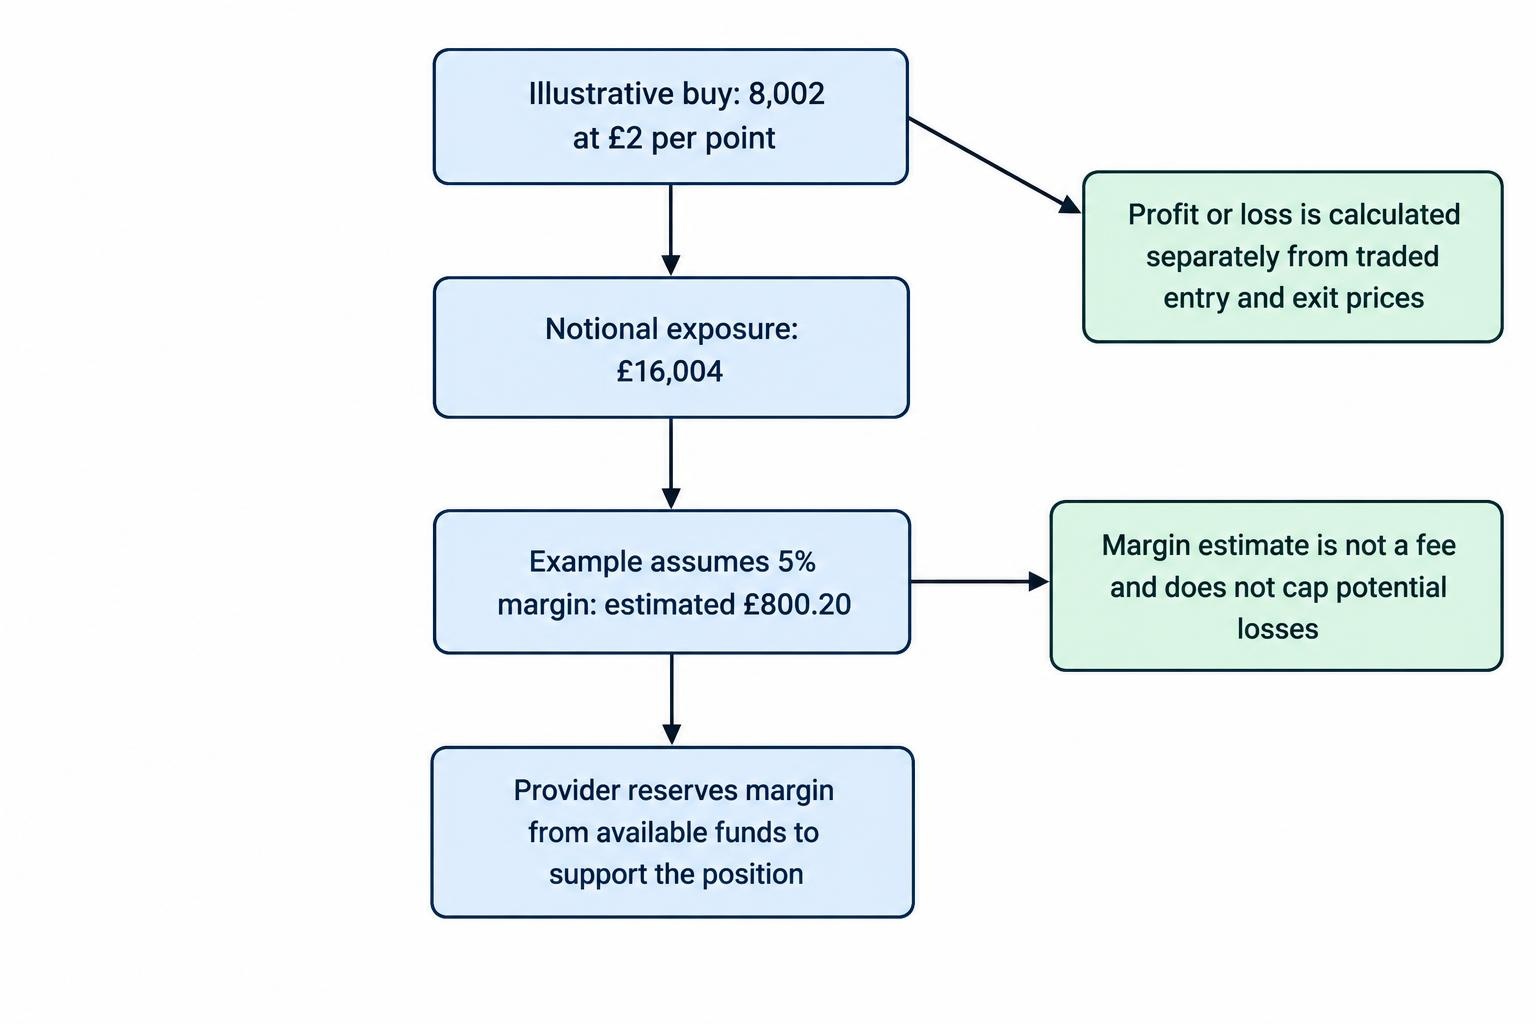
Notional exposure = 8,002 × £2 = £16,004.
For UK retail clients covered by the relevant FCA rules, the minimum opening margin for a major stock market index is 5% of exposure. Providers can require more than that minimum. The requirement appears in FCA Handbook COBS 22.5.11 on retail margin requirements.
Assuming a 5% margin rate and this valuation method:
Estimated opening margin = £16,004 × 5% = £800.20.
The provider reserves that amount from your available account funds to support the position. It is not an £800.20 fee, and closing the trade does not mean subtracting £800.20 from your trading result.
When you close, the margin tied to the position is released, subject to other account requirements. The profit or loss remains a separate calculation based on the traded prices.
Margin is also not a loss ceiling. A sufficiently adverse movement can produce losses greater than the opening margin. The trade ticket’s actual requirement may differ from this estimate because of the provider’s valuation method or margin schedule; the spread betting margin guide explains those distinctions.
Adding a Stop Loss to the Example
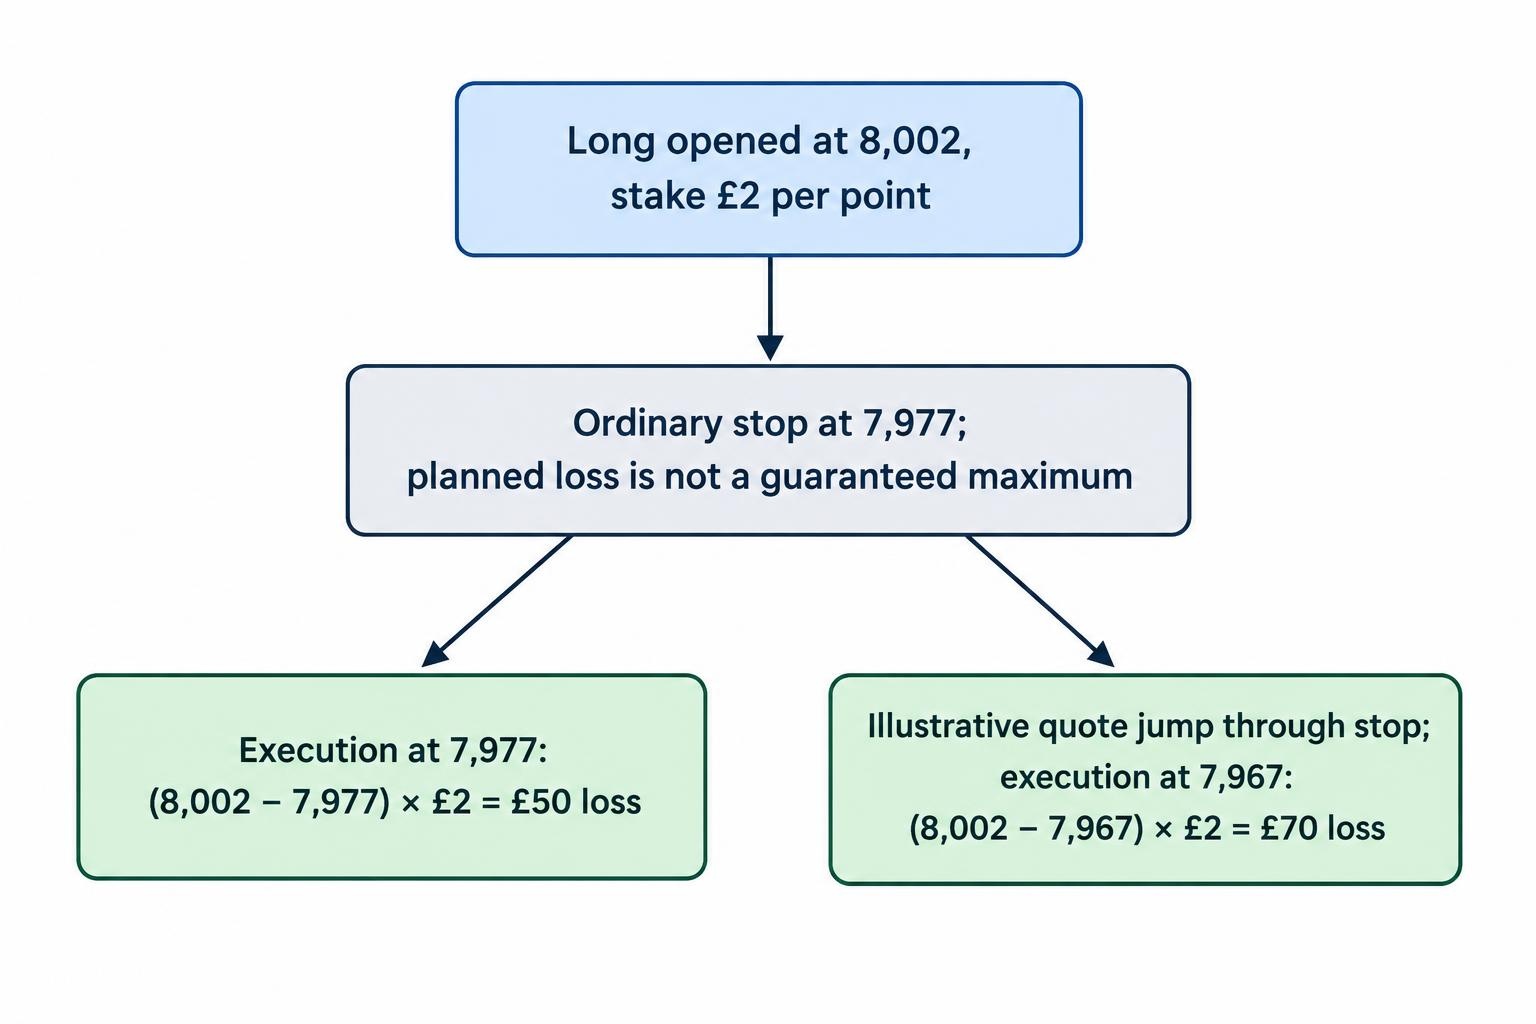
Suppose you place an ordinary stop loss at 7,977 on the long position opened at 8,002. For this example, assume the stop triggers when the provider’s sell quote reaches that level and executes there.
The distance from entry to stop is 25 points:
Planned trading loss = (8,002 − 7,977) × £2 = £50.
That equals 2.5% of the £2,000 starting balance, before separate charges. It is an illustration of the arithmetic, not a suggested risk percentage.
You can reverse the calculation when choosing a stake. A £50 planned loss budget divided by a 25 point stop distance gives a stake of £2 per point. The opening margin answers a different question: how much collateral the provider requires.
An ordinary stop does not guarantee a £50 maximum loss. If the quote jumps through the stop and execution occurs at 7,967, the result becomes:
Actual trading loss = (8,002 − 7,967) × £2 = £70.
The extra £20 comes from execution ten points beyond the intended stop level. No separate spread deduction is needed here either. The guide to stop-loss orders covers triggering and execution in more detail.
Selling the Index: A Short Spread Bet Example
If you expect a fall instead, you sell at the opening quote’s lower price, 8,000, with the same £2 stake. To close that short position, you buy at the later buy price.
Suppose the quote falls to 7,950 / 7,952. You close by buying at 7,952:
Short trade profit = (8,000 − 7,952) × £2 = £96.
If the quote rises to 8,050 / 8,052 instead, you close by buying at 8,052:
Short trade result = (8,000 − 8,052) × £2 = −£104.
The stake calculation stays the same, but the subtraction reverses. A long trade benefits when the closing sell price exceeds the opening buy price. A short trade benefits when the closing buy price falls below the opening sell price.
Use the existing position’s close function when ending the trade. The broader comparison of long and short spread bets covers direction without changing these basic calculations.
Turning the Trading Result Into a Net Result
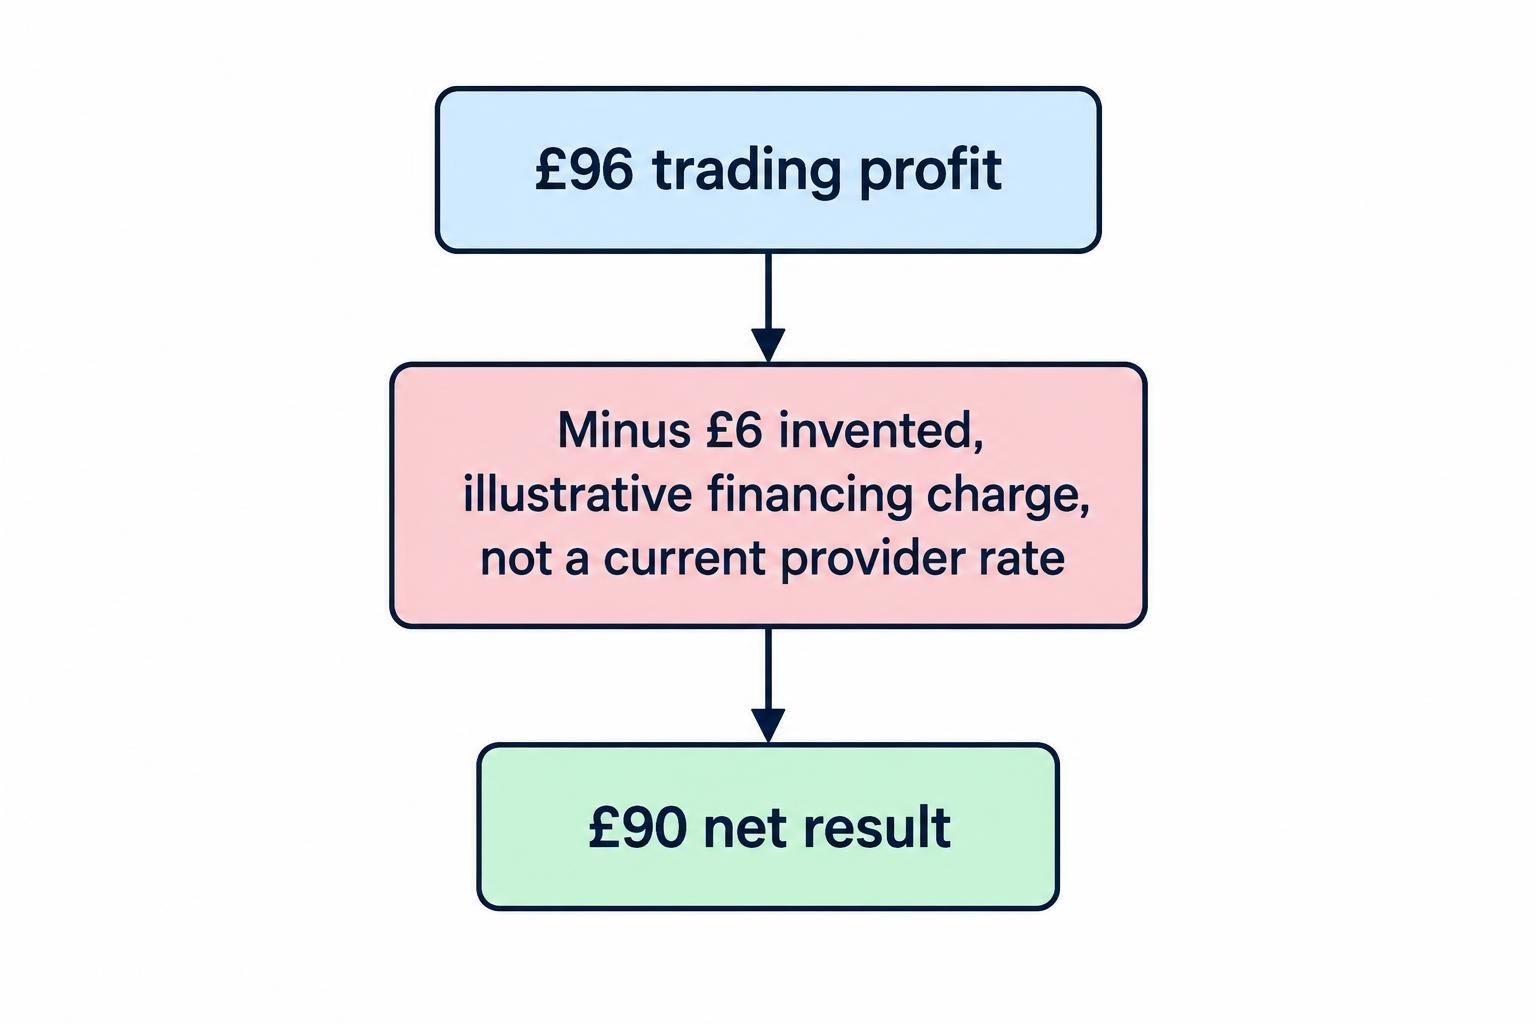
The £96 winning result includes the spread because it uses executable prices. It does not include separate financing charges or other applicable adjustments.
Take an alternative version of the winning long trade: you still buy at 8,002 and close at 8,050, but you hold it across funding cutoffs. Assume the account records £6 in total financing charges and no other adjustments.
Net result = £96 trading profit − £6 financing = £90.
The ending account balance would be £2,090. The £6 is an invented charge for this calculation, not a current rate or a claim about any provider’s pricing.
For daily funded bets, check the funding cutoff and calculation before holding the position beyond the trading session. A trade can show a profit from price movement while producing a smaller net profit after overnight financing costs. Other adjustments depend on the market and contract.
Checking Your Own Worked Example
Before comparing your calculation with the account statement, check four things:
- Direction: did you open with a buy or a sell?
- Traded prices: have you used the actual entry and exit fills rather than a chart price?
- Point value: does the price movement use the same point convention as your stake?
- Separate entries: have you included funding and adjustments without deducting the spread twice?
For a long position, calculate (closing sell price − opening buy price) × stake. For a short position, calculate (opening sell price − closing buy price) × stake. Then apply separate charges and credits to reach the net result.
If your figures still disagree with the statement, compare the execution records first. A displayed quote is not necessarily the price at which an order filled. The guide to calculating spread betting profit and loss develops the calculation beyond a single opening and closing trade.