A spread betting account can look inexpensive on the dealing screen and prove costly over a month. The spread is only the starting point. Holding time, financing, execution, contract choice and account charges determine how much of a trading return survives.
This spread betting cost study uses transparent scenario calculations to compare those effects. It does not rank brokers or present hypothetical prices as measured market averages. Its purpose is to show how different charging structures change the cost of the same exposure, and how to build a comparison that reflects the trades you actually make.
The central result is straightforward: the cheaper option changes with the holding period. In the model below, the narrower spread wins for an intraday trade, but the lower financing rate wins after two chargeable days. Neither result identifies the cheapest provider in the market.
Scope: What This Study Measures
The study examines the cash cost of opening, maintaining and closing a financial spread bet. It separates dealing costs from holding costs, then considers execution, optional protection and account overheads. Market losses remain separate: a losing position is not automatically an expensive position, just as a profitable position is not automatically cheap.
There is no original broker quote sample or execution dataset behind the calculations. Every spread, financing rate, trade count and account charge used in the worked scenarios is an explicit assumption. None should be read as a current quote, a typical industry rate or a forecast.
The main comparison uses a hypothetical index position. Keeping the market, stake and exposure unchanged makes the effect of pricing easier to isolate. Applying the results to currencies, shares or commodities requires the charging method for that particular contract, not a copy of the index calculation.
This is a combined cost analysis rather than a fee glossary. The guide to spread betting costs covers individual charges in more detail. Here, the concern is how those charges interact and which ones can change a comparison.
A separate broker spread study addresses the narrower task of comparing dealing spreads. A total cost study needs to go further: the price of entering a position says little about the cost of keeping it for several weeks.
What Published Regulatory Evidence Establishes
Cost comparisons need more than headline spreads. On 15 October 2026, the FCA published findings from a follow-up survey sent to 81 CFD firms in May 2026. Its scope expressly included spread bets and rolling spot forex. Only 12% of firms said they had changed any charges. The review also identified continuing concerns about overnight funding, opaque funding markups and charges on matched long and short positions. These are findings about pricing practices and disclosure, not a broker price ranking. The FCA findings on CFD firms’ pricing and fair value practices provide the regulatory context for examining costs beyond execution.
The formal cost categories are also broader than a spread. The FCA Handbook’s identified disclosure costs include transaction markups, commissions, foreign exchange costs and financing costs among the relevant categories. That list is not a statement that every charge applies to every spread betting account. It is a reason to check the whole charging schedule rather than assume that an absent commission means an absence of costs.
Neither publication supplies a complete dataset of executable spread betting prices. The numerical comparisons that follow therefore remain a model, supported by published evidence about which costs warrant attention.
The Model: Identical Exposure, Different Charging Structures
The comparison uses two fictional pricing profiles, A and B. They are not anonymised brokers. Profile A has the narrower spread and higher financing rate. Profile B reverses that arrangement.
| Input | Assumption |
|---|---|
| Underlying market | Hypothetical cash index |
| Reference index level | 10,000 points |
| Stake | £2 per full index point |
| Reference notional exposure | £20,000 |
| Direction | Long |
| Profile A | 1.0 point spread; 8% total annual financing debit |
| Profile B | 1.8 point spread; 6% total annual financing debit |
| Financing calculation | Constant notional, simple interest, 365 day basis |
| Other baseline costs | No commission, slippage, conversion, protection premium or account fee |
The index level is a neutral calculation base, not the current level of a named market. A point means one full index point. With a £2 stake, a one point movement changes the position’s value by £2, giving reference exposure of 10,000 × £2 = £20,000. Different quote scales require a different conversion; the stake per point explanation covers that distinction.
Both annual financing rates are complete assumed debit rates. They are not benchmark rates waiting for an extra provider markup. The model holds them constant, fixes the exposure at £20,000 and does not compound daily charges.
Actual positions can have changing valuation bases, rates and stakes. Those changes belong in a daily calculation. Freezing them here isolates the relationship between the opening and closing cost and the cost of time.
The intraday scenario crosses no funding cutoff. The other scenarios use chargeable calendar days, not a count of exchange sessions. Entry and exit spreads are identical within each profile, and the baseline assumes execution at the displayed bid or ask.
How the Study Calculates Total Cost
Count the Spread Once Across a Round Trip
A common comparison error is to charge a full spread on entry and another full spread on exit, even though the calculation already uses the difference between the opening ask and closing bid.
Take Profile A with an unchanged midpoint of 10,000. Its quote is 9,999.5 to sell and 10,000.5 to buy. A long position opens at 10,000.5 and closes at 9,999.5. The loss is one point, or £2 at the assumed stake. It is not £4.
Measured against the midpoint, the entry costs half a point and the exit costs half a point. Together they equal one full spread. This is the appropriate round trip measure when the midpoint and spread are unchanged.
If the spread changes between entry and exit, use both observations:
Round trip spread cost = stake × (entry spread ÷ 2 + exit spread ÷ 2).
With a one point entry spread, a three point exit spread and a £2 stake, the spread component is £4. The underlying midpoint could be unchanged throughout. The broader bid and ask spread guide explains the mechanics; for research purposes, the important point is to avoid counting the same price concession twice.
Add Financing on the Correct Exposure
For the hypothetical index position, the simplified holding cost is:
Financing cost = reference notional exposure × annual debit rate × chargeable days ÷ 365.
Profile A therefore incurs £20,000 × 8% ÷ 365, or approximately £4.3836 per chargeable day. Profile B incurs approximately £3.2877. Totals are calculated before rounding to pennies.
The relevant calculation base is the assumed £20,000 exposure, not the cash margin used to open it. Confusing those two amounts can understate the projected bill by a large margin. The overnight financing cost guide covers the contractual inputs that need checking before applying this simplified formula.
Where a position or rate changes, calculate each period separately and add the results. Do not multiply the final position size by the entire holding period if the stake was smaller for part of that time.
Keep Cash Costs and Price Effects Distinct
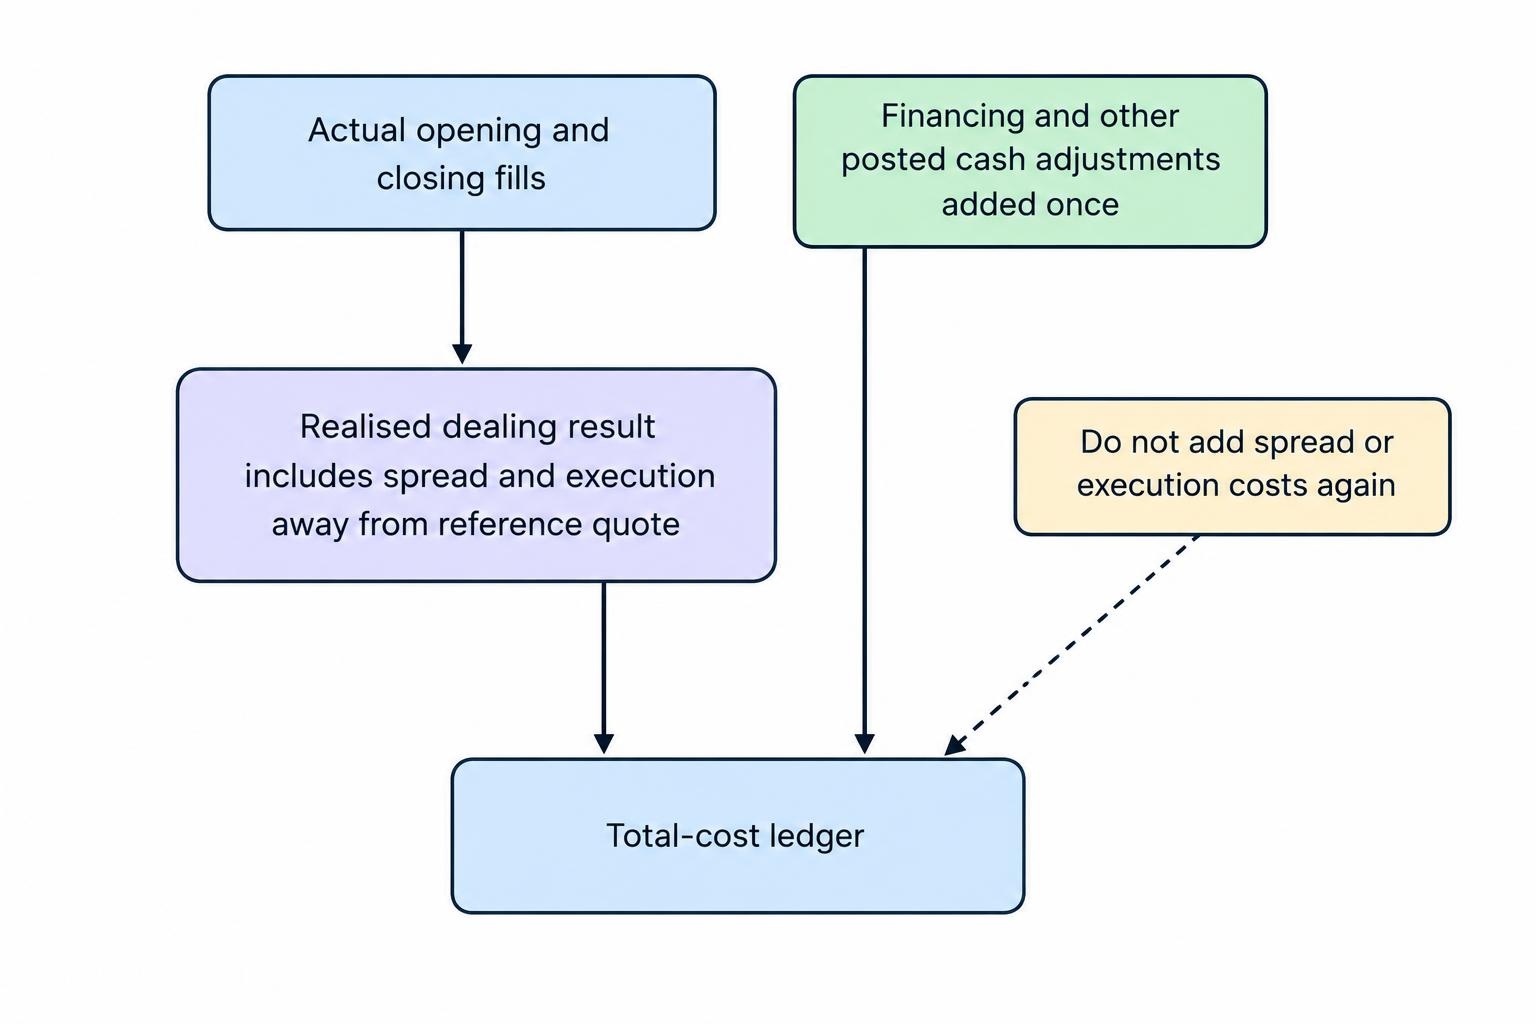
A useful total cost ledger has separate entries for the spread, execution away from the reference quote, commissions, financing, currency conversion charges, protection premiums and account overheads. Credits and rebates reduce the relevant category rather than disappearing from the record.
That ledger is an analytical tool, not a second set of charges to subtract from a broker statement. Spread and execution effects are already embedded in profit or loss calculated from actual fills. Financing and other cash adjustments may appear separately. Reconstructing costs requires care; otherwise a detailed spreadsheet can produce a very precise double count.
Dividend and corporate action adjustments also need their own treatment. A dividend credit is not automatically a discount on the spread, and a corresponding market price adjustment should not be ignored. Keep these cash flows visible when comparing economic outcomes, but do not label every debit as a provider fee.
Results: The Cheaper Profile Changes With Holding Time
The following results include the assumed round trip spread and financing only. They exclude market profit or loss and all optional or account charges.
| Holding period | Profile A: 1.0 point, 8% | Profile B: 1.8 points, 6% | Lower modelled cost |
|---|---|---|---|
| Intraday, no funding cutoff | £2.00 | £3.60 | Profile A |
| 1 chargeable day | £6.38 | £6.89 | Profile A |
| 7 chargeable days | £32.68 | £26.61 | Profile B |
| 30 chargeable days | £133.51 | £102.23 | Profile B |
| 90 chargeable days | £396.52 | £299.49 | Profile B |
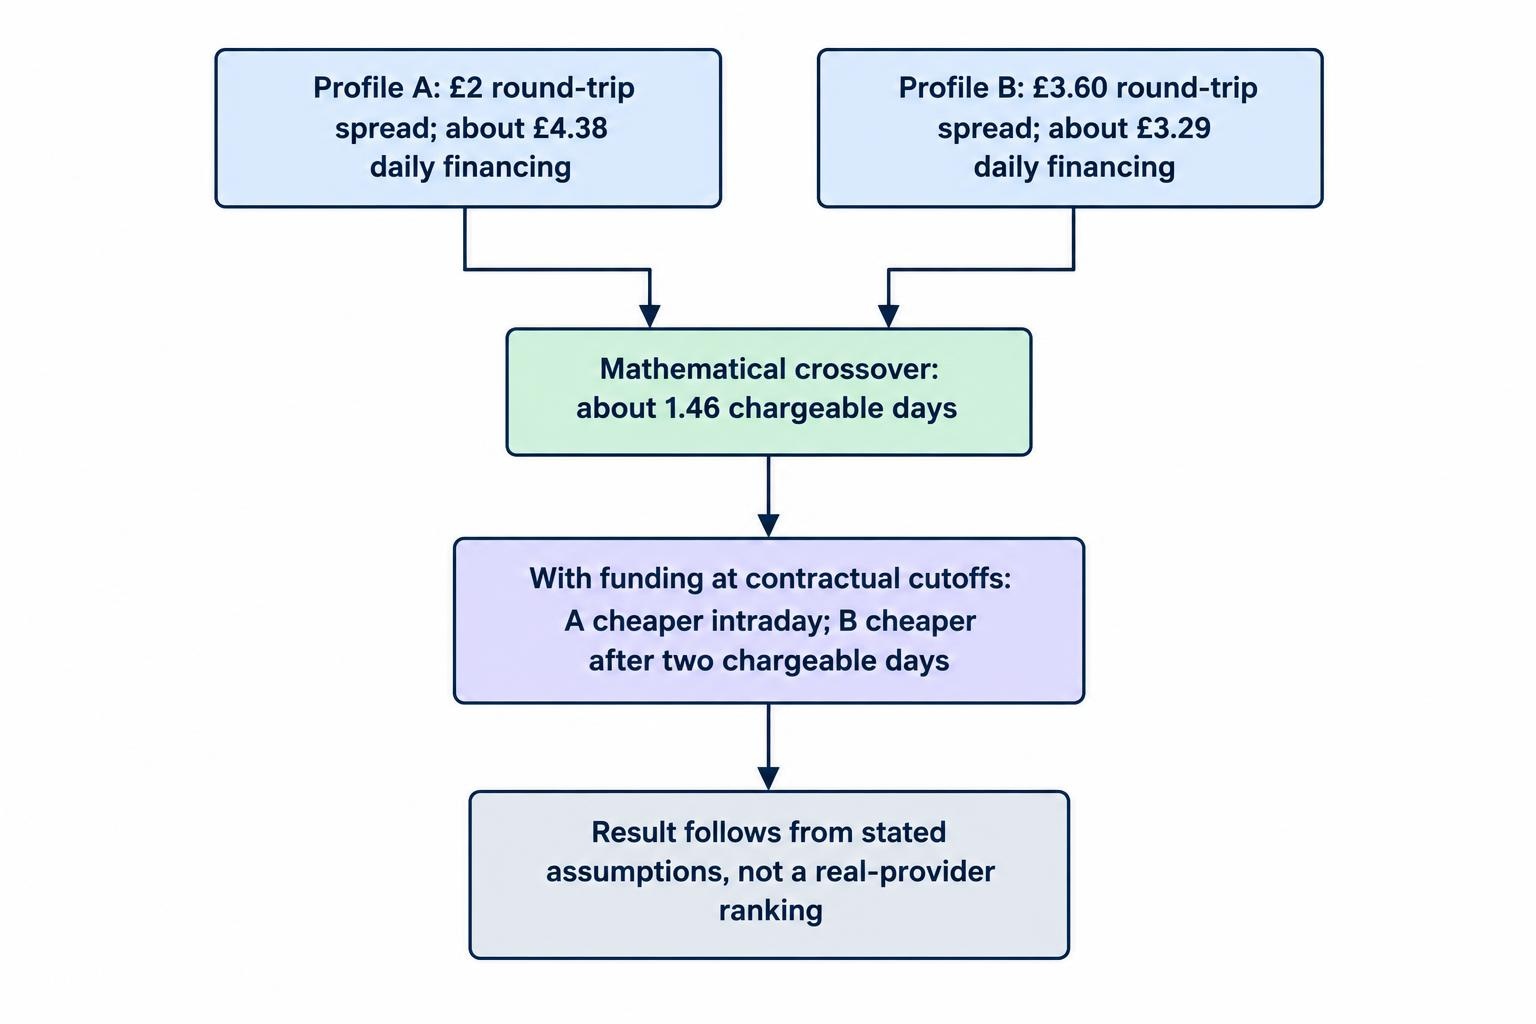
Profile A saves £1.60 on the spread. Profile B saves approximately £1.0959 in financing for each chargeable day. Dividing the upfront saving by the daily funding difference gives the crossover:
£1.60 ÷ £1.0959 ≈ 1.46 chargeable days.
Funding is applied at contractual cutoffs rather than continuously in this model, so Profile B becomes cheaper after two chargeable days. The fractional result identifies the mathematical crossover; it does not create a fractional daily charge.
At seven days, Profile B costs about £6.07 less. At 30 days, the difference reaches £31.28. At 90 days, it reaches £97.03. These are differences between the stated assumptions, not estimates of savings available from switching a real account.
Translate the Bill Back Into Points
A cash amount becomes more useful when compared with the movement a trade needs to capture. Profile A’s £133.51 cost over 30 days equals approximately 66.75 points at £2 per point. Under the frozen exposure assumptions, the midpoint must move that far in the favourable direction just to cover spread and financing.
If the hypothetical trade captures a favourable 100 point midpoint movement, the gross movement is worth £200. Deducting £133.51 leaves £66.49 before any omitted costs. A modest change in the price forecast or holding period could therefore change the net result materially.
This is why a spread comparison and a holding cost comparison can produce different answers without either calculation being wrong. They answer different questions. A combined study must define the holding period before declaring a cost winner.
Trade Frequency: Small Differences Accumulate
For a strategy that crosses no funding cutoff, transaction frequency becomes more influential. At the assumed £2 stake, 200 completed round trips would cost £400 in Profile A’s spreads and £720 in Profile B’s spreads. The £320 difference comes entirely from the 0.8 point difference in assumed width.
This does not mean that 200 trades are desirable, or that the narrower spread makes the strategy profitable. It means a recurring cost should be multiplied by the number of times the strategy actually incurs it. An inexpensive individual trade can still contribute to an expensive month.
The same principle matters in day trading with spread bets, where frequent entries and exits can make execution costs more relevant than a financing rate that the strategy rarely encounters.
Execution Can Reverse a Spread-Only Ranking
Now change one assumption. Suppose Profile A incurs an extra one point of net adverse execution across each completed round trip, while Profile B incurs an extra 0.1 point. These are hypothetical allowances, not observed execution results.
Profile A’s effective transaction cost becomes two points: its one point spread plus one point of adverse execution. At £2 per point, that is £4. Profile B’s cost becomes 1.9 points, or £3.80. The profile with the narrower displayed spread is now more expensive.
The example demonstrates why a quote survey cannot establish execution quality. A credible execution quality comparison needs its own observations, including order type, timing, requested size, reference quote and fill price.
Price improvement should reduce measured execution cost, not be discarded while adverse fills remain in the sample. Rejections and unfilled orders also deserve a separate record. Counting only completed trades can conceal the cost of a process that fails to execute when the strategy needs it.
For the combined cost calculation, keep execution away from the quoted bid or ask separate from the spread itself. Measuring the entire fill difference from the midpoint and then adding another half spread would duplicate part of the cost attributed to slippage.
Holding Costs: Rates, Dates and Direction Matter
Test More Than One Financing Rate
A single assumed annual rate is useful for a clean comparison, but it is not a durable budget. Under Profile A’s other assumptions, the 30 day total would be £84.19 at a 5% annual debit rate, £133.51 at 8%, and £182.82 at 11%.
Each one percentage point change in the total annual rate changes the 30 day funding bill on £20,000 by approximately £16.44. That calculation helps distinguish a trivial rate difference from one that could alter a trading decision.
Where a provider’s terms reference an overnight benchmark, record both the benchmark and the provider’s adjustment. SONIA measures sterling overnight wholesale borrowing rates based on actual transactions; it is not itself a retail spread betting tariff. The Bank of England’s SONIA benchmark description establishes what that benchmark represents, not what an individual account will be charged.
The practical comparison should use the complete contractual debit or credit. Two accounts referencing the same benchmark need not have the same total holding cost.
Count Chargeable Dates, Not Just Nights Away
A holding period needs a charging calendar. Record the funding cutoff, the time zone used, the dates covered by each debit and any weekend or holiday treatment. Do not assume that each line on a statement represents exactly one calendar day.
A position opened and closed within a short elapsed period could still cross a funding cutoff. A longer position might cross none if both transactions occur within the relevant charging window. The label “intraday” is not sufficient evidence that financing is zero.
The guide to holding spread bets overnight covers the operational questions. For this study, the important distinction is between elapsed time and chargeable time. A calculation based on the wrong calendar can overwhelm a small difference in spreads.
Build Separate Long and Short Calculations
Do not reverse the sign of a long financing debit and assume that it becomes the short credit. Enter the actual long and short terms separately. Include any borrowing or other holding charge that applies to the contract.
Consider a purely illustrative matched position: £20,000 long and £20,000 short on the same index. Suppose the long pays 8% annually while the short receives 2%. The net funding debit is 6% of £20,000, or approximately £3.29 per chargeable day, before dealing costs.
The directional exposures offset in this simplified example, but the charges do not. Each leg also has its own entry and exit. A position that is close to neutral in market exposure can remain costly to maintain.
Do Not Transfer the Index Formula to Every Market
The model’s index exposure calculation works because the quote scale and sterling stake are defined. A currency pair may use a different point scale and a holding adjustment based on the two currencies. A share position may require a separate borrowing cost check. A commodity contract may reference a futures month rather than a cash price.
For forex spread betting, compare the same pair, direction, point definition and funding dates. A headline annual percentage without its calculation base is not enough to compare two currency contracts.
These differences are a reason to maintain separate market groups in a cost study. Combining unrelated contracts into one average can produce a number that describes none of the trades a reader intends to place.
Daily Funded Bets and Futures Require a Different Comparison
The crossover between Profiles A and B is not a crossover between a daily funded bet and a futures based spread bet. Both profiles use the same simplified daily financing structure. Comparing different contract types requires more work.
For an equity index future, theoretical fair value reflects the cash index, financing, expected dividends and time to expiry. The actual traded price can differ from that theoretical value. The CME explanation of stock index futures fair value shows why the absence of a separate daily funding debit does not establish the absence of an economic financing effect.
Equally, the entire difference between a cash quote and a futures quote should not be labelled a provider fee. Part of that difference may reflect the underlying contract’s carry. Treating it all as a charge would make the comparison misleading in the other direction.
A fair analysis of daily funded bets versus futures should match the intended market exposure and holding period. It should then compare entry and exit spreads, cash funding adjustments, changes in the contract basis, dividend treatment and any costs of extending the position.
Expiry adds another decision. A position intended to last beyond the current contract may need to be closed and reopened, rolled or settled under the provider’s terms. Those events can create costs that are absent from a shorter holding period. The spread betting expiry date guide addresses that contract lifecycle.
For this study, there is no defensible universal statement that one contract type becomes cheaper after a fixed number of days. That threshold requires the actual cash and futures terms, the entry date, the relevant expiry and a consistent treatment of carry.
Additional Charges That Can Change the Result
Guaranteed Stop Premiums Need Two Views
A protection premium belongs in the cost model when the charging conditions are met. The first task is to establish those conditions: whether a premium applies on placement, only when triggered, or under another contractual arrangement.
Suppose a hypothetical guaranteed stop has a three point premium at the £2 stake. If charged, it costs £6. If it is payable only on a trigger, every triggered position incurs £6, while an untriggered position incurs no premium under that assumed arrangement.
For budgeting, an assumed 10% trigger frequency would create an expected premium of 60p per position. That is a scenario input, not an observed probability. It should be tested against other trigger frequencies rather than presented as an estimate supported by trading records.
The guaranteed stop premium guide covers how to translate point premiums into cash. A cost study should show both the charge on an individual triggered trade and the assumed average across a series.
A lower average charge is not enough to judge the protection’s value. Protection against an adverse gap changes the distribution of losses, not just the average fee. Comparing it with an ordinary stop requires a separate assessment of the risks addressed by guaranteed stop risk controls.
Currency Conversion Depends on What Is Converted
A market quoted in dollars does not, by itself, establish that the account converts the position’s full notional value. Check the contract’s settlement currency, the account currency and the cash flows to which any conversion charge applies.
For a hypothetical example, suppose a $500 realised profit has a £400 value before a 0.5% conversion charge. The fee is £2 if it applies to that converted profit. Applying 0.5% to a much larger position notional would answer a different question and overstate that assumed charge.
A sterling settled stake may have different conversion requirements from a contract with cash adjustments in another currency. The currency conversion cost guide covers the distinctions to check. The research record should state both the rate and the amount to which it was applied.
Fixed Account Charges Need Honest Allocation
Suppose an account has an assumed £20 monthly charge. Allocating it over five completed round trips produces £4 per trade. Across 50 round trips, it is 40p per trade; across 200, it is 10p.
Those allocations describe the same £20 bill. They do not make the bill smaller. Trading more to dilute a fixed fee usually adds transaction costs, so the per trade figure must not become an incentive to manufacture activity.
Record whether a charge is unconditional, avoidable, activity dependent or payable only after a threshold. The conditions for account inactivity fees should be checked separately from any market data subscription or platform charge.
If several strategies share the account, document how the overhead is allocated. Equal allocation, trade count allocation and exposure based allocation can produce different strategy results. There is no need to disguise that choice as an objective market price.
Measure Costs Against Exposure, Capital and Expected Return
A cost percentage is incomplete without its denominator. Profile A’s 30 day bill of £133.51 represents approximately 0.668% of the £20,000 reference exposure. Against a £5,000 account balance, it represents about 2.67%.
If the illustrative position required £1,000 of initial margin, the same bill would equal about 13.35% of that margin. None of these percentages changes the cash charge. They describe different aspects of its burden.
Margin is not the maximum possible loss on the position. A comparison that emphasises the cost as a small percentage of exposure can conceal its effect on account capital, while a margin percentage can look alarming without showing the stake behind it. The guide to exposure and leverage risk addresses why the cash committed and the market exposure must remain distinct.
Test Whether Costs Consume the Strategy’s Edge
Consider a hypothetical strategy with a 55% win rate, an average gross winner of 12 points and an average gross loser of 10 points. Its expected gross result is:
(55% × 12) − (45% × 10) = 2.1 points per trade.
At a total cost of 1.5 points per completed trade, the expected net result is 0.6 points. At a cost of 2.5 points, it becomes a loss of 0.4 points. The signals, gross winners and gross losers have not changed. Only the cost assumption has.
With the same gross payoff assumptions, a 1.5 point cost requires a win rate above approximately 52.27% to break even. A 2.5 point cost raises that threshold to approximately 56.82%. These are mathematical thresholds within the example, not forecasts of achievable performance.
Holding costs also change the net payoff of trades with different durations. A gross target and stop distance alone do not establish the final risk and reward ratio if winning and losing positions carry different accumulated costs.
For a backtest, add costs at the trade level wherever possible. Subtracting one average annual percentage from the final return can miss the interaction between turnover, exposure and holding time.
How to Build a Reproducible Cost Study
A credible broker comparison needs a record another person could follow. That means retaining the inputs, documenting exclusions and distinguishing published terms from observed prices. A polished table without that record is not much use when a result is challenged.
Define the Trade Before Collecting Prices
Start with the question the study is meant to answer. A comparison for a £1 per point intraday index strategy is not interchangeable with one for a month long share position. Set the market, contract type, direction, stake, account currency and holding assumptions before collecting any observations.
Use the same client category and relevant account terms across providers. Record the legal entity and contract identifier so that a familiar brand name does not stand in for the actual account arrangement.
Specify the intended order type as well. A market order, a resting limit and a triggered stop can create different execution samples. Mixing them may be appropriate for a real strategy, but the study should disclose the mixture.
Retain an Input Record
| Field | What to retain |
|---|---|
| Contract and account | Market, contract identifier, client category, currency and relevant terms |
| Observation time | Date, time, time zone and market session |
| Quote | Bid, ask, quote scale and intended stake |
| Execution | Order type, reference quote, fill price, size and any rejection or non-fill |
| Funding | Debit or credit, calculation base, rate, cutoff and dates covered |
| Other charges | Premiums, conversion, borrowing and allocated account fees where applicable |
| Evidence | Effective fee document, captured quote, trade confirmation or statement entry |
| Classification | Observed amount, published tariff input or modelling assumption |
That final classification matters. A published minimum spread is a tariff statement, not an observation of the spread available for a planned order. An assumed slippage allowance is a model input, not a fill record. Keeping them separate prevents a mixed dataset from acquiring more authority than it deserves.
Match Timing and Weighting to the Strategy
Collect comparable quotes at comparable times. If one provider is observed during an active market session and another during a quiet period, the difference may reflect timing rather than pricing. Where observations cannot be simultaneous, record the gap and avoid overstating the comparison.
Weight the sample by intended activity. A strategy that trades most often around an opening period should not be represented mainly by midday observations. Conversely, a trader who never uses out of hours markets gains little from an average dominated by those periods.
Report the distribution, not just the lowest quote. Useful summaries can include the median, the average and a measure of the more expensive observations. Explain whether those summaries are weighted by time, trade count, stake or another exposure measure.
Do not invent statistical confidence from a small convenience sample. If the observations cover only a few sessions, describe those sessions. If event periods are excluded, disclose the exclusion rather than implying that the findings describe them.
Distinguish an Estimate From a Stress Test
A central estimate should represent the trade being evaluated. A stress scenario asks what happens if inputs become less favourable. They serve different purposes and should appear under different labels.
For a published EU disclosure benchmark, the ESMA answer on expected costs and charges estimates, dated 29 May 2019, treats the expected cash and percentage charge as the firm’s best estimate rather than a range or maximum. For this analytical model, the corresponding discipline is to state a clear baseline, then show sensitivities without pretending they are observed prices.
Stress the variables that matter to the strategy: a wider exit spread, a higher funding rate, a longer holding period or worse execution. Changing every input at once can show a severe outcome, but it will not identify which input caused the deterioration.
Reconcile the Model With Actual Cash Entries
For a completed long trade, actual dealing profit or loss is the closing fill minus the opening fill, multiplied by the stake. The spread and any execution away from the reference quote are already inside that result. Add separately posted cash adjustments only once.
At account level, reconcile opening cash, deposits, withdrawals, realised dealing results and cash adjustments to closing cash. If positions remain open, account equity also includes their unrealised value and should not be confused with cash.
The guide to reading spread betting account statements is useful for separating deal results from financing and other adjustments. A cost study should explain whether its totals are reconstructed estimates, statement debits or both.
Investigate mismatches rather than rounding them away. A discrepancy may reflect a different charging date, a changed exposure base, an omitted credit or a charge already embedded in another line. Resolving it improves the model more than adding another decimal place.
Limits of the Results
The study establishes relationships between costs under stated assumptions. It does not establish market averages, current broker tariffs or execution performance. There is no sample from which to infer that either fictional profile is common.
The constant £20,000 funding base makes the comparison easy to reproduce, but a real index position can change in value. Rates, stakes and charging conventions can also change during a holding period. A daily ledger is more suitable for checking an actual account.
The baseline excludes commissions, conversion, protection premiums, borrowing charges and fixed overheads. These exclusions are deliberate, not claims that such charges never apply. Adding an applicable cost could change the result, especially when the baseline difference is small.
It also excludes the economic value of service features. A cheaper tariff does not by itself establish that a platform, order process or protection arrangement is suitable for a particular strategy. Costs should be compared alongside the features the trader will use, without assigning invented monetary benefits to them.
Account loss percentages cannot fill the gaps in this cost dataset. They combine trading outcomes and costs across accounts with different behaviour and exposures. The separate research on retail client loss rates addresses that measure; it should not be used as a substitute for transaction level pricing evidence.
Finally, the model does not assess personal tax treatment. Its outputs are trading costs before any tax consequences. A cost difference and a tax difference are separate calculations.
Using the Study for an Account Comparison
Begin with a representative trade, not a broker’s cheapest advertised market. Use the contract, stake, direction and holding period your strategy calls for. Calculate the round trip spread, add the relevant holding adjustments and include only the other charges that apply.
Then repeat the calculation under less favourable assumptions. If a small change in holding time or execution reverses the ranking, the result is fragile. Present it as such rather than awarding a universal “cheapest” label.
The total spread betting cost comparison framework can turn those inputs into a practical account assessment. Keep separate results for short holding periods, longer positions and any markets with different charging methods.
In this model, Profile A’s narrower spread saves money on the intraday trade, while Profile B’s lower financing rate wins from two chargeable days onward. That is the useful finding: price depends on how the position is used. The lowest spread is a starting point for research, not the finished answer.