Trend trading with financial spread betting means taking positions in the direction of an identified market trend and managing them according to rules for continuation, failure and exit. A trader might buy an index that is making higher highs and higher lows, or sell a currency pair that is making lower highs and lower lows. The aim is to capture part of a sustained move without needing to predict its exact beginning or end. That sounds straightforward until price starts moving against the position: an ordinary pullback and the beginning of a reversal can look remarkably similar. This guide explains the mechanics, suitability, advantages, disadvantages and practical decisions involved. All trade examples are hypothetical, with costs and assumptions stated, rather than illustrations of promised returns.
What is trend trading in financial spread betting?
A trend describes a directional pattern over a chosen observation period. In an uptrend, buyers have repeatedly pushed price towards higher levels; in a downtrend, the sequence has moved lower. Trend trading seeks to participate while that behaviour continues. It does not require a belief that the market is cheap or expensive, although fundamental analysis may help explain the move. Some traders use discretionary judgements about price structure, while others apply fixed rules based on moving averages or price channels. Both approaches need a clear definition of what would invalidate the trade. Within financial spread betting strategies, trend trading describes the logic behind a position, rather than prescribing one market, one indicator or one holding period.
Spread betting supplies the contract through which the trader expresses that view. Buying creates exposure to rising prices; selling creates exposure to falling prices. Profit or loss depends on the difference between the actual opening and closing prices multiplied by the stake per point, with financing and other applicable adjustments included. The trader does not acquire ownership of the underlying asset. The FCA includes spread betting within its supervision of contracts for difference and related products, which it identifies as high risk and unsuitable for some retail consumers. A clear trend on a chart does not remove that risk. The position can lose money through a reversal, excessive sizing, poor execution or costs that exceed the movement captured.
Trend trading versus day trading, swing trading and momentum
Trend trading can be used within day trading, swing trading or position trading. A day trader might follow a morning decline and close before the session ends. A swing trader might hold a rising index for several days, while a position trader might remain involved for weeks or months. These are different holding arrangements built around similar directional reasoning. The trend must be defined on the timeframe actually being traded: an hourly decline can occur inside a weekly uptrend. Switching to a longer chart after a short-term trade starts losing changes the original premise. A planned intraday exit should not disappear simply because a monthly chart offers a more comforting picture.
Momentum trading overlaps with trend trading, but the terms are not interchangeable. Momentum methods may focus on the speed of recent price changes, a burst of buying or selling, or the relative strength of one market against others. A trend method may remain invested through a slower continuation even after the initial acceleration fades. Breakout trading is another overlap: a breakout can provide an entry into a trend, but many breakouts fail to develop into sustained moves. These distinctions matter when writing rules. Buying the strongest recent performer, buying a pullback in an established trend and buying a new price high can create different entries, losing sequences and holding costs, even when all three are described casually as following the trend.
How to identify a trend without relying on hindsight
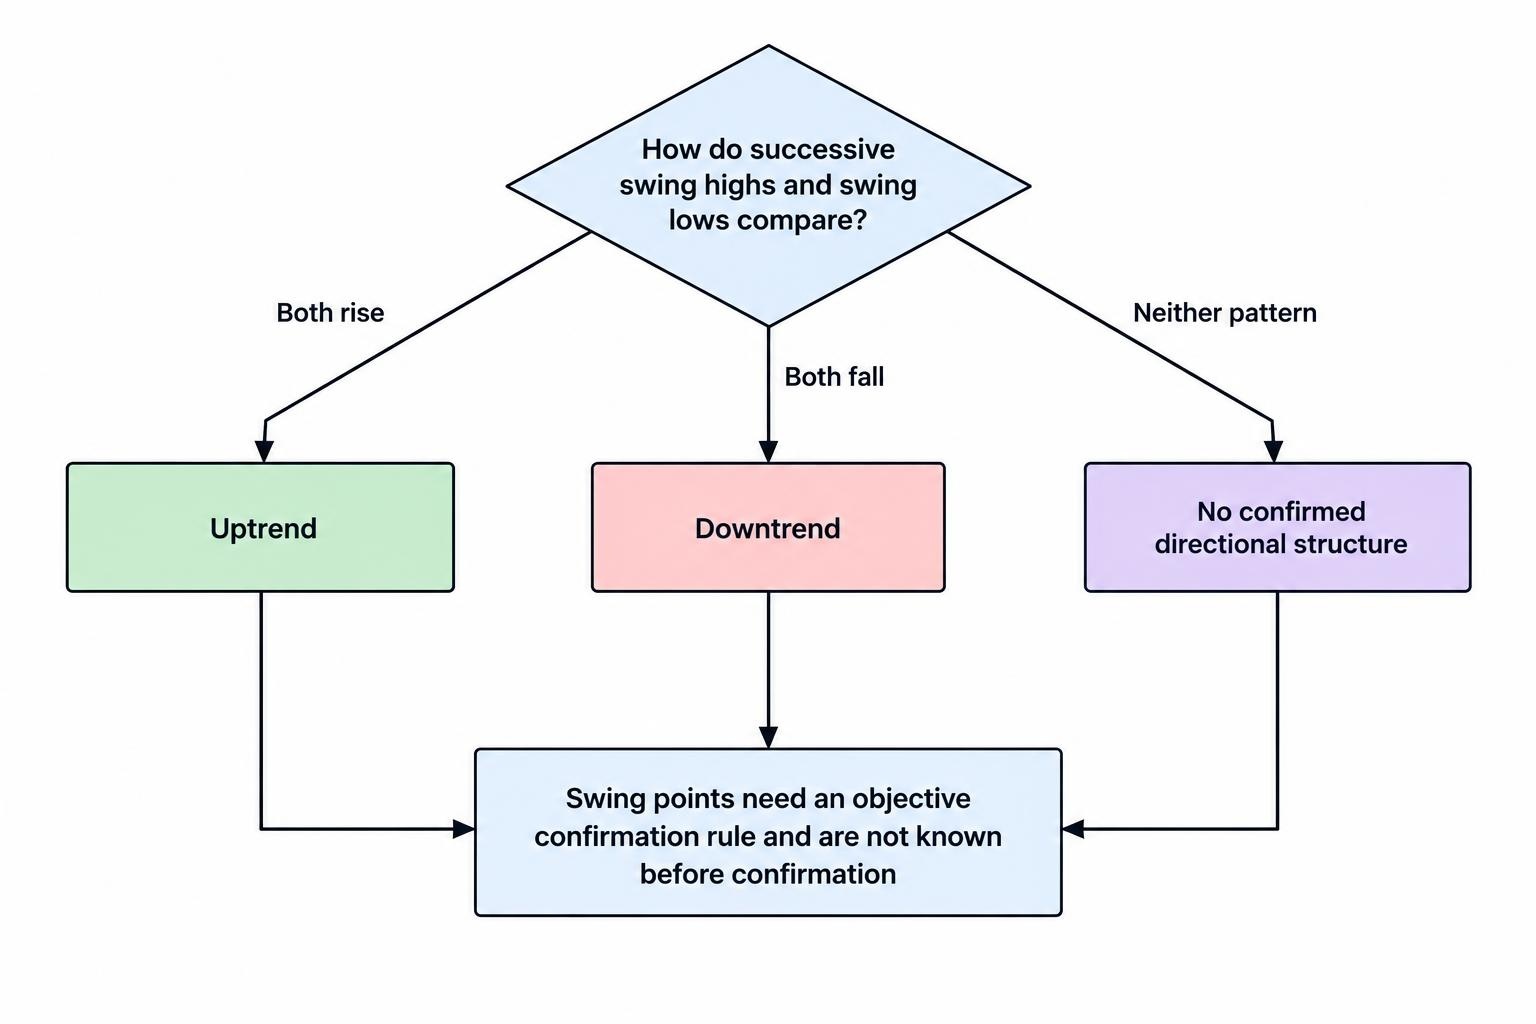
Price structure provides one starting point. An uptrend might require successive higher swing highs and higher swing lows, while a downtrend requires the reverse. The difficulty is defining which swings count and when they become recognisable. A low marked neatly on a completed chart may only have been confirmed several candles later. A test that enters at that low using information unavailable at the time exaggerates what the trader could have achieved. Specify whether a swing requires a certain number of subsequent candles, a minimum price movement or another objective condition. Support and resistance can then provide context for entries and exits, but these levels remain areas of interest rather than barriers that price is obliged to respect.
Moving averages and price channels offer alternative definitions. A trader could require price to close above a rising moving average, or above the highest price recorded during a stated number of previous sessions. The period selected changes how quickly the method reacts and how often it changes direction. A short lookback responds sooner but can generate repeated signals in a range; a longer one reacts more slowly and may surrender more profit before an exit. When using a closing-price signal, the entry assumption must reflect when that close becomes known. A practical test might use the next available quote. It should not assume that the trader observes a completed candle and then trades retrospectively at an earlier price within it.
Who might trend trading suit?
Trend trading may suit someone who can follow a repeatable process, tolerate uncertainty and allow an open position to fluctuate without continually rewriting the plan. Longer timeframes can reduce the need for constant screen attention, although they still require scheduled reviews, event awareness and suitable protective orders. The psychological challenge is often patience: some methods experience repeated small losses before encountering a move large enough to compensate. The trader also needs to accept that an exit may occur well below the highest unrealised profit. Someone who can evaluate a series of trades rather than demand that every trade succeeds may find this structure understandable. That does not establish profitability, and a method must still be tested with the costs and execution of the intended contract.
The approach may be a poor fit for someone who needs regular withdrawals, dislikes open profit moving backwards or tends to increase exposure after losses. Longer holding periods can also create practical problems for traders who cannot monitor scheduled announcements or maintain sufficient account funds. Beginners sometimes find trend analysis easier to understand than very short-term trading, but a readable chart is not the same as an easy decision. It remains necessary to distinguish position risk, margin, financing and price risk outside normal trading hours. A slower approach provides more time to think; it does not guarantee better judgement. The useful question is whether the trader can apply the rules consistently while accepting the method’s likely drawdowns and demands on attention.
Advantages and disadvantages of trend trading
One advantage is that trend trading provides a coherent reason for staying with a position while the original conditions remain intact. A method with an adaptive exit can participate in an extended movement without needing a precise forecast of the destination. Longer-term approaches may also generate fewer transactions than scalping, reducing repeated spread costs relative to the size of the intended move. Spread betting makes both long and short expressions possible, subject to the contract and availability of the market. A defined review schedule can help organise the work around other commitments. These are practical features rather than evidence of superior returns: fewer trades do not necessarily mean lower total costs, particularly when financing accumulates over a long holding period.
The main disadvantages are false starts, delayed exits and the difficulty of holding through normal fluctuations. A sideways market can repeatedly trigger entries that reverse, producing a sequence of losses known as whipsaws. Waiting for confirmation reduces some early entries but also means joining after part of the move has occurred. Giving a trend room to continue requires accepting pullbacks and usually giving back some unrealised profit before an exit. Holding overnight introduces event and gap exposure, while financing can erode a slow-moving position. There may also be long periods with few qualifying opportunities. A trader who fills those quiet periods with unrelated trades is no longer evaluating the original method, even if the account activity looks productive.
| Feature | Potential advantage | Trade-off to assess |
|---|---|---|
| Directional rules | Clear basis for entering and remaining in a trade | A confirmed trend can reverse immediately |
| Adaptive exits | Opportunity to participate in an extended move | Some unrealised profit is normally surrendered |
| Longer chart intervals | More time between scheduled decisions | Greater exposure to overnight events and financing |
| Lower turnover | Fewer repeated entry costs | Long holding costs can still be substantial |
| Long and short positions | Ability to express either market direction | Short rallies, borrowing charges and availability require attention |
| Repeatable signals | Easier comparison of planned and actual behaviour | Sideways markets can produce repeated false signals |
Common ways to enter a trend trade
Buying or selling a pullback
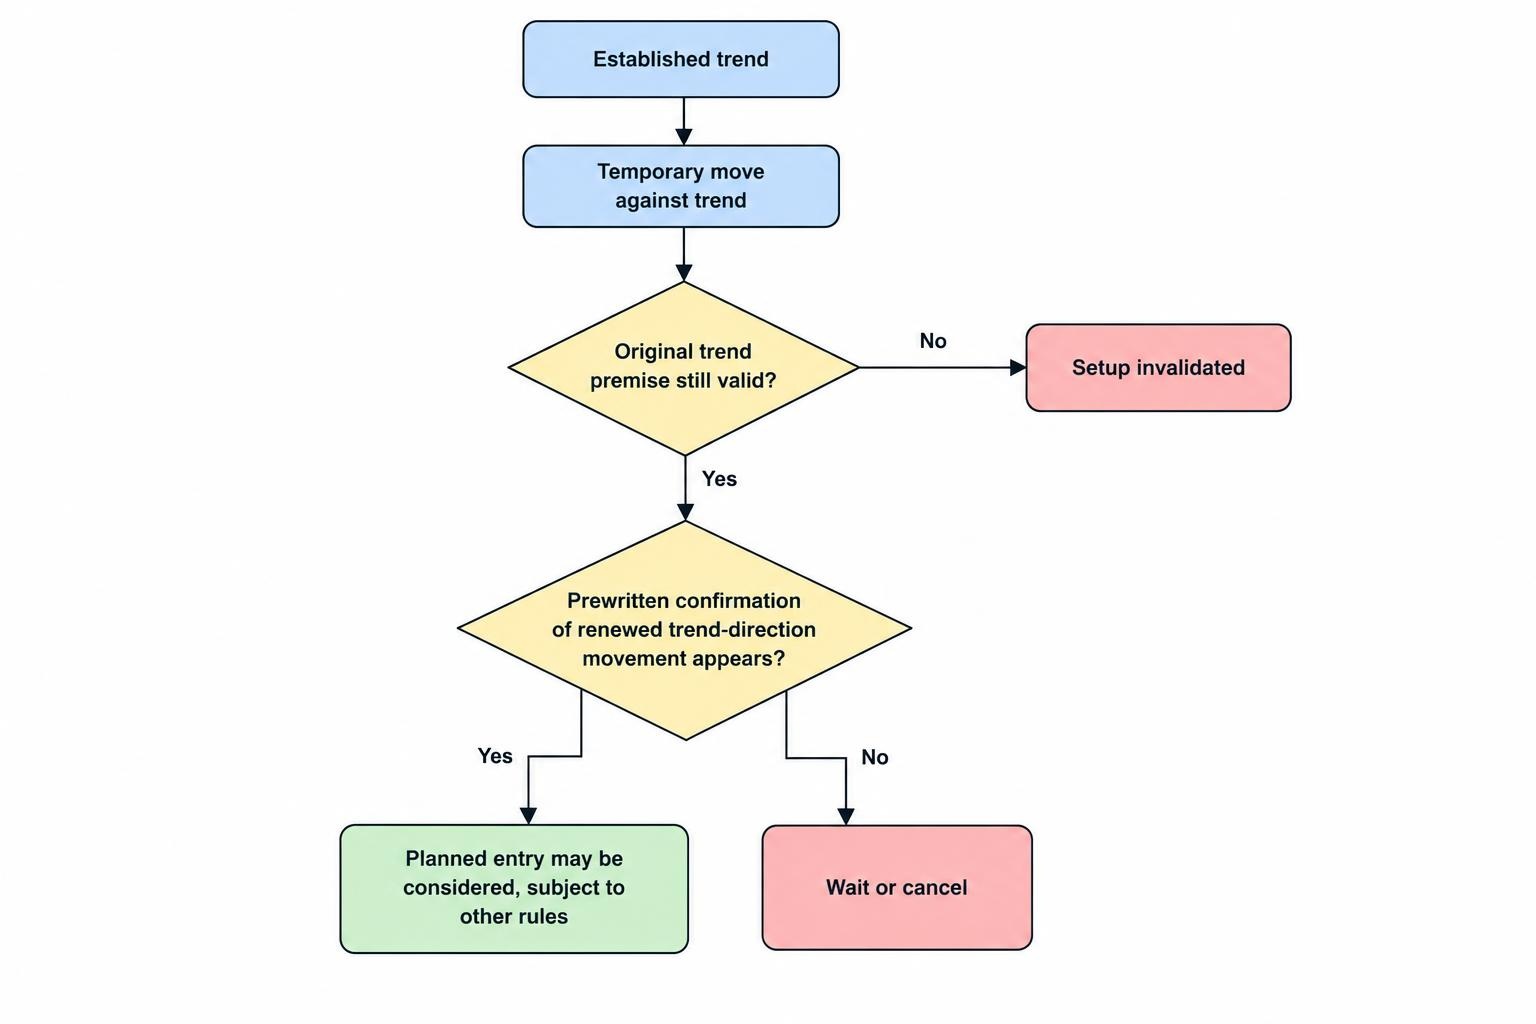
A pullback entry waits for a temporary move against the established direction before attempting to join it. In an uptrend, the trader might watch a retreat towards a previous breakout area, then require evidence of renewed buying before entering. In a downtrend, the equivalent is a rally followed by renewed selling. The attraction is a potentially closer invalidation point than an entry made after a sharp extension. The difficulty is that a pullback can become a reversal, or the market can resume its trend without reaching the preferred entry. Write down the confirmation and cancellation rules in advance. A lower price alone does not make a long entry better if the evidence supporting the uptrend has deteriorated.
Entering a breakout or channel signal
A breakout method enters when price clears a previously defined boundary in the trend’s direction. A channel rule might use the highest high or lowest low over a chosen number of completed periods, while another method might use a visible consolidation. The rule should state whether a temporary breach is enough or whether a close beyond the boundary is required. It also needs a maximum acceptable entry distance if price jumps before the order executes. Breakout trading can capture moves that never offer an orderly pullback, but it can also buy or sell directly into a failed extension. A stop-entry order may help apply the trigger consistently, although its fill can differ from its trigger price.
Using a moving-average rule
A moving-average method might buy when a faster average crosses above a slower one, or require price to remain above a rising average before considering another entry signal. These are examples to investigate, not universally effective settings. Both averages describe past prices, so their agreement does not supply two independent forecasts. Crossovers can also occur repeatedly when a market has little net direction. The moving averages guide should be used to understand what changes when the calculation period or averaging method changes. Specify the chart interval, whether signals require a completed candle and how the exit works. A simple rule with realistic execution assumptions is more informative than a complicated chart whose signals cannot be reproduced consistently.
Choosing markets and timeframes
Indices, currency pairs, shares and commodities can all exhibit directional movements, but their contracts and price drivers differ. An index position reflects a basket of companies; a share can be dominated by one earnings announcement; a currency pair reflects the relationship between two currencies; a commodity can react to supply disruptions or inventory information. Select a market whose point value, trading hours and event risks can be understood and documented. Then decide how frequently the method needs review. A daily-chart strategy does not become suitable for a busy trader if its rules also require several discretionary interventions during each session. The holding period, available attention and contract costs need to fit together before the apparent quality of a chart pattern is considered.
Stops, trailing exits and letting profits run
The initial stop should identify a price at which the trade’s premise has failed or the planned exposure must end. It might sit beyond a relevant swing, outside a price channel or at a distance informed by recent volatility. An ATR-based approach uses average true range as a measure of recent movement, but ATR does not predict the next maximum loss. Whatever method is used, calculate the stake after choosing a defensible stop distance. Placing the stop artificially close just to support a larger position can turn ordinary fluctuations into repeated losses. Ordinary stops can also slip during gaps or rapid moves, so the difference between entry and stop describes planned price risk rather than a guaranteed maximum loss.
A trailing exit moves the intended exit level as the trade develops favourably. In a long position, the rule may raise the stop beneath newly established lows; in a short position, it may lower the stop above falling highs. A volatility rule can also be used, but a design intended to tighten risk should not move the stop farther away merely because volatility increases. Define whether the stop only ratchets in the favourable direction and when updates occur. A fixed profit target is another valid design, although it caps participation if the trend continues. Partial exits combine approaches but change the distribution of results. They should be tested as part of the method rather than added whenever an open profit feels uncomfortable.
Practical example: following an index uptrend
Suppose a hypothetical index has established higher highs and higher lows on the trader’s chosen chart. After a pullback and a renewed upward move, the provider quotes 8,250/8,252. The trader buys at 8,252 for £0.50 per index point and sets an intended stop exit at 8,152. The 100-point distance creates £50 of planned price risk before financing, separate charges or slippage. The position initially shows a £1 loss if valued at the unchanged sell price of 8,250. The strategy has no fixed profit target; instead, it raises the stop only when its stated trailing rule allows. The £50 figure is an illustration, not a recommended risk allowance or an assurance that the loss cannot exceed it.
Assume the sell price later reaches 8,482, giving an unrealised price profit of £115. By then, the trailing rule has raised the stop to 8,392. A subsequent reversal closes the trade at that level, producing a 140-point gain from the actual entry, worth £70. After an assumed £8 financing charge, the net result is £62, with no other adjustments in this example. The trader surrendered £45 of the peak unrealised price profit before exiting. That is part of the chosen exit design, not necessarily an execution mistake. Selling at the highest price would look better on the completed chart, but that high was not identifiable as the final high when it occurred.
| Alternative outcome | Actual closing sell price | Price profit or loss at £0.50 per point | Assumed financing debit | Net result |
|---|---|---|---|---|
| Trend develops, then trailing exit fills | 8,392 | +£70 | £8 | +£62 |
| Initial stop fills as planned | 8,152 | −£50 | £2 | −£52 |
| Market gaps below the initial stop | 8,122 | −£65 | £2 | −£67 |
These are alternative paths for the same starting position, rather than successive stages of one trade. The financing amounts are illustrative and reflect different assumed holding periods. Because the calculations use the actual opening buy price and closing sell price, the spread is already included and should not be deducted again. The gap example shows how an ordinary stop can leave a loss larger than the planned £50 price risk. A guaranteed stop, where available, provides a contractual exit under its terms, with premiums and distance restrictions that must be checked. The guaranteed stops guide explains that distinction in more detail. Neither a successful example nor a neat trailing rule establishes the long-run profitability of the strategy.
Practical example: following a forex downtrend
Suppose GBP/USD is quoted at 1.2700/1.2702 after a rally within an established downtrend. For this hypothetical contract, one point equals one pip, or 0.0001. The trader sells at 1.2700 for £0.50 per pip and places an intended stop purchase at 1.2780, giving 80 pips or £40 of planned price risk. The downtrend continues, and the strategy later closes at the buy price of 1.2500. The 200-pip gain produces £100 before carrying costs. With an assumed net financing debit of £6 and no other adjustments, the result is £94. A short position does not automatically receive financing income; the applicable currency rates and provider’s charges determine whether the holding adjustment is a credit or debit.
The closing price for a short position is the offer, because the trader must buy back the exposure. A bid chart touching 1.2500 does not establish that a closing purchase at 1.2500 was available. If an unexpected announcement instead pushes the market higher and the stop fills at 1.2810, the price loss is 110 pips, or £55, before any funding adjustment. This is larger than the planned £40 even though the intended stop was placed correctly. The example also depends on the contract defining a point as a full pip; fractional-pip displays must not be confused with the stake unit. A platform’s monetary preview and contract specification should resolve that detail before the position is opened.
Financing and contract choice for longer trends
The longer a position remains open, the more attention its carrying costs deserve. Daily funded bets typically apply financing according to the product terms, and the amount relates to the financed exposure rather than simply the margin deposited. The FCA’s review of CFD providers’ price and value, covering spread bets as well as related products, highlights differences in funding practices and the need to assess costs beyond the spread. For illustration, an unchanged £6,000 exposure charged at an assumed annual rate of 7.5% for 20 chargeable days on a 365-day basis would cost about £24.66. Actual calculations can use different conventions, changing exposure, variable rates and product-specific adjustments. A modest directional gain can disappear after those charges.
A dated or forward spread bet may incorporate financing and other pricing components into its quote rather than apply the same daily funding arrangement. That does not make the carrying cost disappear. Compare the expected holding period, spread, expiry arrangements and total estimated cost under each contract’s terms. If a trade extends beyond expiry, rolling it into a later contract can introduce further costs and a different quoted price. Continuous futures charts may also be adjusted when contracts change, which matters when testing price levels or signals. Share and index positions can receive dividend adjustments, while short shares may incur borrowing charges. These adjustments are part of the economic result, not a separate source of free profit from holding through a dividend date.
Position sizing, margin and portfolio exposure
Set the stake from the amount assigned to planned price risk and the distance to the intended stop. A £50 allowance divided by a 100-point stop distance gives £0.50 per point. If comparable market conditions require a 200-point stop, retaining the same allowance reduces the stake to £0.25 per point, assuming the contract permits it. This calculation does not account for an unlimited gap and is not a recommendation to use either allowance. Include room for expected charges and assess how worse-than-planned exits would affect the account. The position sizing guide explains this process separately from margin. If the minimum stake prevents suitable sizing, choosing a closer stop merely to make the arithmetic fit changes the trade’s risk characteristics.
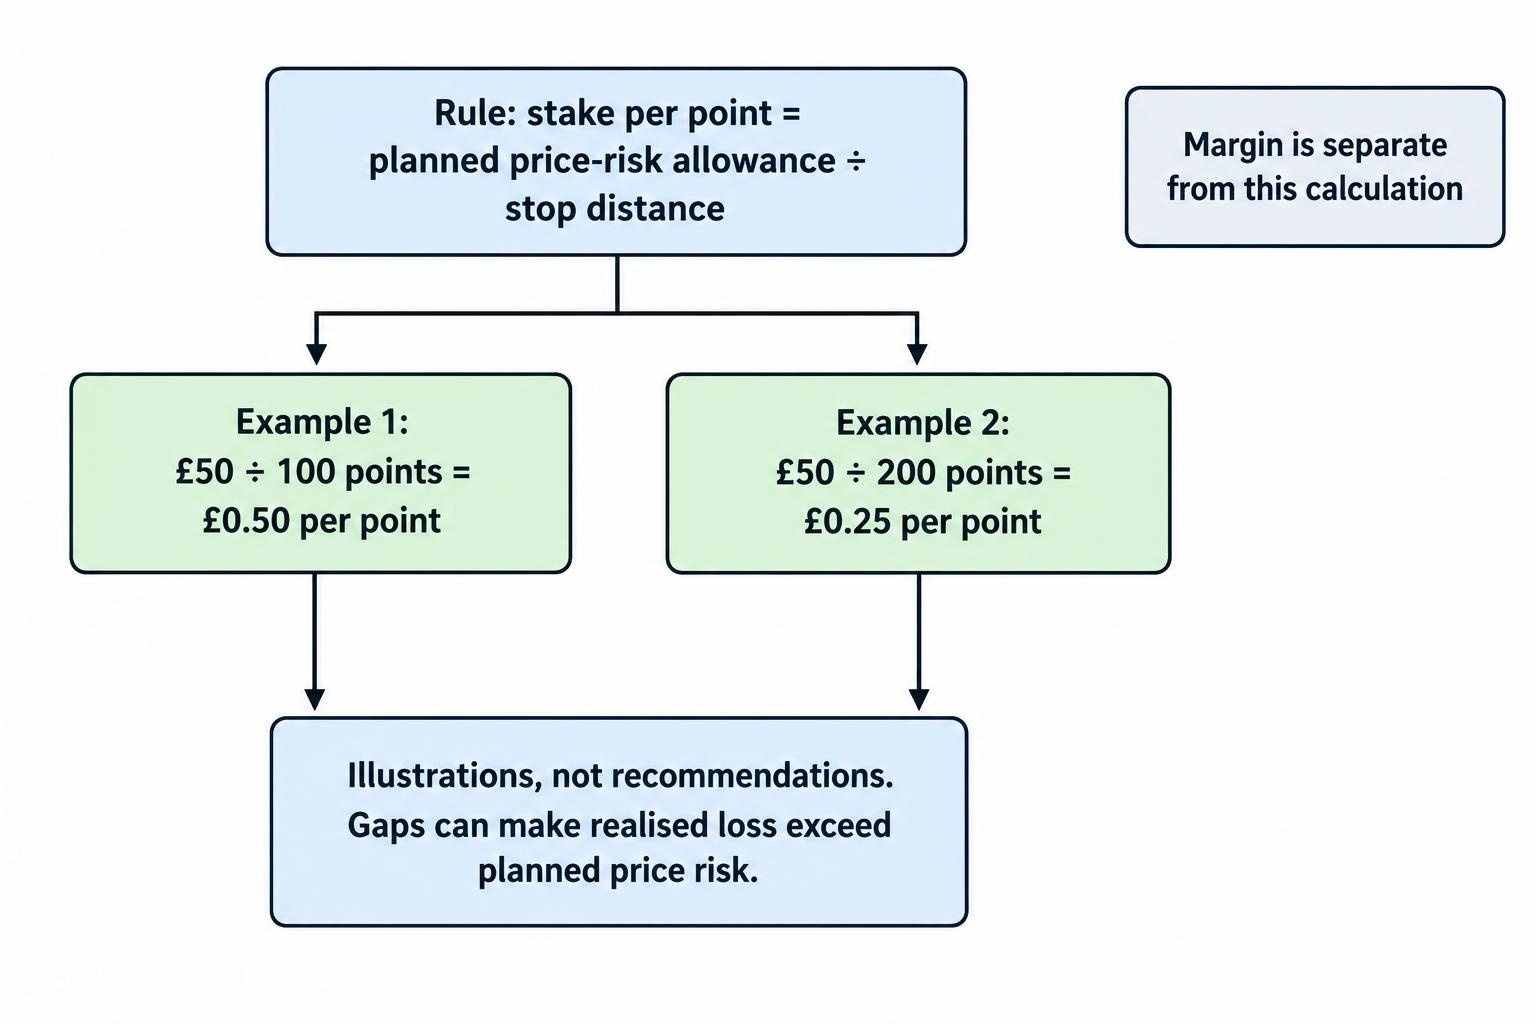
Under FCA retail rules in COBS 22.5, major stock indices require at least 5% initial margin and major currency pairs at least 3.33%; firms can require more. In the index example, 8,252 multiplied by £0.50 gives approximately £4,126 of exposure. At an assumed 5%, initial margin would be £206.30. That is separate from the £50 planned price loss. The rules also require account-level close-out when net equity falls below 50% of required margin, as soon as market conditions allow, and provide negative balance protection for relevant retail accounts. Those protections do not preserve the money already in the account or guarantee execution at an individual stop price. A margin threshold should therefore never substitute for a trading exit rule.
Several trend positions can create more concentrated exposure than their separate tickets suggest. Long positions in multiple equity indices may all react to the same change in market sentiment. Several currency trades can express the same underlying view on the US dollar. Assess the combined effect of a common adverse move rather than treating each position’s stop allowance as independent. Adding to a winning trade also increases exposure, even when the original entry has an unrealised profit. Each addition needs its own justification and a calculation of the aggregate outcome at the intended exits, including slippage scenarios. An existing paper gain is not a separate reserve of risk-free capital. The portfolio correlation guide develops this account-level perspective.
What to do when the trend weakens or disappears
Trend methods are vulnerable when markets stop moving directionally and begin reversing within a range. A trend-strength filter, volatility condition or requirement for a minimum distance between signals may reduce some entries, but each extra condition also creates opportunities to fit the past too closely. ADX is sometimes used to describe trend strength, although it does not identify the direction by itself and can lag changes in conditions. A more basic rule might simply stop new entries after the price structure ceases to meet the definition. Specify how trading resumes as well as how it pauses. No filter can reliably announce that the next signal will fail, and occasional losing trades do not by themselves prove that the method has stopped working.
Economic announcements and company events can interrupt a trend even when the chart remains orderly beforehand. Interest-rate decisions, inflation releases, earnings reports and unexpected headlines can change expectations quickly. A trader should decide in advance whether to hold, reduce exposure or avoid new entries around relevant events. That decision becomes part of the method and its testing, rather than a last-minute response to anxiety. Fundamental analysis can help identify the events and assumptions associated with a move, but a convincing explanation does not guarantee continuation. Once the stated exit condition is met, a favourable economic story is not a reason to ignore it. The market can reprice before the trader’s preferred explanation changes.
How to get started with a trend-trading process
Begin with one market and a small set of rules that can be written down clearly: how the trend is defined, what triggers an entry, where the initial stop goes, how the stake is calculated and what ends the trade. Choose a review schedule that matches the chart interval and decide how open positions will be handled around events and market closures. Before choosing an account, use the FCA’s guidance on checking that a firm is authorised and genuine, including the relevant permissions and contact details. Read the legal entity, contract specifications, funding terms and execution policy. Authorisation does not establish that a strategy is suitable, but the account must support the intended trading process and product requirements.
Practise the complete process in a demonstration environment, including stop amendments, closing positions and cancelling orders that are no longer needed. Check what happens to protective orders when the device disconnects and whether trailing functionality depends on the platform remaining active. Record planned and actual decisions so that the exercise evaluates behaviour as well as chart signals. Demo fills and costs may differ from live conditions, and simulated losses do not reproduce the pressure of losing real money. Progress should depend on understanding the contract and producing an interpretable record, rather than completing an arbitrary number of practice days. If a live evaluation is appropriate, a suitably small stake can help assess those differences without assuming the method is ready to provide income.
Testing results, win rates and losing streaks
Test entries and exits together using information that would have been available at each decision. Include spread, slippage, funding, dividend adjustments and rollover treatment where relevant. Compare different market conditions and retain an evaluation period that was not used to choose the rules. Research on the probability of backtest overfitting explains why selecting among many historical strategy variations can produce misleading performance. A trend system can be especially vulnerable to a test period dominated by one unusually persistent move. Check how dependent the result is on its largest winners and whether modest changes in costs or parameters remove the apparent advantage. Historical performance is evidence for further assessment, not a guarantee that the same pattern will remain profitable.
A trend method does not necessarily need to win most trades, but its winners must compensate for losses and costs. Suppose a hypothetical model wins 40% of trades, with average gains of 2.2 times its initial price risk and average losses of one times that risk before costs. Its expected result is 0.40 × 2.2 minus 0.60 × 1, or 0.28 risk units per trade. If average costs are 0.12 risk units, the estimate falls to 0.16. These assumed figures demonstrate the calculation rather than a typical return. A rule that cuts winners early could remove that advantage. Review actual net results, drawdown and losing streaks, and avoid subtracting costs again if they are already included in the recorded wins and losses.
Is trend-trading spread betting tax-free in the UK?
HMRC’s Business Income Manual states that a person placing a spread bet is not normally carrying on a trade, with profits not taxable and losses not relieved under that normal treatment. Its guidance on spread betting exceptions explains that the terms of the contract and economic substance matter, including whether winnings arise from carrying on an existing trade. Using a trend strategy, holding for several weeks or trading frequently does not by itself settle every tax question. Residence, personal circumstances and company arrangements can require separate consideration. Tax treatment should be assessed alongside the contract’s risks and costs; a favourable treatment of profits cannot create a trading edge, while the normal absence of loss relief remains relevant when a strategy loses money.
Building a trend strategy you can actually follow
A workable trend-trading approach brings the entry rule, holding period, exit design, stake and contract costs into one consistent process. Its success cannot be judged from the appearance of a rising chart or one profitable trade. The difficult work is accepting failed signals, maintaining sensible exposure and allowing the exit rule to operate without turning every pullback into a new decision. Keep records that show whether losses came from the planned method, execution differences or departures from the rules. Use those records to decide whether the approach deserves further evaluation, needs revision or should be stopped. A trader does not need to capture every trend. They need a process whose behaviour they understand well enough to assess its results and protect the capital committed to it.