Comparing total spread betting costs means pricing the trade you expect to make, from entry to exit, rather than choosing the smallest advertised spread. A narrow spread can suit a position closed within the same session. It can lose that advantage once overnight financing, execution differences or account charges enter the calculation.
The useful comparison is the expected cost in pounds for the same market exposure, holding period and trading conditions. Build that figure for individual trades, then apply it to your usual mix of activity. Keep market losses separate: a cheaper account does not turn a losing strategy into a profitable one.
This guide brings the charges covered in spread betting costs explained into one comparison method. All provider names, rates and trading figures in the worked examples below are hypothetical, not current quotes or recommendations.
Define the same trade before comparing prices
A cost comparison needs a consistent starting point. Match the underlying market, contract type, direction, stake, entry time and expected exit time. Comparing a cash index spread at one provider with a quarterly contract at another mixes different products before the arithmetic has even started.
Check what each provider calls one point. A market name alone does not establish identical exposure. The quote scale, decimal places and contract specification determine how a price move translates into money. The guide to stake per point covers that relationship.
For an index quoted at 8,000, a £2 stake per whole index point represents approximately £16,000 of notional exposure. That calculation assumes the contract uses whole index points in the expected way. Do not apply the same shortcut blindly to a currency pair or commodity with a different point convention.
Match the account offering too. Use the relevant UK legal entity, account currency and client category. A pricing page for an overseas entity, or a different product available under the same brand, may not describe the account you can open.
Finally, specify your trading conditions. Someone dealing during the underlying market’s main session needs a different comparison from someone opening positions around an overnight announcement. Record the conditions you actually expect to use, not the most flattering conditions available on a marketing page.
A simple comparison brief might read: “Long cash index spread bet, £2 per point, entered during the main session, held for five chargeable days, then closed in full.” That is a trade you can price consistently.
Build a total cost figure without counting anything twice
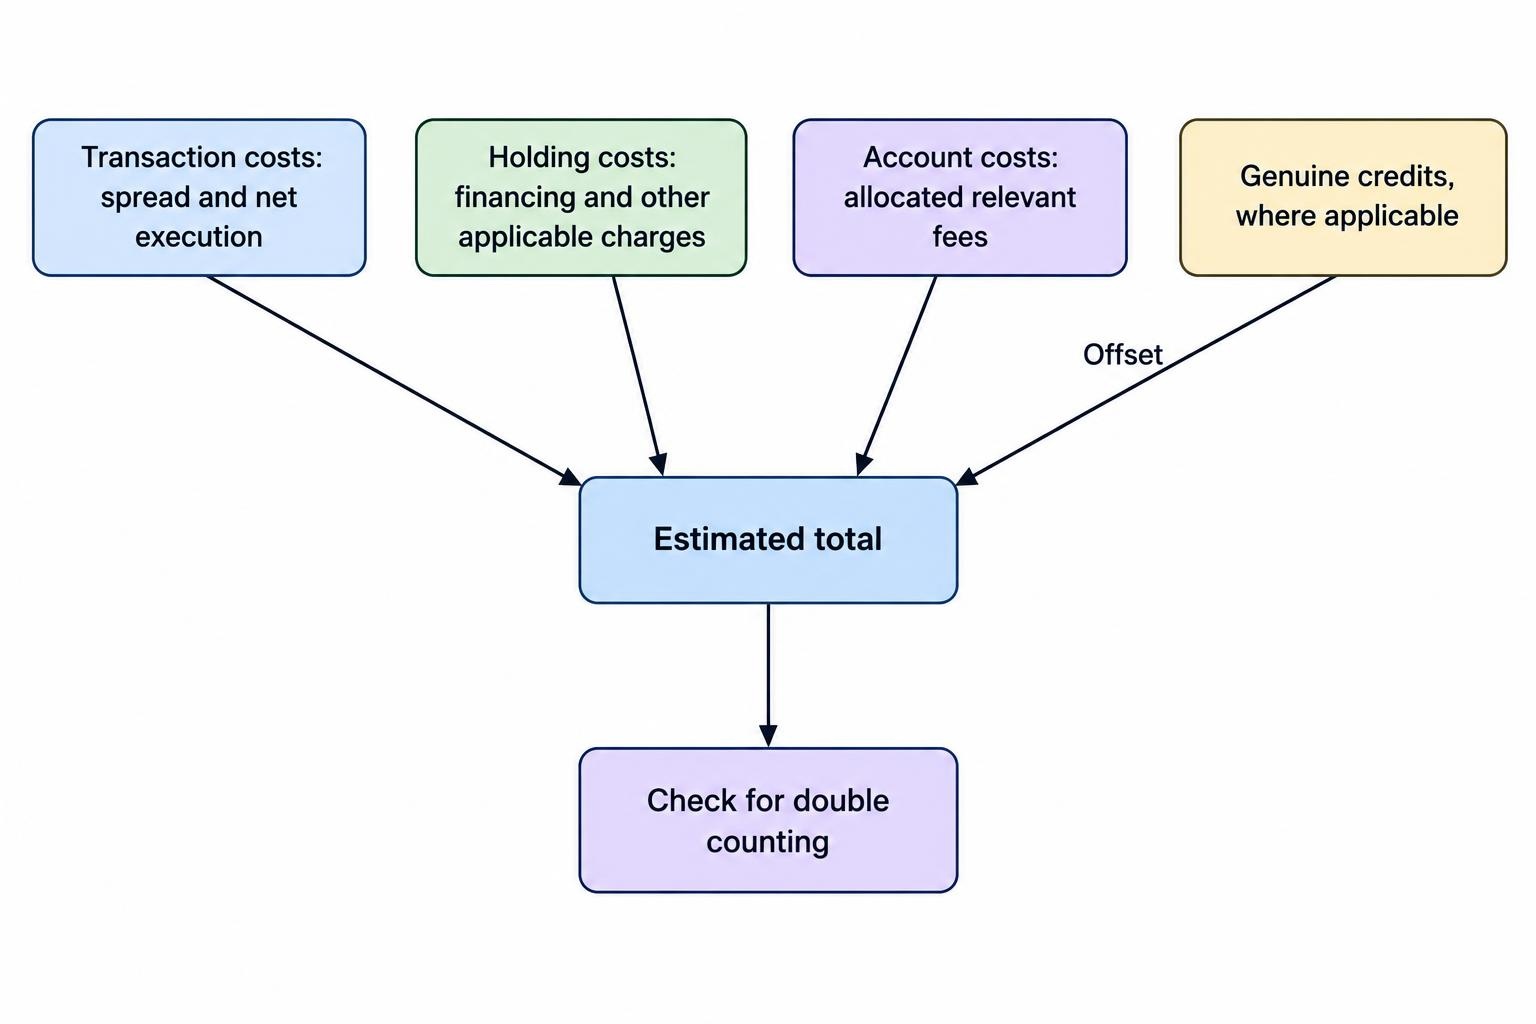
Separate costs into three groups: transaction costs, holding costs and account costs. Transaction costs relate to opening and closing the position. Holding costs accumulate while it remains open. Account costs sit outside an individual trade but still reduce the value you receive.
For a cash spread bet, a practical estimate is:
Expected total cost = spread cost + net execution cost + financing and other holding charges + applicable transaction fees + allocated account charges.
Subtract genuine credits where appropriate, but keep their nature clear. A financing credit can offset a financing debit. A dividend adjustment should not be treated as a fee discount without considering the associated market price adjustment.
| Cost component | How to compare it | Main accounting check |
|---|---|---|
| Spread | Convert the expected entry and exit spread into pounds at the chosen stake. | Do not charge two full spreads for one unchanged round trip. |
| Execution | Measure fills against a consistent executable price benchmark. | Allow for price improvement as well as adverse slippage. |
| Overnight financing | Apply the relevant rate, calculation base and chargeable days. | Use the contractual exposure base, not an assumed margin balance. |
| Other holding charges | Check borrowing, administration and product adjustments. | Keep contractual price adjustments separate from provider fees. |
| Guaranteed stop premium | Price the same protection and charging conditions. | Distinguish an immediate charge from a conditional one. |
| Currency conversion | Identify the amount converted and the applicable markup. | Do not assume the entire notional position is converted. |
| Account charges | Include subscriptions and other fees relevant to expected use. | Allocate each charge once, across the appropriate activity. |
“Commission free” answers only whether a separate commission applies. It does not establish the total price of trading. Check the treatment of spread betting commissions and dealing charges, then continue through the rest of the calculation.
Keep two records: an estimated cost before trading and an actual cost review afterwards. The estimate helps compare accounts. The review shows whether its assumptions were realistic. Neither should disguise adverse market movement as a provider fee.
Convert spreads into pounds, not marketing comparisons
The spread is the gap between the buy and sell quotes. Its cost depends on the stake and the prices available when you enter and exit. The mechanics of the bid-ask spread matter because it is easy to overstate this cost by counting it twice.
Suppose a hypothetical index quote is 7,999.5 to sell and 8,000.5 to buy. You buy at £2 per point and immediately close at the unchanged sell quote. The one-point difference costs £2. It does not cost £4 simply because there were two transactions.
If the spread changes between entry and exit, a useful estimate measured against each quote’s midpoint is:
Round-trip spread cost = stake per point × (half the entry spread + half the exit spread).
An entry spread of 1.2 points and an exit spread of 2.4 points therefore produces an estimated spread cost of 1.8 points. At £2 per point, that is £3.60. This calculation isolates spread friction; it does not include the market’s movement between the two trades.
Use representative spreads rather than the lowest available quote
A minimum spread is a starting observation, not a complete estimate. Build your comparison around the market, dealing size and time of day you expect to trade. If your exits often occur outside the main session, include those exit conditions rather than assuming the entry spread lasts indefinitely.
Record several observations across relevant sessions, including less favourable conditions your strategy could encounter. Note the timestamp, market status, stake and whether the quote was indicative or executable. This makes comparisons between providers with lower spreads more useful than a table of unrelated minimums.
For a mixed trading schedule, weight the observations by expected usage. If most trades occur during the main session but some occur around announcements, do not give both conditions equal weight unless that reflects your activity. Also retain an adverse scenario. An average alone can hide an expensive exit.
Compare financing on the correct exposure and calendar
For positions held beyond the provider’s funding cutoff, financing can change the ranking between accounts. Compare the complete funding calculation, not just a headline administration percentage. The separate guide to overnight financing costs covers the charge itself; here the task is to make competing calculations comparable.
Where a contract uses a benchmark plus a markup, record both parts. SONIA, for example, measures overnight sterling borrowing rates using actual transactions and is administered by the Bank of England. It is not simply another name for Bank Rate; the Bank of England’s SONIA benchmark description establishes what the benchmark measures.
Do not assume every spread bet uses SONIA, or that a sterling account makes a sterling benchmark relevant to every market. Read the product’s funding terms. Currency positions, commodities and other contracts may use calculations that differ from a straightforward cash index funding formula.
For a product using a simple annual rate, an illustrative calculation is:
Financing = relevant notional exposure × annual funding rate × chargeable days ÷ contractual day-count basis.
The FCA’s November 2025 review identified funding charges applied to full underlying exposure without an offset for client funds held on account. It also found cases where one firm charged for an overnight short position while another would have credited the same position. Both findings make the calculation base and trade direction material to a comparison; see the FCA review of CFD and spread betting price and value.
Count chargeable days, not just nights you remember holding
Establish the cutoff time, its time zone and how weekends and holidays enter the calculation. A position held for one dealing session might still cross a funding cutoff. Conversely, a trade closed before the relevant cutoff may avoid that day’s overnight charge, subject to its terms.
For a position crossing a weekend, determine where the non-business-day funding appears. Do not assume every product applies it on the same weekday. These checks are especially relevant when holding spread bets overnight as part of a planned strategy.
Compare rates on a common basis. If one provider quotes a daily percentage, convert it into a simple annual equivalent using the stated convention before comparing it with an annual rate. Keep that comparison separate from compounding assumptions, and check whether quoted rates already include the provider’s markup.
Finally, price long and short trades separately. A short position should not be assigned an assumed credit simply because the long position incurs a charge.
Worked example: a tighter spread versus cheaper funding
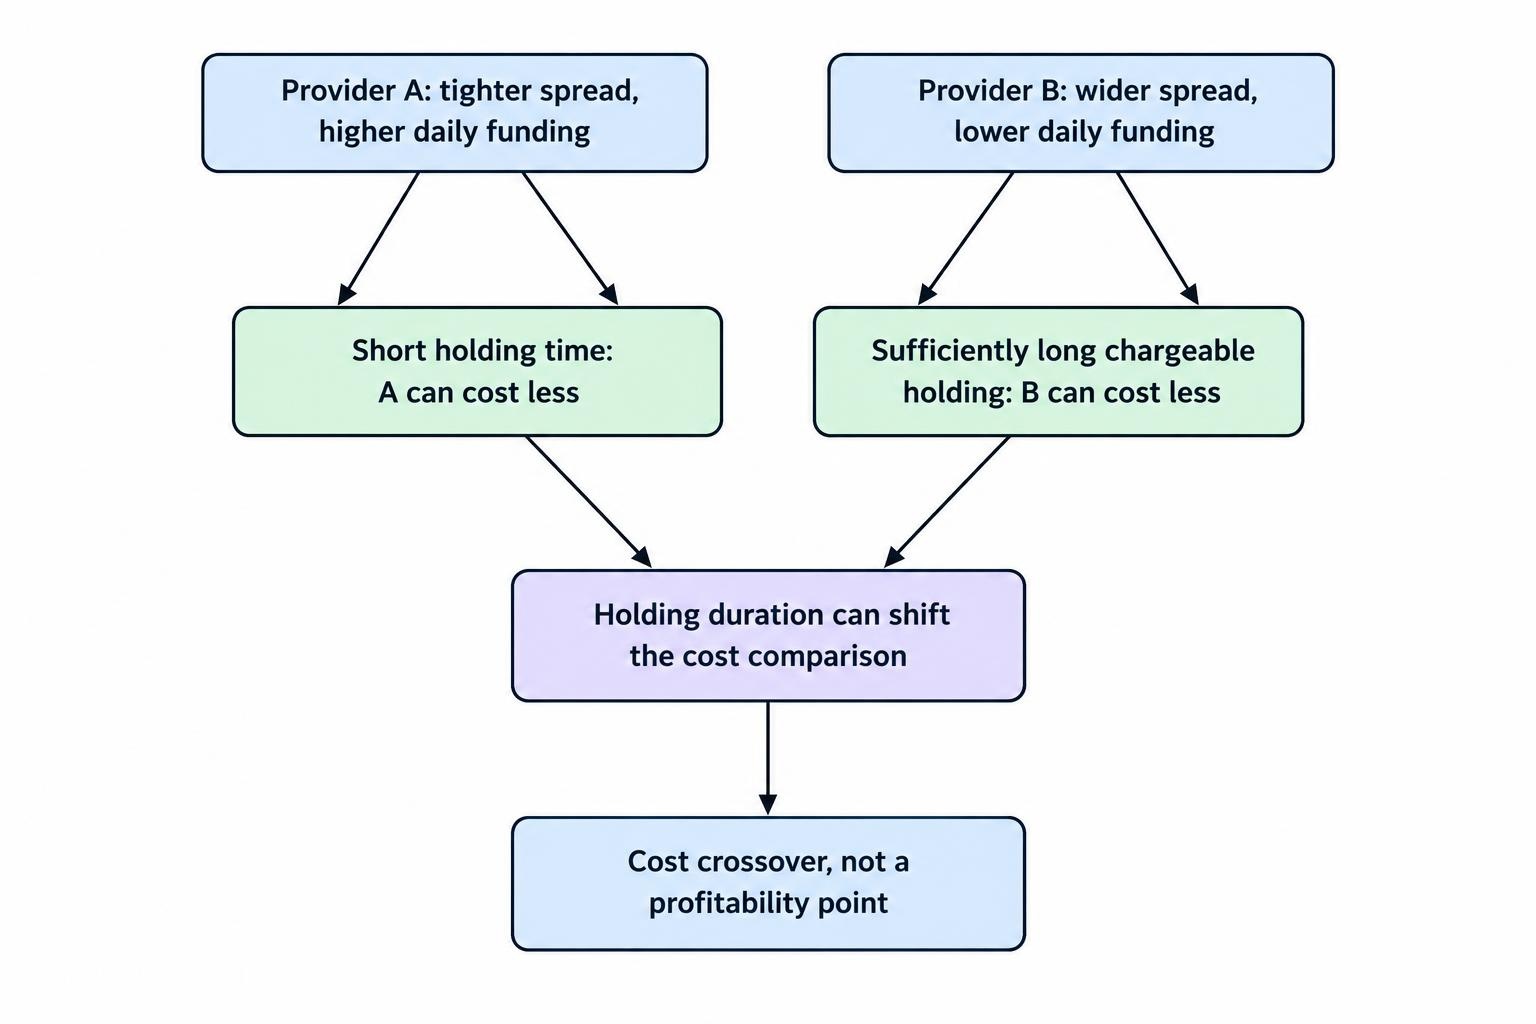
Consider two hypothetical providers offering the same cash index exposure. The index is at 8,000 and the stake is £2 per point, giving £16,000 of notional exposure. Provider A has a tighter spread, while Provider B has a lower annual funding rate.
The comparison assumes an unchanged notional value, constant spreads, simple funding on a 365-day basis and no dividends, commissions, slippage, premiums or account fees. “Days” means chargeable funding days, not a count of trading sessions.
| Comparison item | Provider A | Provider B |
|---|---|---|
| Notional exposure | £16,000 | £16,000 |
| Spread | 1.0 point | 1.8 points |
| Round-trip spread cost | £2.00 | £3.60 |
| Annual funding rate | 7.5% | 6.5% |
| Funding per chargeable day | £3.29 | £2.85 |
| Total with no overnight funding | £2.00 | £3.60 |
| Total after five chargeable days | £18.44 | £17.85 |
| Total after 20 chargeable days | £67.75 | £60.59 |
Provider A is cheaper for the trade that incurs no funding. After five chargeable days, Provider B is cheaper, although only by about 59p. After 20 days, its advantage is approximately £7.17. Calculations use unrounded daily amounts before rounding the totals.
Find the holding period where the ranking changes
Provider B starts with an extra £1.60 in spread cost. Its daily funding saving is approximately 44p. Divide the extra opening-and-closing cost by the daily saving:
Cost crossover = £1.60 ÷ (£16,000 × 1% ÷ 365) = 3.65 chargeable days.
Under these assumptions, Provider B becomes cheaper from the fourth full chargeable day. This is a cost crossover, not the point at which the trade becomes profitable.
The result is sensitive to small differences. An extra pound of execution cost could outweigh the five-day saving. A different funding calendar could move the crossover. A rate change during the holding period would require a new calculation.
This is why a comparison should show both the estimated total and the assumptions behind it. A result without assumptions looks precise, but it may answer the wrong question.
Apply the calculation to your mix of trades
A provider that wins one example need not be cheapest across an account. Weight costs by your expected activity: the number of trades, their stakes and the total funding days they generate.
Using the same hypothetical terms, suppose an activity period contains 30 completed trades. Twenty incur no overnight funding. Ten are each held for five chargeable days. Every trade has the same £16,000 exposure.
Provider A’s spread cost is £60 across the 30 trades. Funding for the ten longer trades adds about £164.38, producing a total of £224.38. Provider B’s spread cost is £108, with funding of about £142.47, producing £250.47. Provider A is cheaper across this mix, despite losing the individual five-day comparison.
Now hold those ten longer trades for 20 chargeable days instead. Provider A’s total becomes approximately £717.53, while Provider B’s becomes £677.86. The greater funding exposure reverses the ranking.
For a real account, use position-days weighted by notional exposure rather than a simple average holding period. A small position held for a month and a large position held for a week do not contribute equally to funding costs.
Run a planned case and a longer-holding case. Trades do not always close on schedule. That does not justify extending a losing position; it simply tests whether the account remains reasonably priced if the intended holding period changes.
Add conditional charges only when they apply
Not every item in a fee schedule belongs in every trade estimate. The aim is a realistic total, not the largest number you can assemble. Identify whether each charge is unavoidable, optional or dependent on an event.
Guaranteed stop premiums
Compare equivalent protection. A trade using a guaranteed stop is not directly comparable with one using an ordinary stop unless you acknowledge the different execution protection. Record the premium, its calculation base, when it becomes payable and whether any refund conditions apply.
For planning, show the cost if the guarantee is not triggered and the cost if it is. Only use a probability-weighted estimate if you have a defensible basis for that probability. Otherwise, two transparent scenarios are better than one invented average. The treatment of guaranteed stop premiums deserves its own line in the comparison.
Do not automatically add ordinary stop slippage to the guaranteed portion of a protected exit. Equally, do not assume the guarantee removes spread costs, financing or every possible contractual charge.
Currency conversion and short-position charges
Start by identifying what, if anything, is converted. The underlying market’s currency does not, by itself, establish that the full notional position will undergo conversion. Check the account currency, stake denomination and settlement terms.
A hypothetical 0.5% conversion markup on a £100-equivalent cash amount costs 50p. Applying that percentage to a £16,000 notional position would produce £80, but would be wrong unless the terms actually require that notional conversion. Compare currency conversion charges using the correct cash amount.
For a short share bet, check whether a stock borrowing charge applies, whether the quoted rate can change and how it interacts with financing. Do not assume a stated funding credit represents the net holding result after every other charge.
Subscriptions, data and inactivity
Fixed charges matter most when trading activity is modest. A £12 monthly subscription adds 30p per trade across 40 completed trades, but £3 per trade across four. These are allocation figures, not extra transaction fees.
Include market data fees for subscriptions you expect to retain. Check whether any waiver depends on activity you would undertake anyway. Trading more just to qualify for a rebate can make the saving rather expensive.
For a secondary or occasionally used account, review inactivity fee conditions. Establish what counts as activity, when the clock starts and whether maintaining the account creates a foreseeable charge.
Where charges are shared across several strategies, allocate them once using a consistent method. Keep optional research subscriptions separate if you would buy them regardless of which spread betting account you choose.
Compare dated contracts without treating embedded financing as free
A dated contract requires a different holding-cost comparison from a daily funded cash bet. The absence of a separately posted daily financing debit does not establish that carrying the exposure has no economic cost.
For equity index futures, theoretical pricing reflects the cash index, interest rates, expected dividends and time to expiry. Actual prices can differ from theoretical fair value. The relationship is set out in CME Group’s equity index fair value calculation.
When comparing a cash spread bet with a futures-based spread bet, model the same exposure over the same intended holding period. Include the spread and any explicit charges for each product. For the dated contract, also consider how its price relative to cash may change before your intended exit.
Do not automatically book the entire starting futures premium as a fee. It is a price relationship, not necessarily a provider charge, and your exit price matters. Nor should you add the same financing effect again if your projected contract prices already incorporate it.
If the position will cross expiry, include the actual rollover terms. Separate the price difference between contract months from the cost of closing and reopening exposure. A contract-month price gap is not automatically an immediate loss of the same amount.
The detailed comparison belongs in daily funded bets versus futures spread bets. For a total-cost worksheet, the rule is simpler: measure comparable economic exposure and count each carrying effect once.
Include execution costs without confusing them with market movement
A quoted spread is not the whole transaction result. To review execution, compare the fill with a defined benchmark: normally the executable buy or sell quote relevant to the order, at a consistently recorded point in time.
Keep spread and slippage separate. If you measure an entry fill against the quote midpoint, the difference already includes half the spread. Adding another half-spread entry allowance would duplicate that portion of the cost.
At £2 per point, an adverse execution difference of 0.3 points costs 60p. An equivalent improvement benefits the trade by 60p. Use signed results when calculating average net execution cost, while also reviewing adverse outcomes separately. An acceptable average can conceal occasional poor fills.
The guide to the cost of slippage covers the charge-like effect in more detail. In a provider comparison, retain the order type, market conditions, size and benchmark alongside each observation.
Do not assign every movement between clicking and filling to provider conduct. Prices can move during transmission and execution. The purpose of a consistent benchmark is to make the comparison more disciplined, not to claim that every observed difference has the same cause.
Demo accounts can help confirm point values and practise the calculation. They should not be treated as proof of live execution quality. Likewise, an isolated fill is too narrow a basis for a confident ranking.
For a pre-trade estimate without suitable execution records, show a sensitivity allowance rather than an unsupported claim. Calculate the outcome with no additional slippage, then with plausible adverse amounts for the market and order type. Label those amounts as assumptions.
Do not mistake a smaller margin requirement for a lower price
Margin is collateral supporting the position, not the spread betting equivalent of a purchase price. A smaller required deposit does not, by itself, reduce the stake, notional exposure or contractual funding bill. Keep spread betting margin outside the fee total.
Costs can nevertheless consume a greater share of a smaller deposit. ESMA’s analysis of retail derivatives, including financial spread bets, identifies how greater leverage magnifies spreads, commissions and funding costs relative to margin. This is a cost-burden issue, separate from the market loss itself; see ESMA’s analysis of leverage and trading costs.
For example, a hypothetical £40 cost equals 5% of £800, but 2.5% of £1,600. The pound cost has not changed. The denominator has.
For account selection, compare the pound cost of the same exposure first. Then assess whether that cost is reasonable relative to the capital committed and the strategy’s expected gross returns.
You can also record the opportunity cost of cash retained in the account, allowing for any interest actually payable. Keep it separate from direct charges: foregone interest is not a broker debit. Do not add it twice if your wider performance benchmark already accounts for the return available on cash.
Check the documents, then reconcile the statement
Collect the product specification, current fee schedule, funding methodology, relevant execution policy and account terms. Record their dates. If a trade ticket displays an estimated charge, retain the assumptions behind that estimate rather than copying the number alone.
Confirm which entity provides the account before using its documents. The process for checking a broker on the FCA Register helps establish the firm you are dealing with. It does not replace checking the product and account terms.
Ask for clarification where the calculation cannot be reproduced. Useful questions concern the funding base, benchmark, markup, day-count convention, weekend treatment, short-position rate and treatment of offsetting positions. “What will this example trade cost?” is more useful than “Are your fees low?”
The FCA’s update published on 15 October 2026 continued to identify concerns about overnight funding levels and disclosure, including opaque markups and charges on matched long and short positions. Its findings expressly cover spread bets. The FCA’s good and poor practice findings for derivative providers reinforce the need to inspect funding terms rather than stop at the dealing spread.
If an account permits equal and opposite open positions, price both legs. Do not assume that little or no net directional exposure means little or no ongoing cost. Compare the contractual cost of maintaining both positions with closing the exposure, without treating those choices as identical in every respect.
After trading, reconcile explicit charges and credits against the estimate using the spread betting account statement. Spreads and execution differences need a separate review because they sit within dealing prices rather than necessarily appearing as standalone fees.
If actual profit and loss already uses executed entry and exit prices, it already reflects those prices’ spread and slippage effects. Do not subtract them again when calculating net performance. Add or subtract only the remaining charges and credits not already included.
Choose using a repeatable cost comparison
A useful comparison should be easy to update when your activity or a provider’s terms change. Keep the method stable even when the inputs move.
- Specify the trade. Match the market, point convention, stake, direction, contract and dealing times.
- Price the transaction. Convert representative spreads into pounds and use a clearly labelled execution assumption.
- Price the holding period. Apply the correct funding base, rate and chargeable-day calendar.
- Add relevant extras. Include conditional premiums, conversion, borrowing and account charges without duplication.
- Weight your activity. Compare the expected mix of trades, then test longer holds and less favourable exits.
- Review actual outcomes. Reconcile charges and execution records before relying on the estimate again.
Use comparisons of lower-cost spread betting providers as a starting shortlist, then apply your own trading assumptions. A ranking built for short intraday trades may not suit positions held for several weeks.
Where the cost difference is small, recognise the uncertainty rather than declaring a decisive winner. Clear terms, suitable order controls and dependable account administration remain part of the decision. Where the gap is substantial, identify which assumption creates it and verify that assumption carefully.
The cheapest account is the one with the lower reproducible cost for the activity you expect to undertake, not necessarily the one displaying the smallest number beside “spread”.