The Relative Strength Index, usually shortened to RSI, is a technical indicator that compares the strength of recent upward and downward price changes. Spread bettors use it to assess momentum, investigate possible reversals and define conditions for entering or leaving a position. Its familiar scale runs from zero to 100, with readings above 70 conventionally described as overbought and readings below 30 as oversold. Those labels describe price behaviour; they do not establish that a market is too expensive or too cheap. An RSI spread betting strategy therefore needs more than an indicator threshold. It needs a market context, an executable entry, an exit plan and a stake that fits the potential loss.
This guide explains how RSI works, which trading approaches it can support and how to translate a chart signal into a financial spread bet. All prices, indicator readings, stakes and costs in the examples are hypothetical. They illustrate mechanics rather than demonstrate a profitable system. Financial spread betting is a leveraged derivative, and the Financial Conduct Authority includes spread bets within its work on contracts for difference. The FCA describes these products as high risk and unsuitable for some retail consumers. An indicator cannot remove that product risk, and an apparently convincing signal does not justify increasing a position beyond a predetermined loss budget.
What is RSI, and what does it measure?
RSI summarises the balance between upward and downward closing-price changes through a smoothed calculation. It measures the price history of the market being analysed, rather than comparing that market with a separate benchmark. This matters because “relative strength” can also describe one share outperforming an index, which is a different calculation. RSI also measures the size of price changes, not simply how many candles finished higher. A sequence containing several small advances and one large decline can produce a weak reading. An RSI of 60 does not mean that 60% of candles rose, that the market is 60% overvalued, or that the next trade has a 60% probability of success.
For a spread bettor, RSI is best treated as a way of making a trading observation explicit. “Momentum recovered after a decline” is vague; “the completed hourly RSI crossed back above 30” is a condition that can be recorded and tested. That condition still says nothing about the available dealing spread, the next earnings announcement or the distance to a sensible stop. It belongs within the broader process described in our technical analysis guide. The useful question is whether adding that condition improves a clearly defined trading approach after costs, compared with using the same price setup without RSI. A more elaborate chart is not automatically a better decision process.
How is RSI calculated?
The standard formula is RSI = 100 − 100 ÷ (1 + RS), where RS is average gain divided by average loss. For the initial 14-period calculation, add the positive closing-price changes and divide by 14; separately add the magnitudes of negative changes and divide by 14. Include zero for periods without a gain or loss respectively. Fourteen changes require 15 closing prices. Subsequent values use Wilder’s smoothing: each new average equals the previous average multiplied by 13, plus the latest gain or loss, divided by 14. The StockCharts calculation documentation sets out this method. Older observations retain a declining influence rather than disappearing abruptly after 14 bars.
Consider a hypothetical calculation in which the smoothed average gain is six price points and the smoothed average loss is four. RS is 1.5, producing an RSI of 60. If the next closing-price change is a ten-point fall, the updated average gain becomes 78 ÷ 14, or approximately 5.5714. The updated average loss becomes 62 ÷ 14, or approximately 4.4286. The resulting RSI falls to approximately 55.71. This example shows why RSI responds to the size of the latest movement as well as its direction. It also shows that a falling price does not necessarily push the indicator below 50 immediately: previous upward movements still influence the smoothed averages.
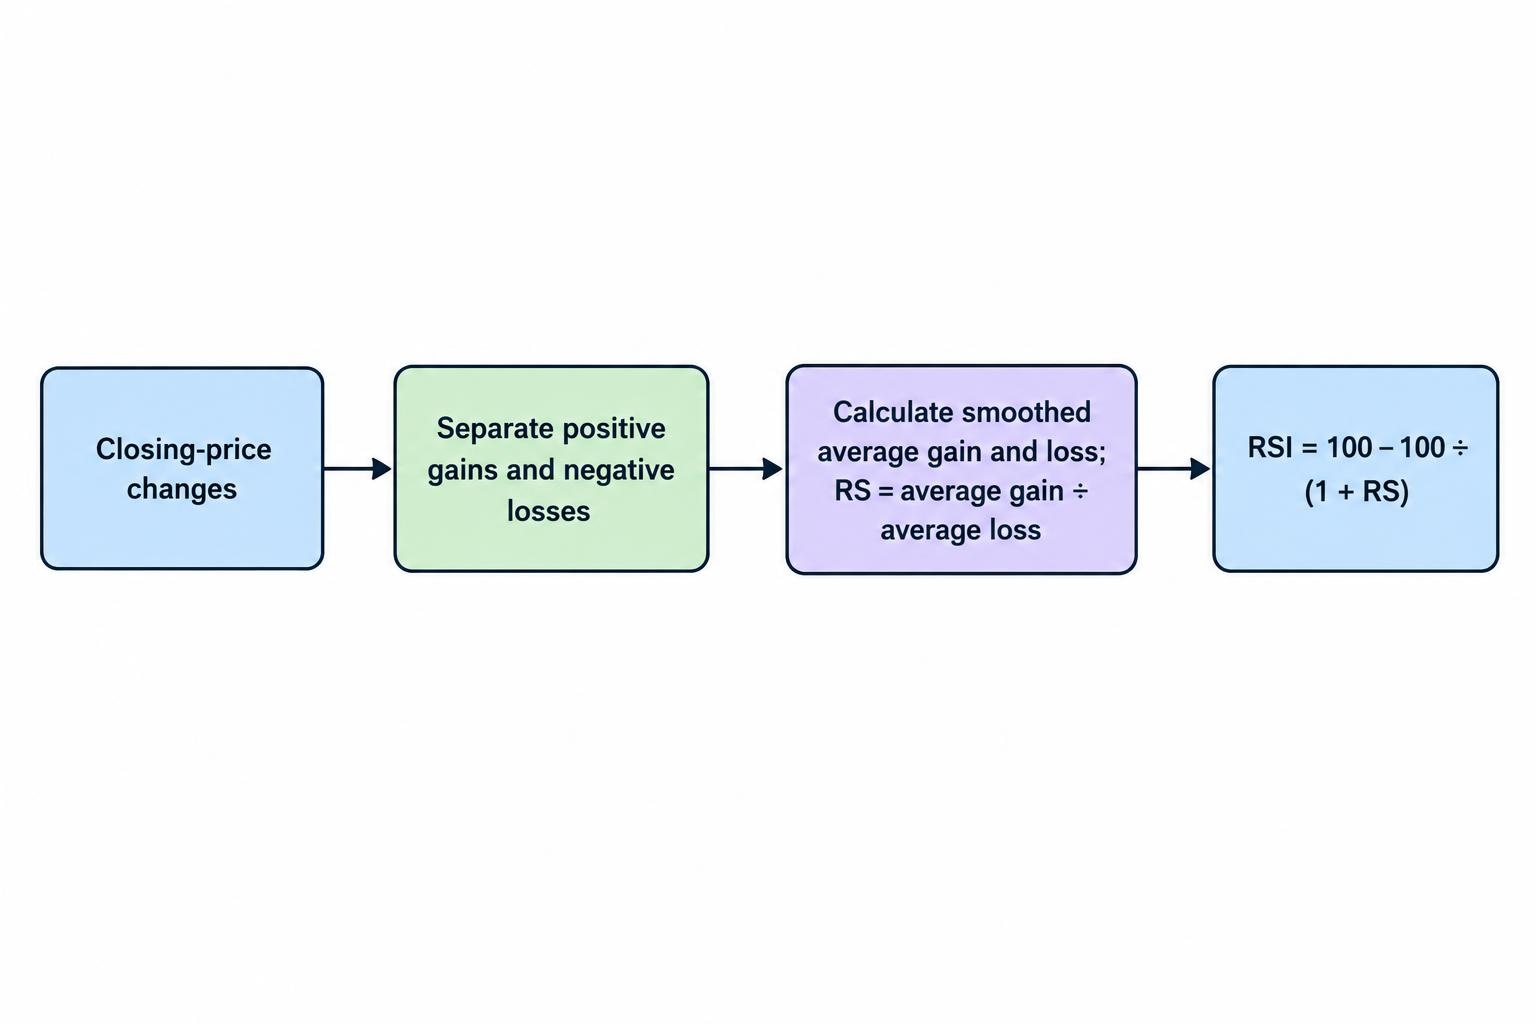
Understanding RSI readings without overinterpreting them
The conventional 70 and 30 thresholds are reference levels, not instructions to sell and buy. A market rising strongly can repeatedly close higher and keep RSI above 70 while the price continues advancing. A falling market can remain below 30 while a long position loses money. The TradingView RSI documentation describes the standard scale, thresholds and 14-bar default. In practice, the meaning of a reading depends on what price is doing around it. An extreme near the boundary of an established range presents a different trading hypothesis from an extreme immediately after an earnings shock or a decisive break through a previous trading range.
The 50 level also needs careful interpretation. When the smoothed average gain and average loss are equal and non-zero, RSI equals 50. That mathematical balance does not prove the absence of a longer-term trend. Price might be consolidating after a strong rise, with the wider trend still intact. Nor must RSI automatically drift towards 50 when successive closes are unchanged: both smoothed averages can decay proportionally, leaving their ratio unchanged. At the endpoints, positive average gains with zero average losses correspond to RSI 100, and the reverse corresponds to zero. Where both averages are zero, software must apply a convention, so flat-market behaviour and initialisation should be checked before comparing platforms.
| RSI observation | What it describes | What it does not establish |
|---|---|---|
| Above 70 | Strong upward changes relative to downward changes | That a short position will profit |
| Below 30 | Strong downward changes relative to upward changes | That the price has reached its low |
| Around 50 | Similar smoothed average gains and losses | That the wider market has no trend |
| Crossing back above 30 | A change from below to above a chosen threshold | That support will hold |
| Diverging from price | Price and oscillator swings are behaving differently | The timing or size of a reversal |
RSI settings: periods, timeframes and chart data
A 14-period RSI uses chart periods, not necessarily days. On a daily chart, its inputs are daily closing-price changes; on a five-minute chart, they are changes between five-minute closes. Shortening the setting generally increases sensitivity to recent changes, while lengthening it generally smooths the response. A seven-period RSI and a 21-period RSI therefore represent different balances between speed and stability. Neither setting is inherently more profitable. Before changing parameters, define the trading problem you are trying to solve, such as excessive entries during small fluctuations or signals that arrive after most of a move. Then test whether the adjustment improves results beyond the historical sample used to select it.
Chart construction can matter as much as the chosen number. A cash index, an index futures contract and a provider’s spread betting quote need not produce identical candles. Different daily session cutoffs can also change the closing prices entering the calculation. Confirm whether the chart displays bid, ask, midpoint or underlying-market data, and whether the RSI uses closing prices or another input. A live candle can briefly push RSI across a threshold before finishing back on the other side. A strategy based on completed candles should not treat that temporary crossing as a confirmed signal. Record the feed, session, timeframe and calculation settings so that later testing refers to the same information available when decisions were made.
How RSI can support different spread betting strategies
Range trading and mean reversion
In an established range, a trader might use RSI to investigate a possible rebound near support or a retreat near resistance. One illustrative long setup requires price to reach a previously identified support zone, RSI to fall below 30 and then a completed candle to carry RSI back above 30. Price confirmation and an acceptable distance to the stop would still be required. Buying because RSI is currently below 30 is a different rule from buying after it crosses back above 30. Both must be tested separately. The approach belongs with range trading or mean reversion, and its central risk is that the assumed range fails while the trader continues expecting another rebound.
Trend following and pullbacks
In a rising trend, an RSI pullback can be used to describe a pause within the advance rather than an invitation to sell it. A trader might first require higher price highs and higher lows, then investigate a recovery in RSI following a retreat towards the middle of its scale. The corresponding bearish approach would examine rallies within an established decline. Any chosen zones, such as 40–50 for an upward-trend pullback, are hypotheses to test rather than universal boundaries. The trend trading guide explains the wider approach. A trader should decide in advance whether RSI is being used to follow a trend or oppose an extreme; switching interpretations after a loss makes the rules impossible to evaluate fairly.
Momentum and breakout confirmation
A momentum approach can interpret an elevated RSI as evidence that recent upward price changes remain dominant. A trader considering a long breakout may therefore accept a reading above 70 instead of automatically rejecting it as overbought. The decision would still depend on the price break, available liquidity, dealing costs and the distance to an invalidation point. A high RSI cannot reveal whether enough buyers remain to sustain the move. This distinction connects RSI with momentum trading and breakout trading. If the entry only becomes available after a large price jump, the original reward relative to risk may have disappeared even though the indicator looks stronger than it did earlier.
| Approach | Illustrative role for RSI | Additional decision needed | Common failure |
|---|---|---|---|
| Range trading | Recovery from an extreme near a range boundary | Whether support or resistance remains intact | A sustained breakout defeats the reversal trade |
| Trend trading | Identifying a pullback and renewed momentum | Whether the price trend still holds | The pullback becomes a trend reversal |
| Momentum trading | Describing persistent directional strength | Whether the entry still offers enough potential reward | Entering after the move is exhausted |
| Divergence trading | Flagging disagreement between price and momentum | A defined trigger and invalidation point | Divergence persists while price keeps trending |
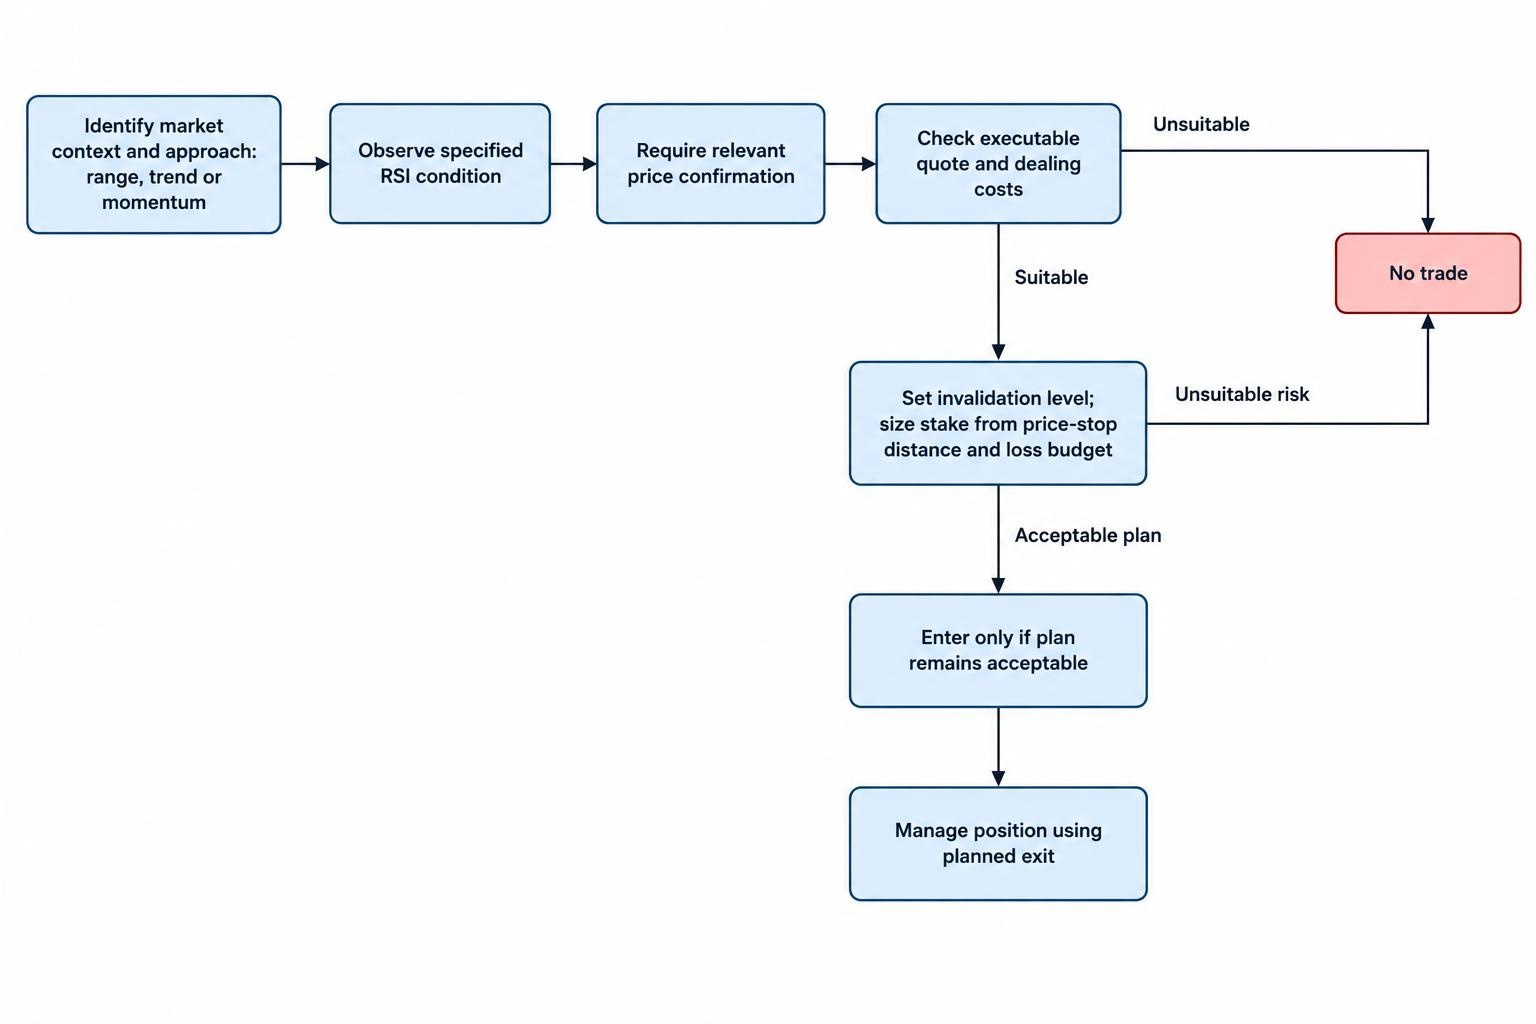
RSI divergence: useful observation, uncertain timing
Regular bullish divergence occurs when price forms a lower low while RSI forms a higher low. Regular bearish divergence occurs when price forms a higher high while RSI forms a lower high. These patterns suggest that a new price extreme is accompanied by a different momentum reading from the previous extreme. They do not tell a trader how far price must reverse, or when. A slower advance can produce bearish divergence while still taking the market to higher prices. For spread betting, that distinction has a direct cash consequence: a short position can lose money throughout an extended divergence. Treat the observation as a reason to examine price structure, not as permission to keep adding to a losing trade.
Some traders also use hidden divergence, usually as a possible continuation pattern. Hidden bullish divergence pairs a higher price low with a lower RSI low; hidden bearish divergence pairs a lower price high with a higher RSI high. Whatever terminology is used, compare corresponding swings and define how they are identified. A swing low that requires two later candles for confirmation was not known at the lowest candle itself. A backtest that enters there using future confirmation overstates what could have been achieved. Automated divergence markers need the same scrutiny: check when the signal actually became available, rather than assuming the historical label marks an entry that a trader could have taken at that moment.
What are RSI failure swings?
A failure swing is a pattern within RSI itself, rather than a comparison between RSI and price. A bullish example might progress from 28 to 36, retreat to 32 and then rise above 36. The indicator has recovered from below 30, held above that threshold on the next pullback and exceeded its intervening peak. A bearish example might move from 74 to 64, recover to 68 and then fall below 64. These sequences provide more conditions than a single threshold crossing, but extra conditions do not guarantee better results. A usable trading rule still needs to specify when the sequence is complete, what price permits entry and where the associated spread bet must be closed if it fails.
Practical example: buying an index after an RSI recovery
Assume a hypothetical index has repeatedly traded between support around 9,200–9,210 and resistance above 9,300. On the chosen chart, price tests the support area and then recovers while the completed RSI rises from 29 to 34. The available quote is 9,220 to sell and 9,222 to buy. A trader buys at 9,222 for £0.50 per point, places an ordinary stop at 9,182 and plans to close at an executable sell price of 9,302. The entry-to-stop distance is 40 points, giving a planned price loss of £20. The target is 80 points above entry, giving a potential price profit of £40 before any separate charges.
These calculations use the actual buy entry and hypothetical executable sell exits, so the bid–ask spread is already reflected in the price results. Immediately closing at the unchanged sell quote of 9,220 would lose £1. If the trade incurs £2 of funding over its holding period, reaching the 9,302 target produces a £38 net profit. An exit at 9,232 produces only £3 after that same assumed funding charge. Closing at the original entry price produces a £2 net loss, not a break-even result. With £2 of funding and no other charges, the required sell price for cash break-even is 9,226. Real funding depends on the product, direction, rate and holding period.
| Outcome | Executable sell exit | Price profit or loss | Assumed funding | Net result |
|---|---|---|---|---|
| Target reached | 9,302 | £40 | £2 | £38 |
| Early exit with a small price gain | 9,232 | £5 | £2 | £3 |
| Exit at the entry price | 9,222 | £0 | £2 | −£2 |
| Ordinary stop fills as planned | 9,182 | −£20 | £2 | −£22 |
| Market gaps through the stop | 9,142 | −£40 | £2 | −£42 |
The final row shows why a signal and a risk limit are separate matters. A gap through an ordinary stop can produce an execution price worse than the requested level. The trader’s planned £20 price risk then becomes a £40 price loss, before funding. Whether RSI had recovered above 30 at entry does not change the execution problem. A guaranteed stop, where available and subject to its terms, can address the stop-price risk, but its charge and dealing restrictions belong in the assessment. Our guides to stop losses, guaranteed stops and gap risk explain these distinctions. The example illustrates possible outcomes rather than assigning probabilities to them.
Practical example: selling a forex rally within a downtrend
Suppose EUR/USD has been making lower highs and lower lows. A rally stalls near a previously identified resistance area, while the completed hourly RSI turns down after briefly recovering above 50. An illustrative plan permits a short only after price also breaks the latest small support level. The quote is then 1.0900 to sell and 1.0902 to buy. The trader sells at 1.0900 for £0.50 per pip, with one pip defined here as 0.0001. A buy-side stop at 1.0960 is 60 pips away, giving £30 of planned price risk. A target buy price of 1.0780 is 120 pips below entry, giving £60 of potential price profit.
If the target is reached and the total funding charge is £3, the net profit is £57. If the trade instead closes at a buy price of 1.0890, the ten-pip gain produces £5 before funding and £2 afterwards. A stop execution at 1.0960 produces a £33 loss including the assumed charge. A gap to an executable buy price of 1.1000 creates a 100-pip price loss, or £53 including funding. Short positions do not automatically earn a financing credit. Check the actual contract and whether the provider defines its quoted “point” as a pip or a smaller price increment. A stake entered against the wrong unit can multiply the intended exposure without changing the RSI signal.
Position sizing: translate the price stop into pounds
RSI units cannot be used directly as a stop distance for a spread bet. A fall in RSI from 35 to 25 does not correspond to a fixed number of index points or forex pips. Position sizing therefore starts with an executable price entry and a price level that invalidates the trade. In the index example, a £20 price-risk budget divided by a 40-point stop distance gives £0.50 per point. If that £20 budget must also cover an assumed £2 funding charge, the corresponding stake would be £18 divided by 40, or £0.45 per point, before allowing for other costs or slippage. A minimum permitted stake may make the trade too large for the budget.
The stop itself should reflect the trading hypothesis and relevant price behaviour, rather than being moved closer merely to permit a larger stake. A tight stop inside ordinary fluctuations can generate repeated losses without meaningfully testing the intended setup. Conversely, widening a stop after entry increases exposure to loss unless the position is reduced. Position sizing and risk–reward analysis connect the chart decision with the account consequences. Assess related positions together as well: three RSI buy signals in closely correlated equity indices can express much the same market view. Counting them as three independent opportunities understates how quickly a common market decline could affect the trading account.
Margin and leverage: a separate calculation from planned risk
In the index example, a price of 9,222 multiplied by £0.50 per point represents approximately £4,611 of market exposure. At an assumed 5% margin requirement, the opening margin is £230.55. That deposit is neither the planned £20 stop loss nor a cap on the loss from the position. The FCA’s retail CFD rules set a 5% minimum initial margin for major stock indices; different underlying categories have different minimums, and firms can require more. Calculate margin from the actual contract specifications. A trader can have enough funds to open a position while still having an unsuitable stop distance, excessive combined exposure or too little room for adverse price movement.
The same FCA rules require account-level closeout when net equity falls below 50% of the required margin, as soon as market conditions allow. They also provide negative balance protection for covered retail accounts, limiting liability to the funds in the relevant account. These protections do not guarantee execution at an individual stop or prevent the loss of deposited trading funds. Margin closeout may end a trade before its intended technical exit, including an RSI-based exit. Keep account funding, open losses and the margin used by other positions visible alongside the chart. An analysis that considers only the indicator and ignores the account can miss the event that actually forces the position to close.
Costs can overturn an apparently successful RSI strategy
Frequent RSI entries can accumulate spread costs even when each charge looks small. Holding positions beyond the relevant funding cutoff introduces another expense for many rolling products, while short share exposure may involve borrowing charges. Wider spreads and slippage around announcements can change both entry quality and realised losses. The FCA’s review of CFD providers’ price and value examines costs including overnight funding and highlights the importance of the underlying exposure in their calculation. Compare products using the intended holding period and direction, rather than choosing on the opening spread alone. Costs paid on a large exposure can be substantial relative to the smaller amount deposited as margin.
Consider a hypothetical set of trades with a 45% win rate, an average £40 price profit on winners and an average £20 price loss on losers. Before separate charges, the average result is 0.45 × £40 minus 0.55 × £20, or £7 per trade. Average additional costs of £2 reduce that to £5. If premature exits reduce the average winner to £25 while losses remain £20, the same calculation becomes £11.25 minus £11 minus £2, or a £1.75 average loss. A high count of correct RSI signals is therefore not enough. Evaluate the size of wins and losses, costs, drawdowns and consistency of execution, using results that reflect the actual entry and exit rules.
Which traders and markets does RSI suit?
RSI may suit traders who want a numerical momentum condition within a written process and are willing to test it without assuming it predicts the future. It can be applied to share, index, forex and commodity charts, but a portable formula does not make one strategy portable across all those markets. Single shares can react abruptly to company announcements; currencies respond to relative economic and policy developments; commodities have their own supply, inventory and contract considerations. The trader still needs to understand the underlying market. Those wanting to hold positions without monitoring margin, financing or scheduled events may find leveraged spread betting unsuitable, regardless of how straightforward the indicator appears on a chart.
The timeframe should also fit the trader’s availability. A five-minute strategy requiring action after each confirmed signal is a poor match for someone who can only check prices during an occasional break. A daily RSI approach produces fewer decision points but can involve longer exposure to funding costs and overnight gaps. Day trading and swing trading therefore involve different operational demands even when both use a 14-period RSI. Alerts can reduce the need to watch every price update, but they do not verify the market context or guarantee an executable quote. Plan what happens when a signal arrives during an unavailable period, a disrupted connection or an unusually wide spread.
Advantages and disadvantages of using RSI
RSI’s main practical advantage is that it provides a consistent scale for describing the balance of recent price changes. It can turn an impression about momentum into a recorded condition, support comparison between similar setups and help a trader avoid improvising every entry. It also works alongside price-based analysis without requiring a large collection of indicators. Its weaknesses follow from the same construction: it is derived from past prices, reacts differently as market conditions change and offers no direct estimate of fundamental value or future news. Signals can arrive too early during a persistent trend or too late after a fast reversal. Whether its usefulness outweighs those weaknesses depends on the complete method and its net results.
| Advantage | Corresponding limitation |
|---|---|
| Consistent zero-to-100 scale | The same reading can have different implications in different conditions |
| Thresholds can make rules measurable | Threshold selection can be overfitted to historical results |
| Highlights changes in momentum | Momentum can weaken without price reversing |
| Supports several trading approaches | Combining conflicting interpretations can make decisions inconsistent |
| Straightforward to display and record | Easy access can encourage frequent trades without a tested advantage |
Combining RSI with other technical analysis tools
Pair RSI with information that answers a different trading question. Support and resistance can define the price area under examination; moving averages can describe trend; ATR can help assess recent price movement when considering stop distances. Each tool should have a stated purpose. RSI, MACD and several moving averages all draw on price data, so their agreement is not equivalent to several independent sources confirming a trade. Nor does adding candlestick patterns automatically improve the system. Compare the extra rule with the simpler method and ask whether it improves decisions enough to justify fewer opportunities, later entries or greater complexity.
RSI and Stochastic RSI should not be treated as interchangeable. Standard RSI compares smoothed gains and losses in price. Stochastic RSI instead locates RSI within its own recent high-to-low range, making it an indicator calculated from another indicator. Its scale, smoothing and threshold conventions depend on the implementation, and signals can differ sharply from ordinary RSI. A trader searching for an RSI template may encounter both without noticing the distinction. Record the full indicator name and settings before copying or testing a rule. The same caution applies to versions that add a signal line or extra smoothing: a crossing of RSI over its moving average is a different event from a crossing of the standard 30, 50 or 70 levels.
How to get started with an RSI spread betting method
Begin with one market, one timeframe and one intended use for the indicator. A practical learning exercise could examine completed-candle recoveries above 30 near previously defined support, while excluding scheduled major announcements. Write down how support is identified, when the signal is confirmed, how entry is priced, where the stop belongs and what causes an exit. Include a rule for abandoning the trade when the available quote has moved too far from the planned entry. Before any live account is funded, follow the FCA’s guidance on checking that a firm is authorised and has the relevant permissions. Authorisation checks address the provider; they do not validate the trading method or make market losses less likely.
Study historical examples in sequence, including failed setups and periods when no trade qualified. Then practise the same rules in a demonstration environment, recording the quote available after the signal rather than assuming execution at the previous candle’s closing price. Demo trading can help with order entry and record keeping, but cannot fully reproduce live fills or the pressure of losing money. Record the RSI reading, price context, entry, exit, stop distance, stake, costs and any rule deviation. This creates a basis for review that is more useful than screenshots of successful reversals. If the process cannot be followed consistently in practice, moving to a funded account does not resolve that weakness.
Testing RSI without building a strategy around hindsight
Testing many combinations of RSI periods, thresholds, timeframes and exits increases the chance of finding an attractive historical result by accident. The research paper The Probability of Backtest Overfitting examines this problem in investment strategy selection. Keep a record of the variants tried, reserve data for evaluation and check performance across different market conditions. A separate test period is useful but is not a cure if it is repeatedly consulted while refining the method. Prefer a defensible rule that behaves reasonably across nearby settings to one whose results collapse when a threshold changes slightly. Neither historical testing nor a forward demonstration establishes that a method will remain profitable.
Execution assumptions deserve as much attention as the indicator calculation. If a candle’s high reaches the target and its low reaches the stop, that candle alone may not reveal which happened first. A backtest should use suitable intrabar data or a stated conservative assumption, rather than automatically awarding the winning outcome. Signals based on the final candle close also cannot assume an earlier entry within that candle. Include realistic spreads, funding, slippage and periods when trading was unavailable. For divergence methods, preserve the actual confirmation delay. Review the longest losing sequence and largest drawdown alongside the average result, because a positive historical average can still involve losses that exceed the trader’s financial or practical tolerance.
Frequently asked questions about RSI spread betting
Is RSI below 30 a buy signal?
It is an oversold reading under the conventional interpretation, but it is not a complete buy signal. The market may be falling because new information has changed the price participants are willing to pay, and RSI does not decide when that adjustment ends. A tradable rule needs to define the context, the trigger and the point at which the expected rebound has failed. Some methods wait for RSI to recover above 30; others require a price break or a test of support. These are separate approaches with different entry prices and risks. Evaluate them as written rules, rather than assuming that adding the word “confirmation” guarantees a safer or more profitable trade.
What is the best RSI setting for spread betting?
There is no universally best RSI setting for financial spread betting. Fourteen periods is a conventional starting point that makes it easier to compare observations, but its usefulness depends on the market, timeframe, entry logic, exit rules and costs. A shorter setting can react earlier while generating more frequent changes of direction; a longer setting can smooth fluctuations while delaying signals. The useful comparison is between complete methods tested under consistent execution assumptions, not between isolated indicator curves. If several nearby settings give broadly similar results, that can be more reassuring than one precise setting producing an exceptional backtest. It still provides no guarantee about future trading conditions or profitability.
Can RSI be the only exit rule?
An RSI condition can define a planned exit, but it does not specify the maximum financial loss. A rule to close a long when RSI falls below 40 might trigger after a small price decline on one occasion and a much larger decline on another. It might also require waiting for a candle to finish while the open loss grows. A spread bettor therefore needs a separate account and position risk plan, including what happens during gaps or unavailable trading. When evaluating an RSI exit, compare the actual executable price and costs with alternative exits. The purpose is to manage the trade consistently while keeping its potential consequences within a considered risk framework.